

It is curious that southwestern archaeology, which has made so many other contributions to finely resolved culture history and process, has offered no general model explaining how hierarchical societies can emerge and be maintained. This likely reflects not just fashion in archaeology; the extent to which village-spanning political hierarchies and regional social stratification existed among Ancestral Pueblo societies remains controversial among southwestern archaeologists even three decades after a wrenching debate (e.g., Cordell and Plog Reference Cordell and Plog1979; Lightfoot and Feinman Reference Lightfoot and Feinman1982; Reid and Whittlesey 1990). Characterization of ethnographically documented Pueblos as peaceful and egalitarian invited interpretations of their ancestors as adhering to similar norms. Taking a different tack, we argue that Chaco represented a complex hierarchical society. We first show why this is likely, and then we demonstrate how it could have evolved from non-hierarchical (indeed, probably anti-hierarchical) (Kohler and Higgins Reference Kohler and Higgins2016) precedents.
The most well-known archaeological complex in the Pueblo Southwest, Chaco Canyon, displays clear aggrandizement and evident consolidation of power during Pueblo I times (A.D. 700–890),Footnote 1 if we interpret great houses to be “palaces” of nobles and view the nearby, less labor-intensive contemporaneous habitations to be commoners’ residences, as argued by Lekson (2015:37–38). Chacoan influence spread over most of the Pueblo Southwest by the mid-to-late Pueblo II period (A.D. 890–1145), as established beyond reasonable doubt by a number of shared features (including great houses) discussed in contributions to Lekson (ed. 2006).
The interpretation of these societies as hierarchical (or at least non-egalitarian) is strengthened by the two exceedingly rich burials from Room 33 in Pueblo Bonito, the largest and one of the oldest great houses in Chaco Canyon (Plog and Heitman Reference Plog and Heitman2010). The two males in Room 33 were interred in the ninth-century A.D. with the largest assemblage of ritual paraphernalia known from the Pueblo Southwest: intricately carved wooden sticks; wooden flutes with decorative designs; a shell trumpet; nearly 25,000 pieces of turquoise, including beads, mosaic pieces, inlays, and carved ornaments; shell bracelets and beads; abundant ceramics including several unusual forms; a cylindrical basket covered in a mosaic of turquoise; several human skulls; and a formalized cache of arrows and wooden staffs in the adjacent Room 32 (Pepper Reference Pepper1909)—all or most interpreted as curated heirlooms and ritual sacra (Heitman Reference Heitman, Heitman and Plog2015).
The next-largest set of great houses, in the Chaco-derived Aztec complex north of Chaco Canyon, also contained an unusually rich burial—an exceptionally tall male buried with a number of items (a coiled basketry shield, a wooden sword, a knife, and hafted axes or mauls) suggesting his nickname “the Warrior” (Morris Reference Morris1924:193–195). The burials at Pueblo Bonito were likely emulated elsewhere on the Chacoan periphery, including the twelfth-century burial of “the Magician” in the Sinagua area at Ridge Ruin (Gruner Reference Gruner and Van Dyke2015; McGregor Reference McGregor1943). Gruner (Reference Gruner and Van Dyke2015) argues that the ritual paraphernalia associated with the Magician burial signals a common material identity between the occupants of Ridge Ruin and Pueblo Bonito. The burials in Room 33 at Pueblo Bonito, the Magician, and the Warrior are strikingly unusual among prehispanic Pueblo burials and imply heightened wealth and status of the interred individuals, perhaps in part derived from several ritual roles. Direct evidence from burial assemblages for similar hierarchy is generally lacking or is at least much more muted within the Pueblo world before Pueblo II (PII) and after Pueblo III (PIII) ~A.D. 1145–1285.
But how much weight should we place on hidden and rare features, such as these burials, in inferring social hierarchy that (were it fundamental) must have benefited from widespread support and participation that should be visible in more mundane features? Here we offer a generalizable approach to examining hierarchy by describing transitions in site and structure size distributions through time for portions of the northern Southwest at three spatial scales—the simulation boundary in Figure 1, the greater VEPIIN boundary in Figure 1, which encompasses much of the central Mesa Verde region, and the greater Southwest, which incorporates the Northern San Juan, the Middle San Juan, and the Chacoan core and periphery.
Location of the VEP I study area (shown by simulation boundary) within the VEPIIN area, which encompasses the most populous portion of the central Mesa Verde region.

Abundant, well-preserved archaeological traces in the Southwest enable us to examine final products of years of planning and group cooperation, as materialized in great kivas, for example. Such data form patterns to be explained, yet they are more or less silent on the processes creating those patterns. We must turn to models as descriptions of—and potential generative explanations for—those processes, and then return to the archaeological record to determine whether the models are capable of generating patterns more or less similar to those we encounter. We build on the Village Ecodynamics Project's (VEP) simulation Village to explore the consequences of hypotheses about the process of hierarchy formation. The processes on which we focus are the collaboration of households within groups, the growth of leadership within groups in tandem with the growth of groups, and the formation of groups-of-groups (polities) in the context of competition over arable land. We then compare the demographic patterns and the distribution of polity sizes generated by the simulation with the empirical evidence presented here on characteristics of size distributions for kivas and settlements. The thread connecting these disparate datasets will be an inference of generating process from the nature of the size distributions, and an explicit definition of (what we claim to be) the same process in the simulation, which generates size distributions similar to those identified for kivas and settlements.
In the following section, we introduce useful concepts for characterizing the structure of size relationships among kivas and settlements. In the third section, we examine site and kiva size distributions using these concepts. Then we introduce a model capable of generating similar size relationships among growing inter-village polities and explore its behavior using various parameterizations on virtual landscapes resembling an 1,817-km2 portion of southwestern Colorado between A.D. 600 and 1280. Harmonies between the empirical record and the simulation results suggest that sociopolitical processes in large portions of the Pueblo world during the PII and parts of the PIII periods were substantially different from both earlier and later times, indicating the development, and eventual partial dissolution, of village-spanning political hierarchies.
Nestedness, Hierarchy, Log-Normality, and Power Laws
Whether or not they exhibit hierarchies in power or wealth, human societies typically exhibit a nested structure that may be termed “hierarchical” in the more limited sense that units at each scale are nested within units at more inclusive scales (Haas et al. Reference Haas, Cynthia, Klink, Maggard and Aldenderfer2015; Johnson Reference Johnson, Renfrew, Rowlands and Segraves1982). For example, group size of ethnographic hunter-gatherer societies scales from individuals to families, bands, villages, and large aggregates (Hamilton et al. Reference Hamilton, Milne, Walker, Burger and Brown2007). This scaling, or nesting, may enable efficient movement of information among all members of the group (Bernardini Reference Bernardini1996; Kosse Reference Kosse2000; Lekson Reference Lekson and Turan1990), although several other possible functions for the larger scales (beyond those that are typically co-resident) have been proposed (Kosse Reference Kosse1994; Lehman et al. Reference Lehman, Phyllis, Dunbar, Dunbar, Gamble and Gowlett2014; Lekson Reference Lekson and Turan1990). The concept of “Horton orders” (after Robert Horton's [Reference Horton1945] calculations of the average number of streams flowing into ever-larger streams) describes the scaling constant relating the numbers of groups of similar sizes that participate in or belong to groups of the next larger size, which, in turn, nest within yet larger groups. In many cases, the larger groups encompass three to four (Hamilton et al. Reference Hamilton, Milne, Walker, Burger and Brown2007; Zhou et al. Reference Zhou, Sornette, Hill and Dunbar2005) of the next-smaller-size groups, and if this ratio is constant as the scale increases, it is said to be self-similar.
Many archaeologists have suggested that, during the PII and PIII periods, one or more regional system(s) featuring at least three tiers of site sizes can be discerned in many portions of the Pueblo region, with the largest great house sites (community centers) at the top, followed by significantly smaller sites with more modest great houses and the vernacular “Prudden unit” hamlets at the bottom. Powers and colleagues (Reference Powers, Gillespie and Lekson1983:Table 41; see also Judge Reference Judge, Cordell and Gumerman1989:222) recognized three site-size tiers within just great house floor-area estimates, implying a four-tiered hierarchy overall if small villages and hamlets without a great house were part of the same system. Some (e.g., Lekson Reference Lekson2006:32–33; Lekson et al. Reference Lekson, Gillespie and Windes1984:267) see this site-size hierarchy—with the great houses in Chaco Canyon at the top of the pyramid and sites outside the canyon as second or third tier—as evidence for sociopolitical hierarchy. Others (e.g., Johnson Reference Johnson, Cordell and Gumerman1989) propose that the observed distribution of site sizes can be explained by the concept of “sequential hierarchy,” a relatively egalitarian organizational alternative to elites, forming in response to increasing group membership generating “scalar stress” and driving group fission.
Alberti (Reference Alberti2014) recognizes that change from simple nesting of group sizes as a result of decision-making via a sequential hierarchy—in which no differential power may be implied—to a site-size hierarchy that implies power differentials will take multiple steps. In general, it is reasonable to presume that sequential hierarchies may constitute a “middle stage between fission and the emergence of non-consensual (i.e., hierarchical) decision-making bodies” in a growth process (Alberti Reference Alberti2014:3). Fissioning might be the immediate group response to scalar stress in contexts where that is possible (Lyman Reference Lyman2009) and such processes might not generate group integrative facilities and would also not imply hierarchies.
In more densely occupied landscapes, fission might not be possible, or easy, and we might expect ritual facilities to appear, providing locations for “sequences of redundant and invariant acts . . . [which] can ameliorate scalar stress by promoting an effective communication flow and by fostering in-group consensus and cohesion” (Alberti Reference Alberti2014:2; see also Adler and Wilshusen Reference Adler and Wilshusen1990). Coward and Dunbar (Reference Coward, Dunbar, Dunbar, Gamble and Gowlett2014:388) suggest that more or less universal appearance of such structures is due to the fact that “elaborating the ‘settings’ for social interaction [with ritual facilities for example] simplifies social interactions and performance by off-loading the social information necessary for effective interactions from human memory into the material environment.”
Such facilities are likely to become necessary as community sizes exceed ~150 members and are likely locations for religious practices that require investment of time, currency, or adherence to various forms of self-denial, making participation costly enough to deter fakers (Coward and Dunbar Reference Coward, Dunbar, Dunbar, Gamble and Gowlett2014:390). Performances are likely to include rhythmic dancing, chanting, and even laughter, triggering the release of endorphins, enhancing group solidarity and encouraging pro-social tendencies within the group (Coward and Dunbar Reference Coward, Dunbar, Dunbar, Gamble and Gowlett2014:392–393). By themselves, the presence of such facilities need not indicate significant power differentials, although, if further growth eventually prompted the emergence of doctrinal religions, development of religious hierarchies might be expected. We suggest that analysis of the size distributions of some of these facilities (kivas and great kivas) provides insight into the processes that generate them and that, in turn, are relevant to questions of differential social power.
We acknowledge that what we call kivas here likely had multiple functions, often quotidian but occasionally sacred. Our concern is for the capacity for social integration that these structures embodied (Ryan Reference Ryan and Gyucha2017) at the scales of organization for which they were intended and their ability to reinforce social integration (and potentially hierarchy) through their use.
Turning to the question of site sizes, Duffy (Reference Duffy2015) identified at least five processes other than regional political hierarchy capable of generating site-size hierarchies in the archaeological record. Three of these result from time-averaging effects that are minimized by the relatively fine dating employed here (anchored by tree-ring dating, extended to ceramic depositional signatures). One of the other processes Duffy (Reference Duffy2015:88) mentions, however—growth differentials due to differences in catchment productivity—must be considered before interpreting hierarchies in site-size histograms as possible evidence for regional functional specialization. Glowacki and Ortman (Reference Glowacki, Ortman, Kohler and Varien2012) examined potential maize productivity (derived as explained by Kohler Reference Kohler and Varien2012:85–111) for the ~90 community centers in the study area within which the simulation is set (Figure 1). Community centers are the largest sites in their neighborhoods, usually contain civic-ceremonial architecture, and tend to be occupied longer than is typical for smaller habitations. Glowacki and Ortman (Reference Glowacki, Ortman, Kohler and Varien2012:234) showed that the peak population of centers is only weakly associated with the estimated mean maize productivity of their surrounding 2-km catchments. As maize constitutes 70 percent or more of the local diet, its productivity is highly relevant (Coltrain et al. Reference Coltrain, Janetski, Carlyle, Staller, Tykot and Benz2006; Matson Reference Matson2016). This suggests that variability in community center size was greatly influenced by factors other than catchment productivity, though catchment productivity is not irrelevant.
The community-center size differentials we see in this area may represent regional functional specialization (Duffy Reference Duffy2015), for example, as the outcome of a political/economic structuring process, a likely result based on what we know about differential representation of structure types through time. Group-assembly features such as great kivas and plazas are present in most of the pre-A.D. 980 community centers. In the A.D. 1000s, restricted-use features (especially great houses) become the most common civic-ceremonial architecture, replaced in turn after A.D. 1140 by controlled-access features, such as towers and enclosing walls, until regional abandonment in the mid-to-late A.D. 1200s (Glowacki and Ortman Reference Glowacki, Ortman, Kohler and Varien2012: Table 14.2). By the mid-A.D. 1100s, great kivas become characteristic of only the largest centers, suggesting that they served as periodic group-assembly points for a number of surrounding smaller centers, defining a hierarchy that was simultaneously geographic, ritual, and size-based.
Two previous studies have characterized site-size hierarchies in this region. For the central Mesa Verde region (an area larger than—though encompassing—the areas for which we have settlement-size data and simulation results), Lipe (Reference Lipe, Varien and Wilshusen2002:217–220) studied habitation sites with an inferred momentary population of 50 or more. On the basis of a rank-size analysis, Lipe (Reference Lipe, Varien and Wilshusen2002:218–219) determined that, from A.D. 1150–1225, sites exhibit a “well-integrated” settlement system in which the ranks plotted against the sizes approximate the expected diagonal (log-normal distribution) very closely. From A.D. 1225–1290, however, the ranks plotted against the sizes deviate convexly upward from the diagonal, usually interpreted as indicating the presence of several competing systems (Lipe Reference Lipe, Varien and Wilshusen2002:218–219).
For the same region examined in the simulations reported here, Kohler and Varien (Reference Kohler, Varien, Bandy and Fox2010) characterized the distributions of all sites with more than one household for 14 periods from A.D. 600 to 1280. Generally, their results (Kohler and Varien Reference Kohler, Varien, Bandy and Fox2010:Figure 3.5) echoed those of Lipe (Reference Lipe, Varien and Wilshusen2002:218) where periods overlapped, although they additionally recognized a slight tendency for the largest site (which after A.D. 1060 is Yellow Jacket Pueblo) to be larger than expected (until at least A.D. 1140) by the rank-size metric. Kohler and Varian (Reference Kohler, Varien, Bandy and Fox2010:54) suggested that this tendency toward primacy for Yellow Jacket Pueblo measured “the degree to which it drew benefits—unknown in nature—from other settlements through processes that remain to be defined.”
Here we apply recent advances in characterizing scaling relationships to sharpen these arguments, using empirical estimates of kiva sizes (and the groups they could accommodate), momentized site populations, and territory sizes for groups of sites generated by the simulation. To shed light on the processes that generate such distributions, we focus on whether these correspond more closely to a log-normal or to a power law distribution. Although these distributions look somewhat similar (both have long tails to the right and so exhibit positive skew in which, for example, small sites are common but large sites rare), they differ in their generating processes in ways that relate to the equality of their constituents.
If the size of some variate (e.g., settlement population) is graphed against its frequency, and the distribution is normal (Gaussian) when the logarithm of the size is used, the distribution is said to be log-normal (Aitchison and Brown Reference Aitchison and Brown1957:1). Log-normal distributions are classically produced by something that can be called the law of proportionate effect (Aitchison and Brown Reference Aitchison and Brown1957:1) or the multiplicative process (Mitzenmacher Reference Mitzenmacher2004:235). If settlements grow (or shrink) in response to a number of unrelated processes, each of which is proportionate in its effect to the size of the settlement in the previous time step, the expected result is a log-normal distribution of settlement sizes.
If settlement sizes (or kiva sizes) conform to a log-normal distribution, we argue that this implies the outcome of a number of unrelated processes, but importantly not including a process in which largeness itself was disproportionately rewarded. Power law distributions, on the other hand, are classically generated by preferential attachment. An example would be a case in which the largest existing settlement is also the preferred target for migration. Mitzenmacher (Reference Mitzenmacher2004:233–235), following Mandelbrot (Reference Mandelbrot and Jackson1953), also mentions optimization as a possible process leading to power law distributions, although its efficacy has been debated (Simon Reference Simon1960). Some variate, x, obeys a power law distribution if it is drawn from the probability distribution p(x) α x− a , where a is a scaling exponent typically taking on a value between 2 and 3. We know (Albert et al. Reference Albert, Jeong and Barabási1999) that the in-degrees and out-degrees of nodes in the worldwide web are commonly power law distributed, and the reasons that more popular nodes will be preferential targets for new links seem obvious in this case.
Power law-like distributions frequently indicate the outcome of processes such as consolidation of power and growth of hierarchy (Grove Reference Grove2011). Modern city population sizes follow a power law distribution (e.g., Auerbach Reference Auerbach1913; Bettencourt Reference Bettencourt2013; Bettencourt et al. Reference Bettencourt, Lobo, Helbing, Kühnert and West2007) because large aggregates create increasing returns in wealth and innovation, in turn attracting to themselves a growing number of people. In our data, we argue that settlement size distributions matching power laws suggest that the largest settlements were benefiting the most from the ritual or political system. To strengthen this inference, we present model results in which larger groups come to have a power advantage over smaller groups as regional population size and density increase, and demonstrate that this produces power law–distributed territory sizes. Beyond the factors considered in the simulation, larger settlements would likely have served as engines of innovation and attracted more residents (Bettencourt et al. Reference Bettencourt, Lobo, Helbing, Kühnert and West2007), more wealth (Brown et al. Reference Brown, Watson, Gravlin-Beman, Liebovitch and Braswell2012), more ritual (Glowacki and Ortman Reference Glowacki, Ortman, Kohler and Varien2012), and more feasting (Mills Reference Mills2007).Footnote 2 These benefits will, in the event, be balanced against the social and economic costs of being large, including alleviating size-induced social frictions, as well as traveling greater distances to fields and slowly renewable resources such as deer and firewood.
With these ideas in mind we begin by examining data on kiva sizes for the large portion of the Pueblo Southwest studied by Ryan (Reference Ryan2013:Figure 2.1). We then turn to estimated population sizes for habitations (including community centers) in the VEPIIN area (Figure 1). Using these two datasets may allow us to profit from convergence of semi-independent lines of evidence. In both cases, we attempt to determine whether their size distributions through time correspond to a power law, which might suggest the development of supra-village polities, or exhibit log-normality, which suggests a variety of non-hierarchical generating processes. After introducing the simulation model, we will also compare the distributions of territory size generated by the simulation to these two theoretical distributions.
Scaling Relationships in Archaeological Data
Kiva Sizes
For the last three decades, archaeologists in the central Mesa Verde region have identified small kivas (with diameters less than 10 m) as serving a domestic function in addition to focusing some ritual activities at the level of the household, extended household, or lineage group. Larger structures such as great kivas (10 m or larger) focused non-domestic ritual activities for one or more communities (Adler and Wilshusen Reference Adler and Wilshusen1990). If we grant that kiva sizes are related to the sizes (and types) of the groups they served, and if settlements have fairly discrete hierarchical size categories (e.g., hamlets and villages), we might also expect kiva dimensions to exhibit fairly discrete size classes. Further, if either of these size distributions appears more likely to have been drawn from a power law than a log-normal distribution, that will be taken as evidence for some type of reward for largeness—such as the processes we define for the simulation—in and of itself.
Susan Ryan (Reference Ryan2013) compiled data on 407 fully excavated kivas of all sizes during PII and PIII periods within three large subregions of the prehispanic Pueblo Southwest: the Northern San Juan (NSJ), centering on, though larger than, the central Mesa Verde region; the Middle San Juan (MSJ), centered on the Aztec area; and the Chaco Core and Periphery (CCP), centered on Chaco Canyon. Of those 407 structures, we used the 248 with bench widths and added 224 kivas to her dataset, mostly in the NSJ, whose diameters could be estimated accurately, even if they were not fully excavated. Diameters in Ryan's data were computed from bench-face to bench-face (Ryan Reference Ryan2013:133, 136); diameters for additional pit structures we added here were computed by measuring the interior of kiva circles on maps. Our total sample of 472 structures represents an unknown proportion of the total population of PII-PIII–period preserved kivas in these regions. It is highly probable that our sample is weighted toward larger size classes, since they are more noticeable and more likely to have been investigated.
Of greater interest than the diameters of kivas, however, are the group sizes that they could accommodate. One approach to estimating these is simply to assume that each person needs a square meter of space, so that a kiva with a diameter of 7 m (with a floor area of 38 m2) could accommodate a group of 38 (Van Dyke Reference Van Dyke and Lekson2007a:119). Alternatively, one might partition the space into spectator and performance space.
Of course, performance space means different things for great kivas and household kivas, and here we use the term broadly to incorporate both spectacles and performances, as defined by Inomata and Coben (Reference Inomata and Coben2006). Spectacles are “gatherings linked around theatrical performance of a certain scale in clear spatial and temporal frames, in which participants witness and sense the presence of others and share a certain experience” (Inomata and Coben Reference Inomata and Coben2006:16). This assumes an audience and an emotional response, includes props, and incorporates a great deal of symbolic material. Events performed in great kivas would be spectacles typically witnessed by a group of people and incorporating many props, such as foot drums and elaborate costumes laden with symbolic associations. Spectacles also incorporated participants outside the confines of the kiva walls through sound, adding to their scope.
Performance, on the other hand, includes “informal daily activities as forms of human interactions and self-presentations” (Inomata and Coben Reference Inomata and Coben2006:14). A performance, then, is any activity that can affect the life of the performer as well as a potential observer (Inomata and Coben Reference Inomata and Coben2006; Goffman Reference Goffman1959). Grinding maize, weaving a blanket, and teaching a child all fall within its scope. Such performances could have incorporated other people performing complementary tasks related to the activity at hand (e.g., preparing the kernels for grinding). We assume that each spectator (or maize-grinding helper) needs 1 linear m around the circumference and each performer needs 4 m2 (a generous figure allowing for presence of floor features).
A kiva with a diameter of 7 m has a circumference of ~22 m and an area of ~38 m2, allowing for 22 spectators and 38/4 = ~9 performers, or a total group size of 31. For pit structures more than 4 m in diameter, this method yields lower group-size estimates than assuming 1 m2/person. Even though we acknowledge that the activities in small and great kivas were typically different, we use the same formula to estimate the probable group size in both.
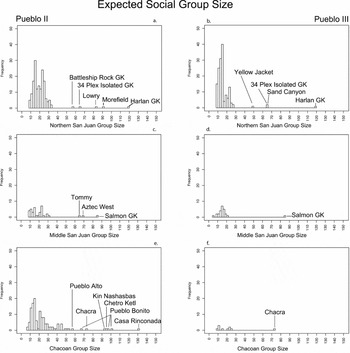
Using this approach, we translate diameters into expected group sizes for kivas in the PII and PIII periods (Figure 2). The most dramatic feature in this figure is the loss of most large kivas (groups) in the two southern areas in the PIII period, with the exception of the Salmon Ruins great kiva (dated to PII–PIII by Windes and Bacha Reference Windes, Bacha and Reed2008:130) and the Chacra Mesa great kiva (dated to PII–PIII by Van Dyke Reference Van Dyke and Lekson2007b:123). Multiple modes can be seen in most of these histograms.Footnote 3 In both the NSJ and MSJ during the PII period, modes occur around 15 and 25 participants, with possible larger modes in the 60–70 and the 80–90 range. Pueblo II CCP sites also exhibit modes around 15, 25, and 90, but, unlike those to the north, there is apparently an additional mode around 45 participants (most of these appear to be what Windes [Reference Windes2015:337] calls court kivas), and the unique great kiva, Casa Rinconada (Vivian and Reiter Reference Vivian and Reiter1965:9–26), which, according to our (possibly conservative) rules, would have accommodated some 130 participants.
Expected social group sizes represented by kiva floor areas, calculated from kiva diameters assuming circular shape; PII, left column; PIII, right column. NSJ data are in the top row, MSJ data in the second row, and the CCP in the third row. Axes are standardized.

During PIII both the NSJ and CCP retain modes around 10--15 and 25 participants though the MSJ seems to retain only the smallest-size class. In the NSJ, there continues to be a possible mode in the 48–65 participant range, whereas the long-lived Harlan Great Kiva (Coffey Reference Coffey2014) in the Goodman Point community fills a Casa Rinconada-like role as the largest integrative structure in the region. Yet there seem to be fewer kivas overall, and fewer kivas in the middle-range of sizes, during the PIII period, although we know that open-air plazas, or common areas, as well as bi-wall and tri-wall structures, increased in frequency (Glowacki Reference Glowacki2015:69). Such spaces may have reduced the need to invest in costly and complicated kivas, and perhaps substituted in particular for kivas serving ~40–50 people. However, the functions of the multi-walled structures are uncertain, and plazas presumably served a variety of purposes. For these reasons we focus on kivas.
For these kivas, we can suggest a scaling parameter on the order of 1.7 to 2 (15 people × 1.67 = 25 people; 25 people × 1.8 = 45 people; 45 people × 2 = 90), suggesting that, as ritual moved beyond the household, each larger structure might accommodate one or two of the people participating in the rituals in the next-smaller-size kiva. This argument does not abandon the point of view that all non-great kivas had residential functions; it merely recognizes that such kivas also likely had ceremonial functions. If we assume strict nestedness, we can express the same result slightly differently. Kivas in the 25-participant size range should be aggregating their participants from about (25/1.67=) 15 of the 15-participant-size kivas; each kiva in the 45-participant size range should be drawing participants on average from about (45/1.8=) 25 of the 25-participant-size structures; and great kivas in the 90-participant size range should be drawing on about (90/2=) 45 kivas in the 45-participant size range. By this logic a “standard” great kiva accommodating about 90 people could serve representatives of (25 × 45=) 1,125 of the social units represented by the smallest kivas—an interestingly high number, which suggests either that strict nestedness did not apply or that such great kivas could easily accommodate participants from two very large communities of >500 households each.
The relationship between the 90-participant great kivas and the 130 we estimate for Casa Rinconada has a somewhat lower scaling parameter (90 × 1.44 = 130), but, if we nevertheless use the same logic, it may have been drawing its 130 participants at the rate of one or two representatives each from about (130/1.44=) 90 of the 90-participant size great kivas. This might be plausible; the Outlier Database (Chaco Research Archive 2010) lists 106 outliers with great kivas, not all of which may have been in use at once.
Although these numbers might seem to suggest an implausibly high number of households represented in increasingly large structures, Windes (Reference Windes2015) argues that court kivas at Chaco were in many cases used by non-residents. If the distance traveled to Chaco Canyon was great, it is reasonable to expect that only one or two representatives of kivas in the 25-participant class might have made the journey. Van Dyke (Reference Van Dyke and Lekson2007a:119) likewise suggests that great kivas accommodated only a “small fraction of the resident or visiting population,” intentionally (one presumes) restricting access to that segment.
Chaco researchers are increasingly embracing regional analyses that imply a broad spatial scope for Chacoan social integration, if not explicitly arguing for a Chacoan polity. Van Dyke and colleagues (Reference Van Dyke, Bocinsky, Robinson and Windes2016) demonstrate that shrines, stone circles, and herraduras enhanced visibility between great houses and created a network of visual dominance over the landscape that seems to peak after A.D. 1000. Chacoan road systems betray regional-scale planning (if not functional economic integration) (Kantner and Hobgood Reference Kantner, Hobgood, Forte and Williams2003), and roads and directional alignments between outlier great houses in the middle San Juan suggest subregional coordination for the observation of celestial events (Coffey Reference Coffey2016:14). It remains to be seen whether these systems demonstrate coordination and unity at the scale of the Chaco world or merely a shared subregional identity that is undoubtedly influenced—but not controlled—by Chaco (Kantner Reference Kantner2003:218). Here, we argue that a regional system with Chaco at its core need not have its origins in a unified system, but instead can emerge from hierarchical power relationships that form at a local scale. As we shall see, kiva size distributions across the Pueblo Southwest reify, and likely served to reinforce, hierarchy at multiple scales of Pueblo society.
Analysis of Kiva Size Distributions
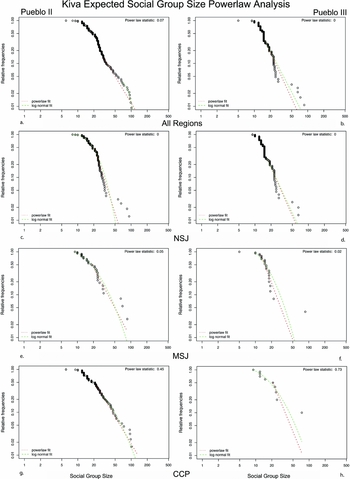
Now we examine these kiva data from the perspective of whether (and when) their size distributions fit those expected by a power law, using the log-linear distribution as an explicit comparison, given the ease with which these two distributions can be confused. Many studies (e.g., Brown et al. Reference Brown, Watson, Gravlin-Beman, Liebovitch and Braswell2012) identify the fingerprints of power laws based solely on visual inspection of distributions. Here we use the poweRlaw package (Gillespie Reference Gillespie2015), which implements procedures suggested by Clauset and colleagues (Reference Clauset, Shalizi and Newman2009), with results displayed in Figure 3. Since log-normal and power law distributions differ primarily in their extreme right tails, Gillespie (Reference Gillespie2015:4) employs a Kolmogorov-Smirnov test to locate the minimum value in an empirical distribution at which a power law ought to apply, setting that as the xmin value for the test. We imposed the same xmin value on the log-normal distribution to facilitate comparison of the two.
Power law analysis of the expected social group sizes represented by kivas of various sizes, by period and region. Power law probability values from Table 1 are reported in the upper right-hand corner of each panel.

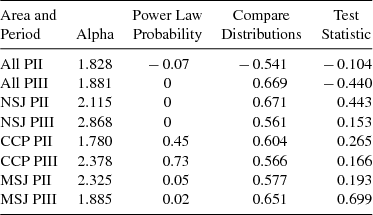
Table 1 summarizes the results of this examination. The alpha parameter reports the slope of the best-fit power law line; note, for example, in Figure 3 that the power law-fit line slopes down more rapidly for NSJ PIII (alpha = 2.9, Figure 3d) than it does for CCP PII (alpha = 1.8, Figure 3g). Then we tabulate the results of several complementary tests that do not always deliver precisely the same conclusions. The power law probability reports the probability that the empirical data could have been generated by a power law; the closer that statistic is to 1, the more likely the distribution is generated by a power law. We consider values less than .1 as rejecting the hypothesis that the distribution was generated by a power law (Clauset et al. Reference Clauset, Shalizi and Newman2009:16). The test statistic indicates how closely the empirical data match the log-normal. Negative values indicate log-normal distributions, and the higher the absolute value, the more confident the interpretation. However, it is possible to have a test statistic that indicates a log-normal distribution in addition to a power law probability that indicates a power law, so we employ the compare-distributions test to compare the fit of the distribution to a power law and to the log-normal distribution. Values below .4 indicate a better fit to the log-normal; those above .6 favor a power law; intermediate values are ambiguous.
Summary of Conformity of Kiva Size Distributions to Power Law Expectations.

Discussions with the developer of the procedure implemented in the poweRlaw package lead us to suggest that over-sampling of the larger kivas, in the NSJ in particular, is likely responsible for the somewhat contradictory results in Table 1, where power law probability (when it rejects a power law) is often at odds with the compare distribution and test statistic indicating power laws. Clauset (personal communication 2016) suggests that our results may indicate that the NSJ and PII–PIII kiva data represent weak power laws (Supplemental Text). Grove's (2010:Figure 5) analysis of ritual centers in Ireland showed that the largest stone circles in his sample also tended to weaken what appeared from the body of the distribution to be a power law distribution.
With that in mind, the results from Table 1 generally support the inference that kiva sizes in Chaco Canyon and its periphery in PII and probably PIII times were generated by a power law-like process. Elsewhere, this is slightly less clear, although in all three regions and in both periods power law distributions fit the kiva data better than log-normal distributions do.
Analysis of Settlement Population Distributions
We now turn to the results of the same analysis based on estimates for the number of households in habitation sites by period, as compiled by Schwindt and colleagues (Reference Schwindt, Bocinsky, Ortman, Glowacki, Varien and Kohler2016) for the subportion of the NSJ studied by VEPII, using only those sites assigned one or more households for that period. The site-size estimates used here were generated by steps one to four in Schwindt et al. (Reference Schwindt, Bocinsky, Ortman, Glowacki, Varien and Kohler2016:78–80), which were then momentized by multiplying by the mean occupation span in each period (from Varien et al. Reference Varien, Ortman, Kohler, Glowacki and Johnson2007:Table 3), divided by the length of each period. The histograms of site size (Supplemental Figures 1 and 2) show the expected pattern of many small sites and decreasing numbers of sites of larger sizes through all periods. Populations of the largest sites, however, tend to increase through time. Discrete modes are less visible in the settlement size distributions than for the kivas; although the case for the presence of modes is visually stronger in the later periods (Supplemental Figure 2), we do not pursue their identification here.
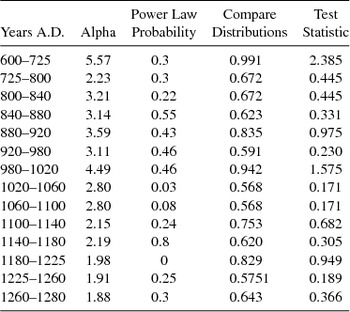
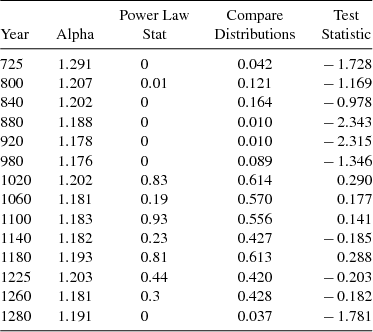
In general, the site size distributions are more clearly power law-distributed than are the kiva sizes (Supplemental Figures 3 and 4; Table 2). Exceptions are the periods A.D. 1020–1060, A.D. 1060–1100, A.D 1180–1225, and A.D. 1225–1260, all of which have one or two ambiguous indicators, although the test statistic in each case points to a power law. Rather surprisingly, the two earliest periods appear to correspond to a power law, although the results may be spurious, given that nearly their entire distribution after momentizing is composed of many one-household settlements.
Summary of Degree of Conformity of VEPIIN Settlement Size Distributions to Power Law Expectations.

Summary of Empirical Results
Overall, the case for processes such as preferential attachment (expected for power law fits) is clear for PII and probable for PIII kiva size distributions, particularly in the CCP. With a few possible exceptions, the site size distributions also conform to power law expectations.
Of course, these outcomes only hint at an explanation for the development of this structure. Can a process of preferential attachment, or something like it, that withstands the test of plausibility for the societies represented here be built into a model that generates power law structures for size distributions? For example, do the largest settlements (or groups of settlements) grow ever larger by drawing in (or compelling the participation of) more people for ritual, exchange, and other social functions? We now describe a model providing a candidate explanation for the empirical results reviewed so far.
The Model
The Village simulation is built on a foundation of trees. Ring-width analysis generates temporal series of annually resolved estimates of temperature and precipitation from A.D. 600–1300 that in turn generate spatialized estimates of potential maize productivity and the productivity of the various plants that provide food for deer, rabbits, and hares, and wood for cooking and heating. The agents in this model represent Pueblo households who farm maize, hunt deer and leporids, raise turkeys, fetch water and fuel, trade resources, and react to local variability in environmental productivity (also affected by local densities of other households) by relocating their settlements to more productive land, or by intensifying (adding more farm plots, raising more turkey in lieu of hunting). On top of this base simulation, described extensively in Kohler and Varien (Reference Kohler and Varien2012), we add a number of changes allowing the agents to live in territorial groups of varying political organization and to form polities.Footnote 4
The model we propose makes three important but well-founded assumptions. First, as warranted earlier, we assume the centrality of maize in the Pueblo diet. The best lands to produce maize were worth competing over due to the dominance of maize in the diet and the high spatial variability in potential production. Second, we assume a strong trend of population growth during the periods considered here, which is clearly demonstrated for the Southwest as a whole (Kohler and Reese Reference Kohler and Reese2014) and for the VEPIIN area (Figure 1; Schwindt et al. Reference Schwindt, Bocinsky, Ortman, Glowacki, Varien and Kohler2016). Third, we build into the model the possibility of mortal conflict between groups, recognizing that these societies were subject to enough sporadic violence to rank them “among the most violent societies studied by anthropologists or archaeologists” (Kohler et al. Reference Kohler, Ortman, Grundtisch, Fitzpatrick and Cole2014:458).
The model, therefore, features growing groups that may come into conflict over limited expanses of superior arable land. By virtue of their size, some of these groups are able to incorporate others, by force or threat, forming multi-settlement polities we call complex groups that can grow or shrink according to the climate-mediated production of the lands they encompass and the competition they encounter. These processes typically result in a chain of subordinate groups (or often a more tree-like structure) linked to a dominant group by flows of tribute in maize, mutual protection in defense, and coordinated action in offense. We demonstrate that this model results in territory sizes for these polities that are power law distributed—unsurprising, given that they are generated by a big-get-bigger dynamic—and we infer that flows of tribute and coordinated action could help to generate the sorts of power law-distributed settlement sizes (and therefore kiva sizes) we documented above for the archaeological record.
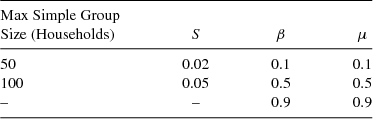
Model details appear in the Supplemental Materials and include sections on the public goods game; parameter selection, group formation, and territoriality; conflict, merging, and tribute; revolt in complex groups; and fission in simple groups (also Kohler et al. Reference Kohler, Crabtree, Bocinsky, Hooper, Sabloff, Sabloff, Krakauer, Flack, West, Bettencourt and Lobo2016.)Footnote 5 To the base Village model, the model reported here adds a territorial, kin-based group structure in which households (agents) live in simple groups that annually play a within-group public goods game, deciding to elect a leader (the more costly alternative when groups are small) or perform mutual monitoring against defection (the more costly alternative when groups are large). Simple groups can therefore be either non-hierarchical or hierarchical. If a simple group reaches a population size parameterized in the simulation (either 50 or 100 households), it fissions (Table 3).Footnote 6 When group territories begin to encroach on each other, groups may merge or fight, in either case linking them into complex groups with a hierarchical organization. Subordinate groups in complex groups pay tribute to the ultimate dominant group, passing through any intermediate groups in the chain (Steponaitis Reference Steponaitis1981). Finally, simple groups (along with their subordinates, if any) may choose to revolt from their dominant group to form a simple group (by themselves) or a complex group (with their existing subordinates). Thus, the model unites the two relational mechanisms identified by Dubreuil (Reference Dubreuil2010:140) as “intimately linked to the evolution of hierarchies”: emergence of corporate groups (our simple groups) and social division of sanction (the leaders who may appear in simple groups).
Parameters Varied in the Runs of the Simulation Reported Here.

Note: S is the percent of fighters the smaller group will accept as casualties. β is the tax on the net return to the public goods game, while μ is the tax on beta.
Our current model is generically similar to some earlier models (e.g., Cederman Reference Cederman2002; Cegielski and Rogers Reference Cegielski and Rogers2016; Griffin and Stanish Reference Griffin and Stanish2007; Turchin and Gavrilets Reference Turchin and Gavrilets2009) that feature competition, warfare, tribute, or polity emergence, disappearance, secession, and unification. In general, we endogenize more aspects of our model (e.g., production, population growth, and many household-level ecosystem interactions) than do other models. These differences between previous models and our model are important for understanding how the extent that variability in wealth and power among households/groups of households (e.g., Wilkinson et al. Reference Wilkinson, Christiansen, Magnus Widell and Altweel2007) and successful maintenance of existing polities depends on the control of the best land for maize cultivation. The modest correlation of community center size with local maize productivity suggests that the processes of polity growth are initiated, and then best maintained, by sites enjoying access to superior maize production.
Simulation Results
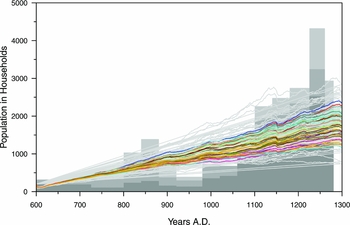
Each of the 36 unique parameter combinations (Supplemental Table 4) was run 15 times, creating 540 total runs. Figure 4 reports the population trajectories of agents in each of these runs and for each of the parameter combinations. Runs with low fatalities to warfare (s), low taxation (β), and low pass-through tribute (μ) (that is, high amounts of the tax from subordinate groups retained within each group as tribute moves up the chain) generate the highest populations, which are most similar to those in the empirical record (Figure 4, gray bars). We think that the main sources for the differences between the simulated populations and the empirical population estimates are the lack of immigration and emigration in the model, and the fact that we do not model low-frequency climate change, which influenced productivity in our region to an unknown extent; these issues are discussed at length in Kohler and Varien (Reference Kohler and Varien2012). The runs with the highest populations are run 1 (blue line), run 2 (red line), and run 3 (blue-gray line). The higher s-value and higher taxation values generate the lowest populations (e.g., run 18 with s =.05, β and μ =.9). Different thresholds for maximum simple group size do not markedly affect total population size; both the smallest and largest total populations were produced when group-size threshold for fission was set to 50.
Central tendencies for simulated human population through time for each of 36 parameter combinations (in color), with each of the 540 unique runs plotted in gray over blocky histograms representing the empirical population estimates for the simulation area (from Varien et al. Reference Varien, Ortman, Kohler, Glowacki and Johnson2007). Schwindt et al. (Reference Schwindt, Bocinsky, Ortman, Glowacki, Varien and Kohler2016) created newer population estimates, but for a larger region, so the older population estimates are retained here.

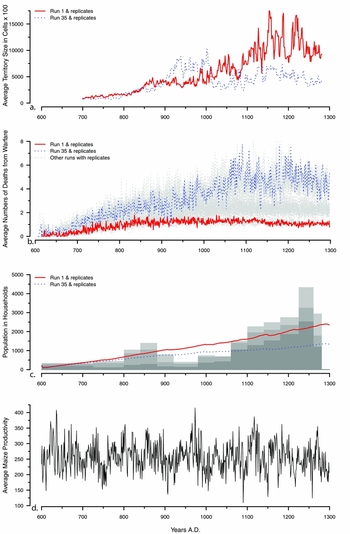
To further illustrate the global dynamics, we graph results in Figure 5 for two contrasting parameter sets: Run 1 and replicates (maximum simple group size = 50; s = 0.02, β = 0.1, μ = 0.1), and Run 35 and replicates (group size = 100; s = 0.05, β = 0.9, μ = 0.5). Initially, Run 35 generates larger average group territories (Figure 5a), perhaps because its higher taxation rates fuel expansion, but eventually its higher fatality rates from warfare (and perhaps, too, the toll of higher taxation; Figure 5b) suppress both population (Figure 5c) and average group territory size (Figure 5a). In both parameter sets, warfare is relatively rare in the first two centuries (Figure 5b), since groups have room to grow without confronting others. Under Run 1 parameters, warfare (and its fatalities) more or less stabilize in the ninth century, whereas under Run 35 parameters, warfare and fatalities increase through the A.D. 1000s, after which they vary around fairly high values. Periods of poor production (e.g., ~ A.D. 900, A.D. 1000, and in the mid-A.D. 1100s) tend to decrease deaths from warfare in both parameter sets, presumably because groups are not growing and therefore come into competition less frequently. Somewhat counterintuitively, periods of poor production that are relatively short (Figure 5d) also tend to increase territory sizes (or set the stage for its increase immediately upon recovery). This appears to be the joint result of revolts being less common or less likely to be successful, and mergers being more common. In short, changes in productivity can destabilize polities for several different reasons, especially given that productivity changes may not be completely simultaneous or of the same magnitude in nearby locations.
Tracking four distributions through time allowing for comparison of how productivity (d) influences population (c), warfare (b), and size of territories (a). (a) Average territory sizes through time for the largest groups of which each simple group is a member, for Run 1 and replicates and Run 35 and replicates; (b) annual deaths from warfare, gray lines indicate means for all runs with replicates, Run 1 and replicates and Run 35 and replicates are shown in black; (c) average number of households through time for Run 1 and replicates and Run 35 and replicates shown over blocky histograms representing the empirical population estimate for the simulation area; (d) average annual potential maize productivity for the simulation area.

To illustrate how revolt affects the composition of groups, we display the (aspatial) composition of the complex groups present in four periods in Run 1 (Supplemental Figure 5). Between A.D. 1020 and A.D. 1060, for example, the remnants of a revolt can be seen in the polity that is led by group 79. At the tail of this complex group, group 224 is subordinate to group 74. In A.D. 1020, group 74 is subordinate to group 248, yet group 74 revolts multiple times, each time then becoming subordinate to different dominants.
Since the dynamics of complex groups depend on total agent population, the next set of analyses concentrates on Run 1 and its replicates, which best fit the empirical populations. We calculated the territory size for each group at its highest organizational level at the last year in each of the 14 periods used to calculate empirical populations. That would be the simple group size for groups not subsumed in a complex group, otherwise we summed the territory sizes of each of the simple groups within each complex group. With the tools used for the kiva and settlement sizes we can then determine whether group territories through time correspond more closely to power law or log-normal distributions. This is especially valuable because we understand the nature of the processes driving complex group size in the simulation, which includes an important role for dynamics of the “biggest-get-bigger” sort (Supplemental Figures 6 and 7).
Simulated territory sizes are log-normally distributed until the A.D. 980–1020 period (Table 4). At that point, they begin to correspond to a power law distribution, with some variability at the test-statistic level until strongly returning to a log-normal distribution in the final A.D. 1260–1280 period. This is precisely what we would expect if the power law distributions are generated by the advantages in competition that larger groups come to have in the context of relative scarcity of agricultural land as populations grow.
Summary of Conformity of Simulation Territory Size Distributions to Power Law Expectations, Evaluated in the Last Year of Each of the Empirically Derived Periods.

Discussion
We proposed that log-normal distributions may result from many different processes whose effects are roughly proportional to the size of entities in the previous time step. For log-normal distributions, there is no signal that size itself is disproportionately advantaging further growth. Distributions corresponding to power laws, on the other hand, typically result from processes in which the largest entities in the previous time step are the most likely to grow even larger, as we might expect when power disparities or other advantages to size exist.
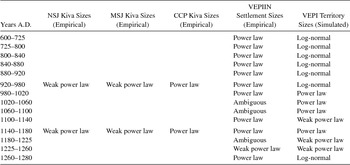
In Table 5, we summarize the outcomes of the analyses from Tables 1–3 by classifying these as corresponding to a power law, corresponding weakly to a power law, corresponding to a log-normal distribution, or, finally, of ambiguous status. To be characterized as corresponding to a power law, a distribution must exhibit a power law statistic of greater than 0.2, a compare-distribution statistic of greater than 0.6, and a test statistic of greater than 0.5. If a distribution is characterized as weakly corresponding to a power law, its power law statistic is above 0.1, its compare-distribution statistic is between 0.4 and 0.6, and the test statistic is between 0 and -0.1. For a distribution to be characterized as log-normal, it must have a power law statistic below 0.2, a compare-distribution statistic of 0.4 or less, and a test statistic less than -0.5. Distributions classified as ambiguous may have a weak power law statistic, with the other statistics indicating a power law, or a strong power law statistic, while the other statistics strongly indicate log-normality.
Summary of Analysis Results for Empirical and Simulated Distributions.

In our view, the general convergence of empirical distributions of kiva and settlement sizes on power laws during PII times strongly suggests a consolidation of power into one or more multi-village hierarchies. The fact that the territory size distributions generated by the simulation are similar further suggests that the processes we model—in which larger settlements and larger groups are advantaged by receiving flows of tribute, and by their ability to prevail in conflicts and subsume smaller groups—were also active in the prehispanic social settings of interest. The power law signal in all three data streams is substantially weaker during the PIII period, which we take to suggest less highly structured organizations, with more power devolving to local centers. These themes are explored more below.
Pueblo II Consolidation of Power
The primacy of Casa Rinconada in our studies, as well as the results of distributional analyses pointing unambiguously to power law structure for the Chaco core and periphery, support the (non-controversial) notion of the CCP, and Chaco Canyon in particular, as a central place for ritual for the greater Southwest in the PII period. If our scaling logic is approximately correct, Casa Rinconada could have accommodated one or two representatives of each great kiva community in the far-flung population of outliers.
When we look to settlement sizes in the VEPIIN study area (resolved at a finer temporal scale than the Pecos periods to which the kivas are assigned), we see evidence of both power laws and ambiguous probabilities. One of the ambiguous periods, from A.D. 1060–1100, is precisely at the point when the Chaco great house pattern is first superimposed on the central Mesa Verde (Lipe 2006). Our settlement data suggest that Chacoan influences, whatever their nature, had not completed their structuring work in the central Mesa Verde (VEPIIN) region until the A.D. 1100–1140 period and continued to prevail through A.D. 1180, even if new great houses were not being built.
After producing log-normal territory distributions for the period A.D. 600–980, simulated territory size distributions turn solidly toward power laws for A.D. 980–1100, after which they alternately exhibit power laws or weak power laws until A.D. 1260. Figure 5a illustrates a slow increase in the average territory size of groups—for Run 1 and replicates, at least—through the A.D. 1000s and A.D. 1100s, until almost A.D. 1200. Since simple group size in these runs is capped at 50, this growth is through the process of chaining ever more simple groups into ever fewer large complex groups. This process is ultimately driven by generally high productivity during these times fueling population growth, expansion of complex groups through addition to their territories via warfare and merging, and successful resistance of revolt.
Although the processes in the simulation are complex, they are understandable, and the key to the appearance of power law distributions in their territory sizes is that (all other things being equal) large groups have an advantage over small because they can conquer or subsume them. Growth happens for those groups that are already large, within limits set by the productivity of dry-farming maize (explicit and endogenous in the simulation) and transport costs for people and materials (partially represented in the simulation). Within complex groups, simple groups pay tribute to their dominant groups, with tribute passing through to the highest dominant group in the hierarchy.
Analogies between the processes in the simulation and those in the archaeological record should be sought at a fairly high level of generality. In the real world, a growing polity might not have to come to blows with each of its neighbors, or threaten to do so, to expand its influence and power. Flows of tribute in maize in the simulation might, in the reference societies, materialize as contributions to centralized feasts. Mounting evidence shows that Chacoan great houses hosted feasting events that brought visitors carrying food and ceramics from elsewhere (Cameron Reference Cameron2009; Harris Reference Harris2014; Windes Reference Windes1987). Often potluck in nature, such feasts could be seen as a type of tribute to the ritual power of central places. Mahoney and Kantner (Reference Mahoney, Kantner, Kantner and Mahoney2000:10) explicitly argue for tribute flow within the Chacoan system. Such “doings” (Fowles Reference Fowles2013) reinforced the hierarchies materialized in the fabric of great houses and great kivas, much as “memory of [their] social construction probably provide[d] one of the most important elements of personal identity to groups” (Earle Reference Earle2001:27).
It has long been understood, too, that the construction of Chaco's great houses would have required flows of labor from outside the canyon; that a highly significant proportion of the ceramic vessels and lithic raw materials used at Chaco came from the Chuska area (Cameron Reference Cameron and Mathien1997; Toll Reference Toll, Crown and Judge1991); that those great houses were built mostly from non-local timbers (Reynolds et al. Reference Reynolds, Betancourt, Quade, Patchett, Dean and Stein2005); and that, in fact, much maize probably did flow into Chaco Canyon from its periphery (e.g., Benson Reference Benson2010). Of course, what appears as a strictly political process in the simulation would likely be of inextricably mixed social, ceremonial, and political valence in this society (Earle Reference Earle2001:27; Fowles Reference Fowles2013; Heitman Reference Heitman, Heitman and Plog2015). In Pueblo society, ritual and ceremony provided both a rationale for the wielding of power and an important means for wielding that power.
Pueblo III Reorganization and Depopulation
The characterization of group sizes in kivas does not change markedly between the PII and PIII periods, except for the disappearance of the mid-sized court kiva in the CCP (they were never common in the other two areas), though the largest kivas decrease in size and number and the sample size of all kivas decreases everywhere, but particularly in the CCP (Supplemental Table 1). During PII times in the Chaco core/periphery, the largest kiva, Casa Rinconada, might accommodate some 130 people, while during PIII, the largest kiva, the Chacra great kiva, likely accommodated 70-some participants. Aside from Chacra, CCP PIII kivas are quite small, with modes around 12 and 25 people. Both the decrease in kiva number and size support the dissolution of Chaco as the preeminent center.
In the NSJ, while great kivas continue to be used throughout PIII, the increase in smaller kivas (Figure 2b) may suggest a reorganization of ritual. This, coupled with the increase of plazas and multi-walled structures as central places, may indicate a switch from global (Chacoan) ritual to more local ritual serving single communities or relatively small groups of communities. Our settlement data suggests, however, that this restructuring took place mostly after A.D. 1180. Perhaps the hierarchy that persists after that date is less pan-regional or regional and more local in nature: multiple competing groups rather than one large and connected complex. The proliferation of towers among the VEPIIN settlements after A.D. 1140 and of multi-walled structures after A.D. 1225 may suggest development of leaders extracting tribute at fairly local levels to build these walls and towers (of course, their construction could have been the tribute). In support of this idea, the complex groups in the simulation react to the generally low productivity in the thirteenth century with decreases in size (Figure 5a).
During the final two decades of occupation, the settlement size distribution again becomes a power law after 80 years of somewhat ambiguous structure. Perhaps this should be regarded as revealing a structural backbone that remained after the departure of those not in settlements organized in terms of the hierarchy that the last-to-leave settlements represented.
Our results show that interpretations of Ancestral Pueblo people as being egalitarian or hierarchical depends on when we look, and also on where we look. If we define our scale of inquiry to encompass all kivas, and not just (say) household kivas, coincident with the rise of Chaco we see increasing numbers of large kivas capable of enticing many individuals into integrative rituals. The largest great kiva, Casa Rinconada at Chaco Canyon, of a type completely different from the household kivas, stood at the apex of a polity with Chaco at its core. Similarly, the largest settlements in the PII period attracted people from smaller settlements through the processes required by staple finance (Earle Reference Earle2001) organized by ritual practice, but—we suggest—ultimately backed by threat of force.
The simulation takes the puzzling archaeological record for Chaco and the system it organized and exposes candidate mechanisms for producing this structure. Individual households interact with their local landscapes and with other local households, forming groups that cooperate more or less successfully through public goods games and protect their territories as best they can; those that are fortunate enough to land on the most productive soils reproduce the best. Particular lineages perpetuate themselves and, as they grow, may gain additional power by encompassing other such groups in large polities. The settlement-size scaling locates settlements within their regional and temporal context; kiva scaling examines how households and communities may have interacted in a ritual hierarchy; and the version of the Village simulation exercised here demonstrates how the emergence of local leadership facilitating cooperation for defense of arable land and producing other public goods, and structured tribute flow from subordinate to paramount groups, can stimulate and perpetuate hierarchical relationships resembling those reconstructed for the Chaco system.
One main reason that the archaeological record of Chaco is puzzling—clearly recognized by Earle (Reference Earle2001)—is that Chaco looks like a staple financed organization, but the usual conditions for staple finance include a highly concentrated productive environment surrounded by unproductive areas, such as an irrigated river valley in a desert, causing circumscription. In such systems, the costs of forcing households to contribute to a polity are very low, given their extremely limited outside options. The more extensive dry-farming that dominated maize production in the “dry-farming millennium” from A.D. 300–1300 (Kohler Reference Kohler1993:273) is not so obviously conducive to controlling households and their communities.
But the places where dry farming could be successful on the Colorado Plateau in the years represented by the Chaco system were in fact rather limited (Bocinsky et al. Reference Bocinsky, Rush, Kintigh and Kohler2016:Figure 6D–F). More importantly, those areas were full—or at least that is a plausible inference based on the Southwest-wide sensitivity of life expectancies and birth rates to climatic fluctuations beginning around A.D. 1000 (Kohler and Reese Reference Kohler and Reese2014). Earlier, a less-packed maize-growing niche allowed households to escape climate-driven downturns in maize production through mobility, largely shielding their demographic rates from this variability. Populations, through growth, circumscribed themselves, and it remained only for a polity to point this out, guaranteeing in the process that member groups need fear nothing from their neighbors in return for supporting the polity. This, however, is a fragile basis for coercion, as it depends on both the credibility of a ritual system claiming to underwrite production and the center's ability to support threatened member groups through manipulation of a complex set of debts, allegiances, force, and threats of force. It is perhaps more marvelous that it was able to endure for four-to-five generations, from about A.D. 1030–1140 in its fullest expression, than that it didn't last longer.
Conclusions
For some time, southwestern archaeologists have been aware that hierarchies of site size, great house size, and kiva size are visible for significant spans of time in significant portions of the Pueblo world. We likewise understand that these must imply some hierarchical organization of practices connected with these structures. More recently, we have learned that variability in community center size (in the central Mesa Verde region at least) is only weakly connected with the potential maize productivity of their catchments, inviting other, complementary explanations for this variability.
What we add here is, first of all, some tools drawn from the analysis of complex adaptive systems that allow size distributions to be characterized in ways that suggest their generating processes. We acknowledge that these tools do not, for our data, always render clear and concise verdicts, but they have provided useful hints as to the directions in which we should look for the generating processes.
Second, we have briefly described and exercised a model that implements a set of processes widely considered to be universal such as population growth, competition, and polity growth through conflict or threat of conflict generating flows of tribute of various sorts to dominant groups (e.g., Johnson and Earle Reference Johnson and Earle2000). This model demonstrates one pathway by which size can generate further growth, within limits ultimately imposed by production, transportation, and communication technologies.
Although we coded it to help us understand how polities might grow, the simulation also provides several potential insights into the perennial problem of why poor production might imperil polities. At the basal level, simple groups shrinking in size might flip from hierarchical to non-hierarchical (Kohler et al. Reference Kohler, Crabtree, Bocinsky, Hooper, Sabloff, Sabloff, Krakauer, Flack, West, Bettencourt and Lobo2016). This, in turn, might reduce (and perhaps destroy) their returns to the public goods game, decreasing or eliminating the flow of tribute upward in the social hierarchy. Intermediate groups who had been profiting from tribute might shrink too and, perhaps, flip in structure. As these processes worked their way up the chain, we can predict that successful revolts would become more common than new acquisitions to complex groups, and even absent successful revolt, complex groups could essentially crumble from below. Moreover, smaller remaining polities would be more vulnerable to attack, given fewer subordinate groups. The potential generality of such processes is illustrated by their similarity to the scenario envisaged for the late Bronze Age Argolid collapse by Maran (Reference Maran2009:255–256).
Our results reinforce the likelihood that one or more organizations (called polities here for convenience) existed in PII times and connected village-level communities into regional and (likely) pan-regional networks linked via flows of goods and labor. These results unsurprisingly point to Chaco Canyon as the place of pre-eminence and indirectly reinforce the notion that the decline of its hegemony was connected to conditions for maize farming that were likely markedly poorer in the San Juan Basin in the mid-A.D. 1100s than in the northern San Juan, where regional systems endured into the PIII period, by which time they would have been influenced by Chaco's remembered example but not controlled by its leaders.
Our analyses also suggest a central role for great kivas (particularly during the PII period) as mechanisms to help reinforce hierarchy. As not every Pueblo person could be accommodated for great kiva events, only those so empowered by their groups would attend. Such restricted access—with concomitant benefits for accumulating restricted knowledge—would have helped maintain the local and global hierarchies much as, among contemporary Pueblos, hierarchy is evident in differences between the “ceremonially rich” and the “ceremonially poor” (Ware Reference Ware2014:41). It appears that representatives of all existing great houses in Chaco Canyon and in outlier communities with great kivas could have been (and we suggest were) accommodated in the largest of them all, at Casa Rinconada.
Acknowledgments
This paper uses extensions to the Village ABM, originally developed with support from the National Science Foundation (BCS-0119981, DEB-0816400), which also generated and organized the empirical data on site sizes we use here. We thank the Templeton Foundation for funding part of this research. Our numerous colleagues in the Village Ecodynamics Project, as always, have provided much assistance and inspiration. Aaron Clauset, Colin Wren, Matt Grove, Marcus Hamilton, Paul Reed, Ruth Van Dyke, and Tom Windes also provided useful advice. Crabtree acknowledges support by NSF Graduate Research Fellowship DGE-080667, an NSF GROW fellowship, and a Chateaubriand Fellowship. The Spanish abstract was provided by Fernando Villanea and edited by Antonio Rodríguez-Hidalgo. This paper is dedicated to the memory of Robert P. Powers, not just a fine friend but also, among many other achievements, the researcher providing the first useful estimates for Chaco Great House sizes across a broad portion of the Pueblo area.
Data Availability Statement
The version of the Village code reported here is archived and under active development on GitHub: https://github.com/crowcanyon/vep_sim_beyondhooperville
Supplemental Materials
Supplemental materials are linked to the online version of the paper, accessible via the SAA member login at https://doi.org/10.1017/aaq.2016.18:
Supplemental Text 1. This text provides background information on the simulation, as well as additional information on how we detected outliers in our data.
Supplemental Figure 1. BMIII-PI momentary households by number of settlements in VEPIIN study area.
Supplemental Figure 2. PII-PIII momentary households by number of settlements in VEPIIN study area.
Supplemental Figure 3. Power law analysis of BMIII to PI momentary households in the VEPIIN study area.
Supplemental Figure 4. Power law analysis of PII to PIII momentary households in the VEPIIN study area.
Supplemental Figure 5. Graphs through time of hierarchical relationships within complex groups (Run 1).
Supplemental Figure 6. Power law analysis of BMIII to PI simulated group territory sizes.
Supplemental Figure 7. Power law analysis of PII to PIII simulated group territory sizes.
Supplemental Figure 8. The growth of a polity through time with an attempted revolt.
Supplemental Table 1. Kiva sample sizes in each subregion by period.
Supplemental Table 2. Simulation parameters by run number.
Supplemental Table 3. Power law probability values for distributions after removing outliers above 1.5 midspreads above the upper bound.