Management Implications
Oplismenus undulatifolius (wavyleaf basketgrass) is an invasive grass species that has spread rapidly in Maryland and Virginia since its discovery near Baltimore in 1996. We tested the efficacy of both physical and chemical treatment methods in three different experiments to investigate treatment efficacy and non-target impacts on native plant richness.
We found that hand weeding, clethodim (a grass-specific herbicide), and glyphosate were all effective at reducing O. undulatifolius cover, density, biomass, and flowering stems compared with untreated controls. Glyphosate likely provides the cheapest option, as it is currently less expensive than clethodim and because chemical removal requires less human effort than hand weeding. However, we found that a single application of glyphosate initially decreased total and native richness. Despite this initial decrease, both richness measures increased over time and did not differ from the other treatments by the end of the experiment. Hand weeding provides a chemical-free option and, because O. undulatifolius is relatively easy to pull, it is likely the best option for small populations. However, a 1-m2 plot required at least 30 min of weeding (0.0002 ha h−1), suggesting its limited effectiveness with large populations. We believe that clethodim provides the best option for controlling large populations despite its higher price because it required less human effort than hand weeding, did not result in a decrease in richness after treatment, and consistently reduced the density of O. undulatifolius more than our other removal methods by the end of our third experiment. However, the variation in the effectiveness of clethodim between our two experiments should be further explored, as it may be the result of treatment application timing or physiological differences between O. undulatifolius populations at different sites. Finally, our treatments did not eliminate all O. undulatifolius stems for most of our plots, but the vast majority of plots that did achieve eradication were treated with clethodim.
Introduction
With the introduction of a new invasive plant species, it is essential to determine a management strategy during the early stages of spread. It is widely accepted that the most effective management strategy is early detection and eradication (Genovesi Reference Genovesi, Veitch, Clout and Towns2011; Leung et al. Reference Leung, Lodge, Finnoff, Shogren, Lewis and Lamberti2002; Lodge et al. Reference Lodge, Williams, MacIsaac, Hayes, Leung, Reichard, Mack, Moyle, Smith, Andow, Carlton and McMichael2006; Panzacchi et al. Reference Panzacchi, Cocchi, Genovesi and Bertolino2007; Pluess et al. Reference Pluess, Cannon, Jarošík, Pergl, Pyšek and Bacher2012), which is also more cost-effective than long-term management (Panzacchi et al. Reference Panzacchi, Cocchi, Genovesi and Bertolino2007). For example, thorough testing of removal strategies combined with adaptive management resulted in widespread eradication of the southern sandbur plant (Cenchrus echinatus L.) on Laysan Island (Flint and Rehkemper Reference Flint, Rehkemper, Veitch and Clout2002). Unfortunately, while eradication is possible, it is not often feasible once a species has become widely established and self-sustaining (Pluess et al. Reference Pluess, Cannon, Jarošík, Pergl, Pyšek and Bacher2012). Managers are then left to decide whether long-term management is worth the cost, both economically and ecologically.
A wealth of evidence shows that management can suppress invasive plants while restoring native plant diversity and abundance (Alvarez and Cushman Reference Alvarez and Cushman2002; Bonello and Judd Reference Bonello and Judd2020; Carlson and Gorchov Reference Carlson and Gorchov2004; D’Antonio et al. Reference D’Antonio, Hughes, Mack, Hitchcock and Vitousek1998; Flory Reference Flory2010; Flory and Clay Reference Flory and Clay2009; McCarthy Reference McCarthy, Luken and Thieret1997). For example, 87% of invasive plant control studies in U.S. National Parks documented successful control (Abella Reference Abella2014). In addition, native plant populations have been shown to increase in response to control in more than half of reviewed studies (Abella Reference Abella2014; Prior et al. Reference Prior, Adams, Klepzig and Hulcr2018). Prior et al. (Reference Prior, Adams, Klepzig and Hulcr2018) also found that recovery rates were much higher in communities with low disturbance levels. Finally, many of these studies have shown that eradication may not be necessary for ecosystem recovery, as suppression of the invasive species alone can also lead to restoration success (Aulakh et al. Reference Aulakh, Enloe, Loewenstein, Price, Wehtje and Miller2014; Kettenring and Adams Reference Kettenring and Adams2011; Prior et al. Reference Prior, Adams, Klepzig and Hulcr2018; Reid et al. Reference Reid, Morin, Downey, French and Virtue2009).
Despite the potential for invasive plant control and native community restoration, several factors can lead to unsuccessful outcomes. Invasive removal strategies that are not thoroughly tested can prove ineffective (Abella Reference Abella2014; Ray et al. Reference Ray, Sherman, Godinho, Hanson and Parker2018; Tu Reference Tu2000). Control strategies can even exacerbate the invasion if the invader has high compensatory growth at low densities, leading to higher reproductive output (Ruiz-Navarro et al. Reference Ruiz-Navarro, Verdiell-Cubedo, Torralva and Oliva-Paterna2013). Widespread removal is also largely unfeasible for established populations that can easily reestablish without sufficient monitoring (Pluess et al. Reference Pluess, Cannon, Jarošík, Pergl, Pyšek and Bacher2012; Quirion et al. Reference Quirion, Simek, Dávalos and Blossey2018; Rejmánek and Pitcairn Reference Rejmánek, Pitcairn, Veitch and Clout2002). In addition, land managers are usually trying to suppress several invasive plants at a single site, causing them to prioritize removal on high-impact species only, which may allow secondary invaders to establish (Blackburn et al. Reference Blackburn, Essl, Evans, Hulme, Jeschke, Kühn, Kumschick, Marková, Mrugała, Nentwig, Pergl, Pyšek, Rabitsch, Ricciardi and Richardson2014; Bonello and Judd Reference Bonello and Judd2020; Kettenring and Adams Reference Kettenring and Adams2011; Zavaleta et al. Reference Zavaleta, Hobbs and Mooney2001). Managers must also factor labor and product costs into their management plans. Physical removal strategies, for example, are labor-intensive, expensive due to high labor costs, and can disturb the soil (Flory Reference Flory2010; Tu Reference Tu2000). Some stakeholders may even opt to not manage an invader at all if management proves to be ineffective and too costly (Simberloff et al. Reference Simberloff, Martin, Genovesi, Maris, Wardle, Aronson, Courchamp, Galil, García-Berthou, Pascal, Pyšek, Sousa, Tabacchi and Vilà2013). Therefore, it is vital to determine the effectiveness of removal strategies as well as their advantages and disadvantages before attempting widespread removal (Hager and McCoy Reference Hager and McCoy1998).
Even if an invasive control method proves effective, it may not result in native plant recovery. It is sometimes assumed that widespread exotics are exerting negative effects and that communities can passively recover with removal alone (Jäger and Kowarik Reference Jäger and Kowarik2010; Skurski et al. Reference Skurski, Maxwell and Rew2013). However, invasive species can cause irreversible damage to ecosystems prior to removal attempts and can create legacy effects that may prevent restoration (Corbin and D’Antonio Reference Corbin and D’Antonio2012; Vilà et al. Reference Vilà, Espinar, Hejda, Hulme, Jarošík, Maron, Pergl, Schaffner, Sun and Pyšek2011; Zavaleta et al. Reference Zavaleta, Hobbs and Mooney2001). Even if the invasive species does not actually suppress native plant communities, the removal of invasives may not lead to any gains in native plant abundance (MacDougall and Turkington Reference MacDougall and Turkington2005; Parker et al. Reference Parker, Simberloff, Lonsdale, Goodell, Wonham, Kareiva, Williamson, Von Holle, Moyle, Byers and Goldwasser1999), and extensive deer herbivory or exhausted seedbanks may prevent recovery for decades (Horsley et al. Reference Horsley, Stout and DeCalesta2003; Prior et al. Reference Prior, Adams, Klepzig and Hulcr2018; Rooney and Waller Reference Rooney and Waller2003). These explanations may explain the highly variable native responses to invasive control found in the literature (Abella Reference Abella2014; Kettenring and Adams Reference Kettenring and Adams2011; Prior et al. Reference Prior, Adams, Klepzig and Hulcr2018). If ecosystems cannot recover passively after invasive control, ecosystem management of other disturbances or seeding of native species may be required for restoration (Prior et al. Reference Prior, Adams, Klepzig and Hulcr2018; Reid et al. Reference Reid, Morin, Downey, French and Virtue2009; Zavaleta et al. Reference Zavaleta, Hobbs and Mooney2001).
Treatment methods themselves can also cause direct negative effects on native species, highlighting an important component of management decisions. Chemical removal methods have been shown to drive down native species richness and cover immediately after control, and this decline may last several years (Harmoney et al. Reference Harmoney, Stahlman and Hickman2007; Louda et al. Reference Louda, Rand, Arnett, McClay, Shea and McEachern2005; Ray et al. Reference Ray, Sherman, Godinho, Hanson and Parker2018; Rinella et al. Reference Rinella, Maxwell, Fay, Weaver and Sheley2009; Skurski et al. Reference Skurski, Maxwell and Rew2013). We know little regarding what factors drive the high variability in native plant responses, yet many studies continue to quantify management effectiveness without investigating the native response (Abella Reference Abella2014; Kettenring and Adams Reference Kettenring and Adams2011). The removal of invasive plants, therefore, may not adequately attend to one of the primary management goals for many agencies—increasing the abundance of native species (Abella Reference Abella2014; Hulme Reference Hulme2006; Skurski et al. Reference Skurski, Maxwell and Rew2013; Zavaleta et al. Reference Zavaleta, Hobbs and Mooney2001). Whether invasive removal strategies will have these negative effects must be determined before widespread management efforts, and invasive species with reversible impacts should be prioritized for eradication (Parker et al. Reference Parker, Simberloff, Lonsdale, Goodell, Wonham, Kareiva, Williamson, Von Holle, Moyle, Byers and Goldwasser1999).
The temporal patterns of both community responses and their monitoring also present challenges for management. Several reviews on the topic have found that a majority of studies are occurring over a year or less or are simply not documenting the effects of treatment timing (Abella Reference Abella2014; Kettenring and Adams Reference Kettenring and Adams2011; Stricker et al. Reference Stricker, Hagan and Flory2015). There is strong evidence, however, that many control strategies require extensive follow-up (Aulakh et al. Reference Aulakh, Enloe, Loewenstein, Price, Wehtje and Miller2014; Beerling Reference Beerling1990) and that their effectiveness can vary significantly over time (Flory Reference Flory2010; Ray et al. Reference Ray, Sherman, Godinho, Hanson and Parker2018). Given these temporal effects, management efforts may need to be reprioritized over time to target the most problematic species (Flory and D’Antonio Reference Flory and D’Antonio2015). In light of these knowledge gaps, there is a great need to investigate removal strategies over more than one growing season (Flory Reference Flory2010; Stricker et al. Reference Stricker, Hagan and Flory2015).
The rapid spread of a relatively new invasive grass species in forests across the mid-Atlantic region of the United States has caused a growing concern regarding its potential effects. First reported at Patapsco Valley State Park near Baltimore, Maryland in 1996, wavyleaf basketgrass [Oplismenus undulatifolius (Ard.) P. Beauv.] has spread rapidly within Maryland and Virginia (Peterson et al. Reference Peterson, Terrell, Patterson, Uebel, Davis, Scholz and Soreng1999). By 2008, it had infested more than 607 hectares at Patapsco Valley State Park and has now been reported in 15 counties in Maryland as well as 11 counties in Virginia, the District of Columbia, and one county in Pennsylvania (EDDMapS 2019; Marose et al. Reference Marose, Kyde and Ritter2009). The spread of O. undulatifolius within the region has been more rapid than Japanese stiltgrass [Microstegium vimineum (Trin.) A. Camus], a well-researched plant invader of eastern deciduous forests (Duguay and Farfaras Reference Duguay and Farfaras2011; Flory and Clay Reference Flory and Clay2010; Marshall et al. Reference Marshall, Buckley and Franklin2009). Whereas M. vimineum took more than 38 yr to spread to 20 counties in the United States, it took O. undulatifolius fewer than 20 yr (EDDMapS 2019; GBIF 2019). Within its invaded range, O. undulatifolius largely occurs in closed canopy forests and therefore appears to be very shade tolerant (Beauchamp et al. Reference Beauchamp, Koontz, Suss, Hawkins, Kyde and Schnase2013). Little is known about the ecology of this species, but O. undulatifolius cover was found to be negatively correlated with species richness (Beauchamp et al. Reference Beauchamp, Koontz, Suss, Hawkins, Kyde and Schnase2013), and mechanical removal resulted in increased species richness (Tekiela and Barney Reference Tekiela and Barney2017). Further, the USDA’s weed risk assessment has classified this species as high risk in terms of establishment, spread, and impact potential, but this includes a high level of uncertainty (USDA 2012).
While thousands of dollars have been spent to curtail the spread of O. undulatifolius in the region, a lack of a cohesive management plan and funding has made controlling this species especially difficult (Wavyleaf Basketgrass Task Force 2009; Westbrooks and U.S. Geological Survey Reference Westbrooks2000). Several land managers have attempted to control this species using a variety of mechanical and chemical methods, and Maryland’s Department of Natural Resources currently recommends glyphosate or clethodim (a grass-specific herbicide) for dense populations and hand weeding for small populations. However, there are currently no peer-reviewed research articles that document the effectiveness of these different strategies.
Our primary objective for this study was to assess the efficacy of several herbicides and hand weeding for O. undulatifolius and follow these treatments through time. We also aimed to determine the effect that these removal strategies had on total species richness and native species richness, as the best removal strategy may not necessarily result in the most species-rich or ecologically intact community. Experiment 1 was a pilot study that tested a variety of herbicides and hand weeding at a single site over one growing season. Experiment 2 tested hand weeding and the more effective herbicides from Experiment 1 at different rates to determine whether lower concentrations of our chosen herbicides would still be effective. This experiment was carried out at two sites over two growing seasons and had a single removal application. Experiment 3 used the most sites (six) and the longest period of time (three growing seasons), this time testing a single rate of the same herbicides from Experiment 2, which were applied in all 3 yr rather than a single application to determine the necessity of repeated applications. We also investigated the number of O. undulatifolius flowering stems and the height of those stems after each treatment, as it is likely that O. undulatifolius disperses primarily by epizoochory (Beauchamp et al. Reference Beauchamp, Koontz, Suss, Hawkins, Kyde and Schnase2013). We hypothesized that these different removal treatments would vary in their ability to remove O. undulatifolius and in their effects on total and native species richness. Specifically, we predicted that glyphosate treatments would result in the lowest richness due to glyphosate’s broad-spectrum designation, and we predicted that hand weeding would result in the highest species richness due to its potential for a high degree of selectivity. Not only will these experiments provide evidence on how best to control this new invader, they will help determine the feasibility of restoration efforts focused on removing this species in the mid-Atlantic region. In other words, if communities can rebound with O. undulatifolius removal, land managers will be able to prioritize removal feasibility, calculate labor costs, and determine whether native seed additions or other measures may be needed in addition to removal.
Materials and Methods
Site Description
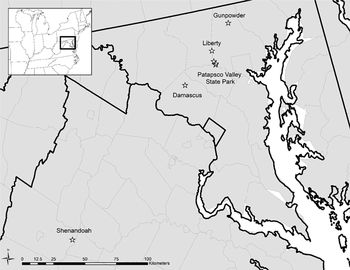
We used a total of seven sites for this study (Figure 1), with some sites being used more than once for different experiments. Where multiple studies were conducted at the same site, we placed them in different locations within the site to avoid introducing effects from previous treatments. Six of the seven sites were located in Maryland, and one site was located in Shenandoah National Park, VA (Shenandoah, 38.37°N, 78.57°W). In Maryland, we used three different sites within Patapsco Valley State Park: McKeldin (39.37°N, 76.88°W), Pipeline (39.35°N, 76.87°W), and Woodstock (39.34°N, 76.87°W). Other sites included Damascus Recreational Park (Damascus, 39.25°N, 77.21°W), Gunpowder Falls State Park (Gunpowder, 39.60°N, 76.670°W), and Liberty Reservoir (Liberty, 39.44°N, 76.670°W). We chose these sites because they contained enough O. undulatifolius cover to ensure that plots within a single site would have consistent cover between treatments and adequate spacing between plots. While all of these sites were similar in that they were dominated or codominated by tulip tree (Liriodendron tulipifera L.), they also differed with regard to their resident plant communities, with some having higher cover of other invasive species such as M. vimineum and Japanese barberry (Berberis thunbergii DC) and others having higher cover of native plants. These sites were also similar with regard to topography, with slope ranging from 3% to 13%. Other canopy codominants included American beech (Fagus grandifolia Ehrh.), sweet birch (Betula lenta L.), chestnut oak (Quercus montana Willd.), white pine (Pinus strobus L.), American sycamore (Platanus occidentalis L.), and red maple (Acer rubrum L.). Site history is relatively similar between our sites, as most forests are likely less than 80 yr old and were clearcut in the mid-20th century. These sites also varied in the length of time that O. undulatifolius has been present. The three sites in Patapsco Valley State Park and Liberty are between 0.5 and 4.0 km from the two initial invasion sites found in 1996 and had dense patches of O. undulatifolius by 2008 (Marose et al. Reference Marose, Kyde and Ritter2009). Land managers at Damascus began removing O. undulatifolius by 2009, and O. undulatifolius was first reported in 2014 at Gunpowder State Park. Oplismenus undulatifolius was first discovered in Shenandoah National Park in 2005, and the specific patches in our study were first recorded in 2017 (J Hughes, personal observation; AKMB and MHHS, unpublished data). Therefore, while we were somewhat limited in our site selection, we aimed to determine a control method that would work most effectively at the most sites.
Site locations in Maryland and Virginia. Patapsco Valley State Park contains three sites: McKeldin, Pipeline, and Woodstock.

Study Species
Oplismenus undulatifolius is a C3 perennial grass. Its native distribution is difficult to pinpoint due to taxonomic synonyms that exist (GBIF 2019), but the majority of presence records occur in eastern Asia (China, Japan, and South Korea), eastern Australia, and Papua New Guinea, with a smaller number of records from southwestern Europe, southern Africa, and western Asia (Chen and Phillips Reference Chen, Phillips, Wu, Raven and Hong2006; Davey and Clayton Reference Davey and Clayton1978; GBIF 2019). Stems grow to 20- to 50-cm tall with a densely hairy inflorescence and undulating ripples on the leaves (Barkworth Reference Barkworth, Barkworth, Capels, Long and Piep2010; Chen and Phillips Reference Chen, Phillips, Wu, Raven and Hong2006; Scholz Reference Scholz1981). This species is capable of short-distance dispersal via stolons (Scholz Reference Scholz1981), and long-distance dispersal presumably occurs through eipzoochory, whereby a sticky coating on the awns of each spikelet adheres to skin, hair, and clothing (Peterson et al. Reference Peterson, Terrell, Patterson, Uebel, Davis, Scholz and Soreng1999; Scholz Reference Scholz1981; VBB, unpublished data).
Experiment 1
In September 2008, we tested eight herbicides and hand weeding for their efficacy on O. undulatifolius at a single site (Pipeline) (Marose et al. Reference Marose, Kyde and Ritter2009). We set up three blocks with seventeen 3 by 6 m plots each using a randomized complete block design (17 treatments by 3 blocks for 51 plots total). In this and both following experiments, we used a block design. We used blocking as a statistically robust and time-efficient way to factor out stochastic spatial environmental variation to ensure a reasonably powerful experimental design without simply adding more replicates, given an upper limit on person-hours in the field. Herbicides that were tested included clethodim, fluazifop-P-butyl, fluazifop-P-butyl plus fenoxaprop, glyphosate, imazapic, quizalofop, sethoxydim, and sulfometuron methyl, applied at various rates (Table 1). Herbicides were applied with a flat-fan nozzle at 187 L ha−1 (20 gal acre−1) at a pressure of 138 kPa with a CO2 pressurized backpack sprayer. A crop oil concentrate (Helena Chemical, 225 Schilling Boulevard, Suite 300, Collierville, TN 38017) was added to each treatment at 1% v/v. All blocks had a near monoculture of O. undulatifolius before treatment. In addition to the herbicide treatments, we included a hand-weeded treatment and a non-weeded positive control for comparison.
Herbicides and their rates used for each experiment.

In November 2008 (between 7 and 8 wk following treatment), we evaluated all plots for the effectiveness of removing O. undulatifolius, using a standard visual scale of 0 to 10, with 0 indicating no effect of treatment and 10 indicating complete removal of O. undulatifolius (0% cover) (Derr 2008). This method of assessing effectiveness is a standard procedure within the Maryland DNR for weed control (K Kyde, personal communication).
Experiment 2
To build on the success of the more effective treatments from Experiment 1, we conducted an additional experiment to test these treatments at additional rates. We chose two sites (Pipeline and McKeldin), as they contained at least 30% cover of O. undulatifolius before treatment.
At each site, we set up three blocks that each contained nine 2 by 5 m plots (2 sites by 3 blocks by 9 treatments for 54 plots total). We positioned plots to exclude large trees, shrubs, woody debris, or other major obstructions with a 1- to 2-m buffer between plots for walking. If there were any large shrubs that would have impeded uniform application of herbicide, we cut them to ground level, and repeated this step within the control plots as well. In nearly all instances, these shrubs were isolated individuals of multiflora rose (Rosa multiflora Thunb.), wineberry (Rubus phoenicolasius Maxim.) and B. thunbergii. We recorded percent cover of all species, total species richness, and native species richness in these plots in mid-June 2014 in two 1-m2 subplots centered within each plot, which were averaged. The removed shrubs were included in the monitoring before treatment.
We randomly assigned and applied treatments to plots in mid-July 2014. Hand weeding included removing all O. undulatifolius stems as well as any other invasive species present. A Maryland State Department of Agriculture employee applied two herbicides, glyphosate and clethodim using a 2.13-m (7-ft) boom that was pressurized with a CO2 tank. We used TeeJet® 8003 flat-fan nozzles spaced 38.1 cm (15 in.) apart at 206.9 kPa, using a single pass at a constant rate of speed (Table 1). Glyphosate was applied at 0.32, 0.49, 0.63, and 1.26 kg ai ha−1, and clethodim was applied at 0.13, 0.17, and 0.20 kg ai ha−1. All herbicides were broadcast at a 243 L ha−1 (26 gal acre−1) carrier volume and were mixed with 0.1% v/v Alligare 90 surfactant (Alligare, 13 N. 8th Street, Opelika, AL 36801). A positive control treatment was unmanipulated. We then recorded O. undulatifolius percent cover and richness measures within each subplot again in mid-August and mid-October 2014, mid-June 2015, and mid-October 2015 (15 mo after treatment [MAT]), again averaging between the two subplots.
Experiment 3
In May 2017, we established six sites in Maryland and Virginia where O. undulatifolius abundance was known to be high (Damascus, Gunpowder, Liberty, McKeldin, Shenandoah, and Woodstock). At five of these sites, we placed fifty 1-m2 circular plots, 10 of which were placed in areas with no O. undulatifolius present as a negative control. It should be noted, however, that many of the plots in this negative control slowly became invaded with O. undulatifolius. We placed the remaining 40 plots in 10 blocks within dense (≥40% cover) O. undulatifolius and randomly assigned each plot to one of four treatments: hand weeding, glyphosate, clethodim, and a positive control with no manipulation. A Maryland State Department of Agriculture employee applied two herbicides, glyphosate and clethodim, using a Solo backpack sprayer and a TeeJet® 8004E even-fan nozzle at approximately 138 kPa pressure. Glyphosate was applied at 1.70 kg ha−1, and clethodim was applied at 0.20 kg ha−1, both at a 252 L ha−1 (27 gal acre−1) carrier volume. We mixed all herbicides with 0.2% Alligare 90 surfactant (Alligare). All treatments were applied in mid-June of 2017, 2018, and 2019. To allow more native species to recover, we replaced the glyphosate treatment with hand weeding in 2018 and 2019. At our sixth site (Shenandoah), there was not enough O. undulatifolius cover to warrant a block design, so we randomly assigned 25 plots with the treatments as above.
We monitored plots in April, June, July, and August of each year, ending in August 2019 (26 MAT). We assessed all plots for O. undulatifolius cover, O. undulatifolius density (number of stems in a 0.25-m2 quadrat placed in plot center), total species richness, and native species richness. We only measured O. undulatifolius density in June and August of each year due to the difficulty in determining whether stems were alive after treatment in July. We also counted the number of flowering O. undulatifolius stems and measured the tallest O. undulatifolius flowering stem in each plot in August each year. In August of 2019, we clipped the aboveground O. undulatifolius biomass at ground level, dried each bag for 72 h at 60 C, and weighed the bags.
Statistical Methods
For each experiment, we used linear mixed models to evaluate treatment, site, block, and time effects on O. undulatifolius responses (percent cover, density, biomass, and height of flowering stems) and observed total and native species richness. In Experiment 1, we included treatment as a fixed effect and block as a random effect. In Experiments 2 and 3, we evaluated several candidate models using Akaike information criterion (AIC) (Supplementary Tables S1–S6), with different predictors and interactions and using blocks within sites as random effects. Using information theoretic approaches such as AIC rather than hypothesis testing for model selection provides a more reliable means to weigh the relative strength of evidence among competing models (Burnham and Anderson Reference Burnham and Anderson2002; Stephens et al. Reference Stephens, Buskirk and del Rio2007). This approach lends itself to creating parsimonious models that can best predict future outcomes. Among information criteria, AIC with its version for small sample correction is generally regarded as striking the best balance between bias and precision. Among competing models, the model with the lowest AIC is considered the best model, while any within 2 AIC units are considered to have some support. Predictors included: treatment (includes different rates for glyphosate and clethodim in Experiment 2), method (clethodim, glyphosate, hand weeding, or control in Experiments 2 and 3), time (interaction of year and month), year, month, and site. Because our experimental design for Shenandoah in Experiment 3 was slightly different from all other sites, we analyzed these results individually using linear models (no random effects) and excluded site as a possible predictor. For linear and mixed models we used the nlme package (Pinheiro et al. Reference Pinheiro, Bates, DebRoy and Sarkar2019). For the predictors in our best models, we used post hoc Tukey honest significant difference (HSD) comparisons (P ≤ 0.05) with the lsmeans package (Russell Reference Russell2016). We did these and all following analyses in R (R Core Team 2018).
We used Bayesian logistic regression to test whether removal methods, sites, or their interaction affected the presence of flowering O. undulatifolius stems in Experiment 3. It was necessary to use presence/absence of flowering stems, because there were too many method combinations with zero counts, and even zero-inflated models were unable to converge. Using preliminary logistic regression models, we determined the best set of predictors using AIC model selection as described (which were method, site, and their interaction). Due to issues of separation where some sites had all presences or all absences, we then used a Bayesian approach to compare sites and methods. Our analysis assumed a binomial error distribution and used a logit link function. We assumed only weakly informative priors on all parameters (βi ~ N [0, 2.5]). The posterior distribution was sampled using the rstanarm package (Goodrich et al. Reference Goodrich, Gabry, Ali and Brilleman2019), and we used leave-one-out cross validation for model selection with the loo package (Vehtari et al. Reference Vehtari, Gabry, Magnusson, Yao and Gelman2019). Convergence of the four independent chains was verified with visual inspection of traces, auto- and cross-correlation plots, potential scale reduction factor
 ${\widehat R\, $
< 1.001. Effective sample sizes exceeded 3,500, and the posterior sample size was 4,000. We used the coda package to calculate the highest posterior density intervals (HPD intervals; Plummer et al. Reference Plummer, Best, Cowles and Vines2006). We then compared methods and sites using direct comparisons of the posterior probability distributions and assessed whether the 95% HPD intervals overlapped zero.
To obtain a more comprehensive view of the efficacy of hand weeding, clethodim, and glyphosate, we compared the results of Experiments 2 and 3 using variables of the percent change of O. undulatifolius percent cover and total species richness at different time points. To do this, we calculated the percent change for four time points: 1 MAT (O. undulatifolius percent cover only), 2 to 3 MAT, 11 to 12 MAT, and 14 to 15 MAT. We were unable to be completely consistent with the number of months following treatment between our two experiments, because we applied treatments for Experiment 2 in July and Experiment 3 in June. To be as consistent as possible between the methodologies used in these two experiments, we used only removal treatments that were similar between the two experiments (hand weeding, clethodim at 0.20 kg ha−1, and glyphosate at 1.26 or 1.70 kg ha−1). We used linear mixed models to test the following predictors: method, Experiment (2 or 3), and their interaction, using AIC model selection and post hoc comparisons previously described. By doing so, we aimed to determine whether our results were consistent between our two experiments and whether we obtained significantly different results between one or two removal applications at the 14 to 15 MAT point.
We transformed data for all statistical tests as necessary to meet the assumptions of normality and homogeneity of variances (Clark Reference Clark2007; Neter et al. Reference Neter, Kutner, Nachtsheim and Wasserman1996). In Experiment 1, analysis showed that model residuals were leptokurtic, that is, tightly clustered around treatment means, with skewed distributions above and below the means. We transformed the data to better meet the assumptions of our statistical models and reduce undue influence of outliers. We centered the data around the median and used the fourth-root while retaining the sign of the centered data. Using the fourth-root transformation is very similar to a log transformation but allows for values of zero. For Experiment 2, we used an arcsin transformation for O. undulatifolius percent cover and species richness, leaving native species richness untransformed. We log transformed O. undulatifolius percent cover, density, and biomass in Experiment 3 and transformed the height of O. undulatifolius flowering stems by squaring them. It was not necessary to transform our total and native species richness for Experiment 3.
Results and Discussion
Treatment Effectiveness
Oplismenus undulatifolius removal treatments for Experiment 1 varied widely in their effectiveness after 2 mo, with hand weeding and glyphosate being the most effective (Figure 2). Specifically, these two treatments reduced O. undulatifolius by an average of 90% to 97%. The least effective treatments were fluazifop plus fenoxaprop (0.21 kg ai ha−1 fluazifop + 0.06 kg ai ha−1 fenoxaprop), imazapic (both 0.09 and 0.18 kg ai ha−1), quizalofop (0.05 kg ai ha−1), and sulfometuron methyl (0.11 kg ai ha−1). This variation in treatment effectiveness corroborates the findings from others for similar invasive grass species (Enloe et al. Reference Enloe, Lucardi, Loewenstein and Lauer2018; Flory Reference Flory2010; Ray et al. Reference Ray, Sherman, Godinho, Hanson and Parker2018), further highlighting the need to test several treatments before widespread removal.
Experiment 1 treatment effectiveness on Oplismenus undulatifolius after 2 mo, with x-axis labels and shading indicating the method/herbicide used. Treatment numbers indicate the herbicide treatment rates used (kg ai ha−1) (Table 1). Bars are means ± SE. Actual values are shown, and letters indicate statistically significant differences after transformation of the data. P < 0.0001 for treatments.

For Experiments 2 and 3, the best model to explain O. undulatifolius percent cover included the method (clethodim, glyphosate, hand weeding, or control), time, and their interaction for both Experiments 2 and 3 (Figure 3; Supplementary Tables S1–S3). For Experiment 2, we did not find any differences between the rates used within each chemical method, so these were subsequently pooled. All three removal methods were effective at reducing O. undulatifolius cover at 1 MAT for both experiments. We found consistent effects between our two experiments at 1 MAT, except for the clethodim method, which was found to be more effective in Experiment 3 (Figure 4). Oplismenus undulatifolius cover remained at least 48% lower than the positive control at 2 to 3 MAT for all removal methods. The glyphosate and hand-weeded plots had consistently lower cover than clethodim plots at that time, averaging at least a 91% reduction compared with the control, while clethodim application reduced cover by at least 48%.
Oplismenus undulatifolius percent cover for Experiment 2 (A) and Experiment 3 (B) over time by method (Maryland sites only). Arrows indicate the time points when treatments were applied. (B) The positive control is excluded and graph starts after the first treatment to better show the difference between treated plots. Points are means ± SE, and letters indicate statistically significant differences within a time point after transformation of the data. P < 0.0001 for method, time, and their interaction (A and B). −C, negative control without O. undulatifolius at the start of the experiment; +C, positive control; CL, clethodim; GL, glyphosate (GL-HW for Experiment 3 is absorbed into GL in legend here); and HW, hand weeding.

Percent change in Oplismenus undulatifolius percent cover for four time points following treatment (MAT, months after treatment) at all sites. Note that at 14–15 MAT, plots in Experiment 2 had had one removal treatment application, whereas Experiment 3 had two. Bars are means ± SE. Asterisks indicate significant differences between the two experiments for each method. −C, negative control without O. undulatifolius at the start of the experiment; +C, positive control; CL, clethodim; GL, glyphosate (GL-HW for Experiment 3 is absorbed into GL in legend here); and HW, hand weeding. See Supplementary Table S5 for P-values for each predictor at each time point.

At 1 yr following treatment, we found a noted disparity between our two experiments, with clethodim-treated plots in Experiment 2 having high enough O. undulatifolius cover to not even differ from the positive control. However, in Experiment 3, cover in clethodim plots remained lower (by at least 72%) than the control but had higher cover than the glyphosate and hand-weeded plots (Figure 4). The mechanism behind the inconsistency in clethodim performance between experiments at 1 and 12 to 13 MAT is difficult to determine but could be the result of the timing of application (June vs. July), plot size, and the sites that were used. We found consistent effects of glyphosate and hand weeding between experiments at 14 to 15 MAT, despite Experiment 3 utilizing a hand-weeding approach in the glyphosate plots. Our results strongly suggest that a second and third application of clethodim can suppress new O. undulatifolius growth, as cover within the third year of Experiment 3 was lower than in our glyphosate-weeded and hand-weeded plots. However, cover was at least 97% lower than in the positive control for all treatment methods. Despite the effectiveness of our methods, we did not eliminate all O. undulatifolius stems in any plots in Experiment 2. In Experiment 3, we achieved 0% cover at the end of the experiment in 21% of our plots, of which more than 90% were treated with clethodim.
As with O. undulatifolius percent cover, the best predictors for O. undulatifolius density were method, time, and their interaction for all six sites in Experiment 3 (Figure 5; Supplementary Tables S2 and S3). At 2 mo following the first treatment, all methods had reduced density by at least 85%, with glyphosate and hand-weeded plots having the lowest density. At 1 yr after the first treatment, all treated plots had lower density than the control, with the glyphosate and hand-weeded plots having the lowest, and this pattern continued through this growing season. In the final growing season, clethodim-treated plots had lower densities than all other plot types for all sites, but all treated plots had at least 94% lower density than the control. However, we did not determine whether we would have achieved a similar result for three consecutive glyphosate treatments rather than a single application followed by hand weeding.
Oplismenus undulatifolius density (number of stems 0.25 m−2) over time (A) and O. undulatifolius biomass (g) by method and site (B) in Experiment 3 (Maryland sites only). (A) The positive control is excluded and graph starts after the first treatment to better show the difference between treated plots. Arrows indicate the time points when treatments were applied. Points are means ± SE, and letters indicate statistically significant differences within a time point after transformation of the data, and contrasts for B are shown within each treatment. −C, negative control without O. undulatifolius at the start of the experiment; +C, positive control; CL, clethodim; GL-HW, glyphosate with hand weeding in second and third year; and HW, hand weeding. P < 0.0001 for method, time, and their interaction (A). P < 0.0001 for method, site, and their interaction (B).

Removal method, the site, and their interaction were the best predictors for O. undulatifolius biomass at the end of Experiment 3 at the Maryland sites, with treated plots having at least 97% lower biomass than the control (Figure 5; Supplementary Table S2). The three control methods did not differ from one another for these sites and actually had lower biomass than the negative control that became invaded with O. undulatifolius. The McKeldin and Damascus sites tended to have higher biomass than the other sites for negative control plots, and McKeldin had higher biomass than the other sites for the clethodim treatment as well. For Shenandoah, method was a significant predictor, and all treated plots had at least 97% lower biomass than the control, with the clethodim and glyphosate–hand weeded plots having lower biomass than the hand-weeded plots.
The proportion of plots with flowering O. undulatifolius stems and the maximum height of those stems were both affected by method in Experiment 3 (Figure 6; Supplementary Table S4). All three removal methods were effective in reducing the number of plots with flowering stems for all sites, with nearly 90% of control plots and only 3% to 6% of removal plots having flowering stems. However, sites varied within each method, with the Gunpowder site having a higher proportion of plots with flowering stems than the majority of other Maryland sites for the clethodim and glyphosate–weeded treatments. For the height of the stems that were flowering, all removal methods reduced the height of existing stems by at least 32% on average compared with the control plots, with clethodim plots having the shortest stems. At Shenandoah, 93% of positive control plots and only one treated plot (HW) had flowering stems. We were not able to make pairwise comparisons between methods for height at this site due to the low replication of plots with flowering stems, but positive control plots averaged 50.95 cm (± 6.94 SD), while the single hand-weeded plot had a stem height of 28.20 cm. These three removal strategies, therefore, are very likely to reduce the number of new germinants within invaded areas as well as the number of seeds that are transported to new sites by epizoochory (Scholz Reference Scholz1981; Peterson et al. Reference Peterson, Terrell, Patterson, Uebel, Davis, Scholz and Soreng1999; V Beauchamp, unpublished data). In addition, the number of seeds that may be transported may be reduced if shorter flowering stems decrease the amount of contact with an animal such as a white-tailed deer (Odocoileus virginianus Zimm.).
Proportion of plots with flowering Oplismenus undulatifolius stems by site and method (A) and the maximum height of those stems in Experiment 3 (cm) (B) by method (Maryland sites only). Bars (B) are means ± SE, and letters indicate statistically significant differences after transformation of the data (contrasts for A are shown within each treatment). −C, negative control without O. undulatifolius at the start of the experiment; +C, positive control; CL, clethodim; GL-HW, glyphosate with hand weeding in second and third year; and HW is hand weeding. P < 0.0001 for method and site, and P = 0.0044 for their interaction (for A). P < 0.0001 for method (B).

Treatment Effects on Total and Native Species Richness
We found contrasting effects with regard to predictors for total and native species richness between our two experiments. For total richness, time and month alone were the best predictors in Experiment 2, while method, time, and their interaction were in the best model for Experiment 3 (Figure 7; Supplementary Tables S1 and S5). However, the best model that involved any O. undulatifolius removal in Experiment 2 also included method, time, and their interaction. Seasonal patterns therefore tended to overshadow effect of removal for Experiment 2, and total richness was highest in June 2015 for that experiment, nearly 1 yr after treatment, and lowest in October 2014, 3 MAT (results not shown). While we did not specifically measure compositional changes over time, we do note that several species that were present in June 2014 were absent the following October. However, the number of species that became absent in October made up a relatively small portion of the total number of species (<25%) for both years, indicating that most species that we observed were present during the entire sampling period. For native richness, the best predictors for Experiment 2 were treatment (including different rates of clethodim and glyphosate), time, and their interaction, whereas for Experiment 3 the best predictors were method, time, and their interaction (Figure 8; Supplementary Table S5).
Observed species richness over time in Experiment 2 (A) and Experiment 3 (Maryland sites only) (B). Arrows indicate the time points when treatments were applied. Points are means ± SE, and letters indicate statistically significant differences within a time point after transformation of the data. −C, negative control without Oplismenus undulatifolius at the start of the experiment; +C, positive control; CL, clethodim; GL, glyphosate (GL-HW for Experiment 3 is absorbed into GL in legend here); and HW, hand weeding. P < 0.0001 for method and time, and P = 0.0984 for their interaction (A). P < 0.0001 for method, time, and their interaction (B). Percent change in O. undulatifolius percent cover for four time points following treatment (MAT, months after treatment) at all sites. Note that at 14–15 MAT, plots in Experiment 2 had had one removal treatment application, whereas Experiment 3 had two.

Native species richness over time in Experiment 2 (A) and Experiment 3 (Maryland sites only) (B). Arrows indicate the time points when treatments were applied. Bars and points are means ± SE, and letters indicate statistically significant differences within a time point after transformation of the data. (A) The asterisk indicates a significant difference between years. −C, negative control without O. undulatifolius at the start of the experiment; +C, positive control; CL, clethodim; GL, glyphosate; GL-HW, glyphosate with hand weeding in second and third year; and HW, hand weeding. P < 0.0001 for method and time, and P = 0.34 for their interaction (A). P < 0.0001 for method, time, and their interaction (B).

Overall, species richness trends were consistent between the two experiments when examining the percent change from the initial richness surveys, despite the fact that our best models again included method, experiment, and their interaction (Figure 9; Supplementary Table S6). There was only one instance in which the two experiments differed from one another, and that was in the positive control after 2 to 3 mo. In this case, Experiment 2 experienced a stronger decrease in richness during the fall compared with Experiment 3.
Percent change in observed species richness for three time points following treatment (MAT, months after treatment) at all sites. Note that at 14–15 MAT, plots in Experiment 2 had had one removal treatment application, whereas Experiment 3 had had two. Bars are means ± SE. Asterisks indicate significant differences between the two experiments for each method. See Supplementary Table S5 for P-values for each predictor at each time point. −C, negative control without O. undulatifolius at the start of the experiment; +C, positive control; CL, clethodim; GL, glyphosate (GL-HW is absorbed into GL in legend here); and HW, hand weeding.

Both experiments showed important differences in observed total and native species richness among removal methods at each time point following treatment (Figures 7 and 8). Glyphosate decreased total and native richness by at least 53% by the end of the first growing season in Experiment 3, but in Experiment 2, glyphosate plots did not differ from plots using any other removal method. During the second growing season, hand weeding had higher total richness than all other methods in Experiment 2, which supports our prediction. By the end of Experiment 3, glyphosate–hand weeded plots had increased in total richness and did not differ from the clethodim or hand-weeded plots. For native richness, there were no consistent patterns for Experiment 2 regarding either which method or herbicide rate resulted in the most richness, but the hand-weeded and clethodim 0.20 kg ha−1 plots had higher native richness than clethodim 0.13 kg ha−1 and glyphosate 0.49 kg ha−1 at the end of the experiment. However, the hand-weeded plots were the only ones to have significantly increased over the year. For Experiment 3, native richness mirrored the response of total richness at the Maryland sites, with total and native richness in treated plots being at least 33% higher than the positive control by August 2019. At Shenandoah, only the clethodim plots had higher native richness than the positive control by August 2019. Therefore, while we had predicted that glyphosate would result in the lowest species richness, initial decreases caused by the chemical either disappeared within two growing seasons or never differed from the results with other methods. This result is in contrast to other studies that have found herbicides to have a lasting, negative effect on native plant recovery after invasive removal (Harmoney et al. Reference Harmoney, Stahlman and Hickman2007; Ray et al. Reference Ray, Sherman, Godinho, Hanson and Parker2018; Rinella et al. Reference Rinella, Maxwell, Fay, Weaver and Sheley2009).
We found that all three treatment methods have the potential to restore species richness, but the manner of control determined this response. When we hand weeded O. undulatifolius along with other invasive species (Experiment 2), we saw a strong, positive response in total species richness and native richness compared with clethodim and glyphosate, despite not applying these treatments a second time. However, when we selectively hand weeded O. undulatifolius alone (Experiment 3), we did not see a difference in total and native richness between hand weeding and the clethodim treatment. This disparity suggests that the removal of additional invasive species in Experiment 2 provided a greater opening for other species to establish compared with removing O. undulatifolius alone. We also observed a stronger negative response to the glyphosate treatment compared with the other treatments in Experiment 3 than in Experiment 2. We suspect that this result is because richness was surveyed a second time in July and August for Experiment 3 versus October for Experiment 2. Herbaceous richness may be low in October due to the senescence of spring and early-summer species compared with July/August, and thus Experiment 2 might not have captured this drop in richness. Despite the decrease in richness from the onetime glyphosate treatment in Experiment 3, we found that both total and native richness increased in these plots over time, eventually to the level of the hand-weeding and clethodim treatments by the third year in Experiment 3. However, this gradual increase would likely not have occurred had we re-applied glyphosate in the second and third year rather than switching to hand weeding.
Our results suggest that not only does O. undulatifolius exert negative effects on total and native species richness, these systems have the potential to be restored using these removal methods. These findings corroborate the results from Tekiela and Barney (Reference Tekiela and Barney2017), who found strong increases in total and native richness with mechanical O. undulatifolius removal, and from Beauchamp et al. (Reference Beauchamp, Koontz, Suss, Hawkins, Kyde and Schnase2013), who found a negative relationship between O. undulatifolius and richness. In addition, while we did not successfully eradicate O. undulatifolius in our plots, we show that eradication was not required to achieve native recovery (Aulakh et al. Reference Aulakh, Enloe, Loewenstein, Price, Wehtje and Miller2014; Kettenring and Adams Reference Kettenring and Adams2011; Prior et al. Reference Prior, Adams, Klepzig and Hulcr2018; Reid et al. Reference Reid, Morin, Downey, French and Virtue2009), as has been found with other invasive grasses (Flory Reference Flory2010; Flory and Clay Reference Flory and Clay2009; Ray et al. Reference Ray, Sherman, Godinho, Hanson and Parker2018). Given that we achieved native richness levels that did not differ from our negative (reference) control without O. undulatifolius in only three growing seasons with small plots, O. undulatifolius could be considered a high-priority species for management (Parker et al. Reference Parker, Simberloff, Lonsdale, Goodell, Wonham, Kareiva, Williamson, Von Holle, Moyle, Byers and Goldwasser1999).
Although we found consistent approaches among some treatments tested, future research is required to determine the cause of some of the variation in the response of O. undulatifolius to control and what other management strategies may be required for restoration. First, we did not determine whether four consecutive removal treatments could achieve complete eradication within an area and whether our results are applicable to larger spatial scales. This information may be essential, as long-term conclusions and scaled-up studies may differ from initial findings (Blossey Reference Blossey1999; Quirion et al. Reference Quirion, Simek, Dávalos and Blossey2018), and some studies have found that long-term monitoring is essential for increasing native plant abundance (Blossey Reference Blossey1999; McCarthy Reference McCarthy, Luken and Thieret1997; Reid et al. Reference Reid, Morin, Downey, French and Virtue2009). Second, we did not determine whether treatments prevented new germinants from seeds or stolons. Third, future research could determine whether the seeding of native species is necessary for the restoration of certain desirable species (Kettenring and Adams Reference Kettenring and Adams2011). Fourth, although we know that O. undulatifolius is very shade tolerant, we did not determine whether any abiotic factors such as light may have affected our results. Fifth, an investigation into whether white-tailed deer interact to suppress native plants will provide important information regarding the management of these two species (AKMB and MHHS, unpublished data), as deer are widely known to drastically change the structure and composition of eastern forests and interact with other invasive plants (Baiser et al. Reference Baiser, Lockwood, La Puma and Aronson2008; Duguay and Farfaras Reference Duguay and Farfaras2011; Waller and Alverson Reference Waller and Alverson1997). Finally, while we did observe some reinvasion by other invasive species in our removal plots (AKMB and MHHS, unpublished data), more research is required to determine what factors control this response.
This study demonstrates the importance of testing treatments over several growing seasons at multiple sites. We found that time and site were significant predictors for many of our responses, even though site was not usually selected in the top model. For example, in Experiment 2, the clethodim treatments were more effective at the Pipeline site than the McKeldin site. Inconsistencies between sites have also been found by Stricker et al. (Reference Stricker, Hagan and Flory2015) and Ray et al. (Reference Ray, Sherman, Godinho, Hanson and Parker2018), but little is known regarding the mechanism behind this variation. Similarly, while the majority of invasive plant removal studies occur over a year or less (Stricker et al. Reference Stricker, Hagan and Flory2015), we show that reapplying removal treatments may be necessary for at least three growing seasons and that the effects of a single application of a broad-spectrum herbicide (glyphosate) can affect species richness for at least a year following treatment.
Acknowledgments
The authors thank Kerrie Kyde, invasive plant ecologist formerly with the Maryland DNR, for her work on Experiment 1 and providing the data for this paper. We also thank Lane Heimer, weed control specialist for the Maryland Department of Agriculture, and Jake Hughes, biological science technician at Shenandoah National Park, for their assistance with the herbicide applications each year. We had assistance in the field from Katja Diekgers, Kristine Camper, Joy Hartfield, Logan Mathers, Greg Lande, Amber Epps, Dan Bolton, Stephanie Clements, Rob Morgante, Jacquelyn Picciani, Eva Lopez, Megan Cleaver, and Artie Garcia. We also thank the staff members at Maryland State Parks, Baltimore City Parks, Montgomery County Department of Parks, and Shenandoah National Park for providing the opportunity to carry out our research. Miami University, Towson University, and the Virginia Department of Conservation and Recreation–Division of Natural Heritage provided funding for this project. No conflicts of interest have been declared.
Supplementary material
To view supplementary material for this article, please visit https://doi.org/10.1017/inp.2020.22