Implications
Intramuscular fat (IMF) improves meat product quality through enhanced flavour and juiciness. High marbling cuts command premium prices in some countries and grading systems, but there is substantial monetary cost involved in grain feeding animals to enhance IMF. There is need for new methods to rationally select high-potential animals for sound investment in long feeding. We also see value in developing a better understanding of fundamental marbling biology. In this article, we contrast genome-wide gene expression patterns in two breed crosses divergent for marbling in an attempt to identify new early markers of marbling potential and help improve our biological understanding in this enigmatic area. We propose skeletal muscle expression of WISP2 between 7 and 12 months postnatal to be an attractive new candidate for future marbling potential, presumably by quantifying adipocyte precursor cell number and/or activity.
Introduction
In the beef industry, intramuscular fat (IMF) – or ‘marbling’ – is highly valued as it confers desirable organoleptic properties of taste, juiciness and tenderness that command premium prices in international markets. A better understanding of the molecular drivers of marbling may ultimately help reduce variation in carcass composition and also ensure high cost grain during extended feedlotting is not wasted on low IMF potential individuals. IMF manifests as white flecks or streaks of adipose tissue between bundles of muscle fibres (Harper and Pethick, Reference Harper and Pethick2004). From several biological perspectives cattle marbling remains intractable. It has not yielded to genome-wide association studies – that is, there are no reliable DNA markers that explain substantial amounts of phenotypic across populations and breeds (Pannier et al., Reference Pannier, Mullen, Hamill, Stapleton and Sweeney2010). However, application of the latest thinking in network theory has been exploited to reverse engineer a plausible set of contributing regulatory molecules (PPARGC1A, HNF4G, FOXP3) based on single nucleotide polymorphism association data across three breed types, Bos taurus, Bos indicus and tropical composites (Ramayo-Caldas et al., Reference Ramayo-Caldas, Fortes, Hudson, Porto-Neto, Bolormaa, Barendse, Kelly, Moore, Goddard, Lehnert and Reverter2014).
Similarly, there are no known causal mutations, the contributing cell populations have not been well defined (Harper and Pethick, Reference Harper and Pethick2004; Bonnet et al., Reference Bonnet, Cassar-Malek, Chilliard and Picard2010), and gene expression analyses have tended to document increases in the expression of end-point fatty acid metabolism proteins such as members of the fatty acid-binding protein family (Wang et al., Reference Wang, Bower, Reverter, Tan, De Jager, Wang, McWilliam, Cafe, Greenwood and Lehnert2009; De Jager et al., Reference De Jager, Hudson, Reverter, Barnard, Cafe, Greenwood and Dalrymple2013). However, genetics is a strong driver of marbling, such that in elite Wagyu animals IMF can exceed 50% in skeletal muscle (Gotoh et al., Reference Gotoh, Albrecht, Teuscher, Kawabata, Sakashita, Iwamoto and Wegner2009), whereas in other breeds such as Brahman the figure averages <5%. IMF is also influenced by environmental factors such as diet, particularly through vitamin A restriction. Indeed, the retinoic acid (RA) axis is involved in adipogenic phenotypes in general (Bonet et al., Reference Bonet, Ribot and Palou2012).
Here, we make use of a previously analysed gene expression experiment contrasting high marbling Wagyu×Hereford (W×H) crossbred cattle v. lower marbling Piedmontese×Hereford (P×H) crosses at 10 developmental time points. These include three prenatal time points coincident with the two major waves of myogenesis, and the onset and end of functional differentiation (Hudson et al., Reference Hudson, Lyons, Reverter, Greenwood and Dalrymple2013).
The comparison of high and low marbling cattle breeds allows an examination of early developmental processes, including the impact of precursor cell populations (as inferred via the gene expression profiles). In addition, we can also examine later environmental influences such as major nutritional transitions relating to birth, weaning and feedlotting. The multi-dimensional nature of the experimental design also allows more sophisticated analyses than simple computation of differential expression (DE).
High throughput gene expression analysis has previously been used to contrast these two breeds in the context of differential fat development (Wang et al., Reference Wang, Bower, Reverter, Tan, De Jager, Wang, McWilliam, Cafe, Greenwood and Lehnert2009). However, the previous publication (Wang et al., Reference Wang, Bower, Reverter, Tan, De Jager, Wang, McWilliam, Cafe, Greenwood and Lehnert2009) was based on a far less comprehensive cDNA array. Highlighted genes included THRSP and FABP4. In a separate experiment based on 48 Brahman cattle, we correlated individual gene expression measures to individual IMF% (De Jager et al., Reference De Jager, Hudson, Reverter, Barnard, Cafe, Greenwood and Dalrymple2013). This approach identified the gene set that best correlates to IMF% is triacylglyceride (TAG) deposition, and includes FABP4. A number of other groups have identified similar sets of genes in various production species based on similar analyses performed on similar experimental designs (Saez et al., Reference Saez, Davail, Gentes, Hocquette, Jourdan, Degrace and Baeza2009; Li et al., Reference Li, Chen, Wen, Zhao, Zheng and Liu2013; Wang et al., Reference Wang, Xue, Jin, Zhang, Ma and Xu2013; Ren et al., Reference Ren, Wu, Liu, Zheng, Li, Zuo, Xu, Li, Lei, Ni and Xiong2014). However, to date the simplest measures of DE and correlations of abundance to phenotype have yielded only modest regulatory insight. Various analytical reasons can be given for this (Hudson et al., Reference Hudson, Dalrymple and Reverter2012).
The purpose of this study is to identify early muscle gene expression markers for future marbling potential and also to shed light on molecular mechanisms of marbling development. Here, a combination of a denser array platform detailing the expression of most of the transcriptome, some targeted analytical questions, coupled with application of a set of higher-order network inference algorithms uniquely developed by our group (1) reinforces a likely link between marbling adipocyte biology and extracellular matrix (ECM) remodelling (WISP2), (2) allows the detection of novel candidate early diagnostic molecular markers for future marbling potential (e.g. WISP2, RAI14), (3) is consistent with a relatively pro-inflammatory state in the Wagyu compared with Piedmontese (CYP4F2) and (4) identifies a small set of DNA-binding transcription factors (TF) that have apparently been re-wired into a ‘pro-marbling’ regulatory circuit in the Wagyu breed cross (e.g. ISGF3G, YEATS4, MDM2 and others).
Material and methods
Details relating to the animal experiment, RNA extraction, microarray hybridisation and data normalisation can be found in the studies by Wang et al. (Reference Wang, Byrne, Reverter, Harper, Taniguchi, McWilliam, Mannen, Oyama and Lehnert2005 and Reference Wang, Bower, Reverter, Tan, De Jager, Wang, McWilliam, Cafe, Greenwood and Lehnert2009), Lehnert et al. (Reference Lehnert, Reverter, Byrne, Wang, Nattrass, Hudson and Greenwood2007), Hudson et al. (Reference Hudson, Reverter and Dalrymple2009a and Reference Hudson, Reverter, Wang, Greenwood and Dalrymple2009b). As previously described in a study by Lehnert et al. (Reference Lehnert, Reverter, Byrne, Wang, Nattrass, Hudson and Greenwood2007), Hereford cows were artificially inseminated or mated to one of five different Wagyu sires (W×H) or one of six different Piedmontese sires (P×H). All Piedmontese sires were homozygous for the MSTN mutation in exon 3. In all, three foetuses from each sire breed were acquired by caesarean section; three newborn calves per sire breed were euthanised by lethal injection within 24 h of birth. Longissimus muscle was dissected immediately after death of the foetuses or calves, and tissue samples frozen in liquid nitrogen. The animals were bred and grown within pasture-based nutritional systems followed by feedlot finishing (Greenwood et al., Reference Greenwood, Cafe, Hearnshaw, Hennessy, Thompson and Morris2006). Each cohort grazed as a single group during backgrounding. Feedlotting took place at the Tullimba feedlot (Kingston, NSW). Details regarding nutrition and growth can be found in the study by Greenwood et al. (Reference Greenwood, Cafe, Hearnshaw, Hennessy, Thompson and Morris2006). The prenatal time points coincide with primary myogenesis, secondary myogenesis and onset of functional differentiation. The remainder comprised birth, 3 month, 7 month (weaning), 12 month, 20 month, 25 month (feedlot entry) and 30 month animals. In attempting to infer the development of marbling in cattle, we applied a number of analyses on both within- and between-breed basis. The various analytical steps are documented below.
Identification of expression-based markers for current marbling status
To prioritise genes whose expression profile might reflect current marbling status, we made an assumption that lipid content would increase its proportional representation in a given mass of postnatal bovine muscle over developmental time, via hyperplasia and hypertrophy of marbling adipocytes. Predicated on this assumption, we asked the question ‘the expression of which genes possess a positive postnatal slope in both breeds, with a steeper slope in the Wagyu?’. Within each breed and gene, we fitted a simple linear regression as follows:
 $$y=a{\plus}x\beta {\plus}e$$
where y is vector of expression abundance across the seven postnatal time points; a the y-axis intercept; x the index of the seven time points (without loss of generality assumed equally spaced); β the regression slope; and e the random residual associated with the goodness of fit. We selected genes for which the P-value associated with the estimate of β was <0.01 in both populations and the magnitude of the estimate greater in Wagyu than in Piedmontese. We then ranked the output on the extent of the slope difference (the ‘differential regression’) and submitted the list to GOrilla for functional enrichment analysis. We also asked the related – but more stringent – question ‘which genes show a monotonic increase at all postnatal time points, and are always higher in the Wagyu compared to the Piedmontese at each time point?’.
Identification of expression-based markers for future marbling potential
To identify genes whose expression profiles might allow a better prediction of future marbling potential, we examined the expression profiles for genes that diverge between the breeds earlier in postnatal development than the end-point fat metabolism genes that diverge only at 20 to 25 months. Given the proposed role of ECM remodelling in preparing the tissue environment for invasion and development of marbling adipocytes (Harper and Pethick, Reference Harper and Pethick2004), we focused on genes whose encoded proteins have been annotated as ECM remodellers. Lists of significantly DE genes were identified at each postnatal time point as previously described and explored for functional enrichment. Gene annotation to ECM was determined by uploading the gene lists to DAVID software (Huang da et al., Reference Huang da, Sherman and Lempicki2009) and augmented by literature searches and manual curation.
Wagyu v. Piedmontese DE
To further understand the transcriptomic differences between Wagyu and Piedmontese muscle, we examined those genes that were both significantly differentially expressed, as well as being annotated by DAVID software as involved in fat metabolism. In a time course experiment there are a number of different legitimate ways of computing DE. For this analysis, we were interested in ‘overall’ patterns of DE so we computed a ‘surface-based’ version of DE as previously described according to a study by Hudson et al. (Reference Hudson, Dalrymple and Reverter2012) that incorporates the shape of the profile across the 10 points. The surface of the DE of the ith gene, (SDE i ), is defined as the sum of squared differences between the expression of the ith gene in the two breeds (P, Piedmontese; W, Wagyu) across the 10 time points. This sum follows a χ 2 distribution with 9 d.f.:
 $${\rm SDE}_{i} =\mathop{\sum}\limits_{t=1}^{10} {\left( {P_{{i,t}} {\minus}W_{{i,t}} } \right)^{2} } \,\sim\,\chi _{{9{\rm d}{\rm .f}{\rm .}}}^{2} $$
We have previously discovered that ‘weighing’ DE for average abundance (by multiplying the two) gives a much more compelling description of the change in phenotype (Hudson et al., Reference Hudson, Reverter and Dalrymple2009a and Reference Hudson, Lyons, Reverter, Greenwood and Dalrymple2013), so we applied this correction to the SDE measure. We ranked the output on extent of this weighted SDE metric and explored it for genes annotated as being involved in fat metabolism.
The transcriptional regulation of marbling
Although molecular correlates of marbling have been previously identified, far less is known about the causal transcriptional regulation of the phenotype. To identify transcription factor regulatory circuits that have apparently been re-wired in the Wagyu breed, we applied our recently developed regulatory impact factor (RIF) analysis (Hudson et al., Reference Hudson, Reverter and Dalrymple2009a and Reference Hudson, Lyons, Reverter, Greenwood and Dalrymple2013; Reverter et al., Reference Reverter, Hudson, Nagaraj, Perez-Enciso and Dalrymple2010). This procedure exploits global patterns of differential co-expression (or ‘differential wiring’) to infer those regulatory molecules whose behaviour is systematically different in a contrast of interest, in this case the Wagyu v. Piedmontese breed crosses. Herein, the experimental contrast was P v. W (i.e. Piedmontese v. Wagyu) and the RIF metrics for the rth regulator (r=1, 2, … , 920) were computed using the following formulae:
 $${\rm RIF}1_{r} ={1 \over {n_{{{\rm DE}}} }}\mathop{\sum}\limits_{j=1}^{j=n_{{{\rm DE}}} } {x_{j} {\times}d_{j} {\times}{\rm DC}_{{rj}}^{2} } $$
and
 $${\rm RIF2}_{r} ={1 \over {n_{{{\rm DE}}} }}\mathop{\sum}\limits_{j=1}^{j=n_{{{\rm DE}}} } {\left[ {\left( {x_{j}^{{\rm P}} {\times}r_{{rj}}^{{\rm P}} } \right)^{2} {\minus}\left( {x_{j}^{{\rm W}} {\times}r_{{rj}}^{{\rm W}} } \right)^{2} } \right]} $$
where n
DE represented the number of DE genes; x
j
the average expression of the jth DE gene across all time points; d
j
the DE of the jth gene in the P v. W contrast; DC
rj
the differential co-expression between the rth regulator and the jth DE gene, and computed from the difference between
 $$r_{{rj}}^{{\rm P}} $$
and
 $$r_{{rj}}^{{\rm W}} $$
, the correlation co-expression between the rth regulator and the jth DE gene in the P and W samples, respectively; finally,
 $$x_{j}^{{\rm P}} $$
and
 $$x_{j}^{{\rm W}} $$
the average expression of the jth DE or TS gene in the P and W samples, respectively.
Results
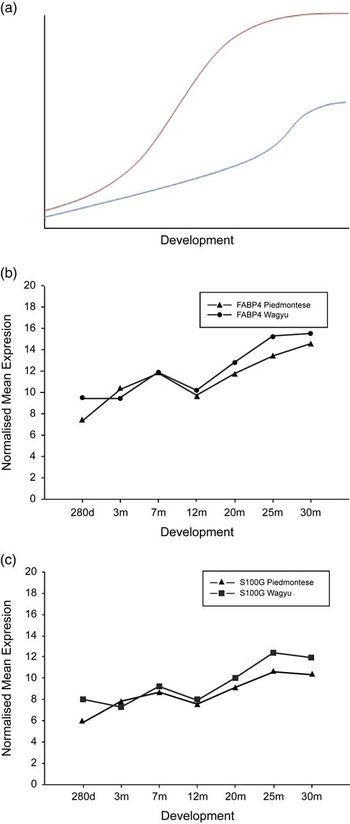
All normalised gene expression values are expressed on a log 2 scale. The profile of postnatal IMF content over development is schematically characterised in Figure 1a. This was based on the study by Pethick et al. (Reference Pethick, Harper and Oddy2004), which documented the relationship between carcass weight and IMF% in crossbred Angus×Hereford, Angus and Japanese Black×Holstein cross cattle. We previously identified two closely related sets of fat metabolism genes whose expression was highly correlated (co-expressed) across development (Hudson et al., Reference Hudson, Reverter, Wang, Greenwood and Dalrymple2009b). One gene sets comprised ADIPOQ, PLS1, PLIN1, CIDEC, FABP4 (Figure 1b) and TUSC5, whereas the other ADIG, THRSP and S100G (Figure 1c). The expression of these genes reflects TAG deposition rate, which reflects current IMF% in some circumstances.
A schematic diagram illustrating the early and more rapid accumulation of marbling fat in Wagyu (red) compared with Piedmontese (blue) at the phenotype level (a). Normalised mean expression levels (expressed as log 2 values) mRNA expression profiles for FAPB4 representing lipid co-expression module 1 (b) and S100G representing lipid co-expression module 2 (c) show a marked breed divergence relatively late (25 months) before the profiles tend to reconverge at 30 months at a time even though the intramuscular fat phenotype itself is most divergent at this time.

Expression-based markers for current marbling status and deposition rate
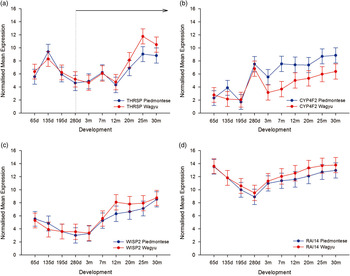
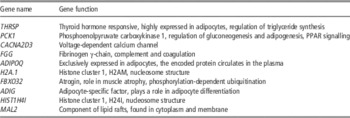
In an attempt to identify estimators of the IMF contrast between the W×H and P×H crosses, we identified those genes that showed a positive regression in the postnatal samples of both, but which was steeper in the Wagyu, then ranked the list on the extent of the breed difference. We submitted this ranked list to GOrilla (Eden et al., Reference Eden, Lipson, Yogev and Yakhini2007) and explored it for functional enrichment. This enriched for fatty acid metabolism with THRSP, PCK1, ADIPOQ, ADIG, SCD, G0S2, ACSM1, PLIN1, CIDEA and TUSC5, all in the top 25 (Table 1; Supplementary Material S1Footnote 1 ). THRSP was ranked in first position illustrating that it met this criterion the best. From this perspective, one could conclude that THRSP is the most robust of the end-point characterisers of current marbling status in contrasting these two breeds, in line with a previous publication based on a cDNA array (Wang et al., Reference Wang, Bower, Reverter, Tan, De Jager, Wang, McWilliam, Cafe, Greenwood and Lehnert2009). However, further exploration of these profiles, including THRSP, showed they did not increase monotonically at each postnatal time point and also that the profiles converged during feedlotting, just before slaughter, when the difference in the marbling phenotype is at its most apparent (Figure 2a). This implies the profiles do not provide an unequivocal indication of current IMF%, but are influenced by environmental factors. As previously suggested they most likely represent TAG deposition rate.
Microarray-based normalised mean expression levels (expressed as log 2 values) of genes encoding proteins annotated as being involved in fat metabolism that are divergent between the breeds based on the following criteria: differential regression in the postnatal samples illustrated by THRSP (a), extreme surface differential expression illustrated by CYP4F2 (b), early postnatal divergence and role in connective tissue remodelling illustrated by WISP2 (c) and monotonic increase in all the postnatal time points in both breed crosses, but always higher in the Wagyu illustrated by RAI14 (d). The horizontal arrow in (a) denotes all the postnatal time points, that is, from birth to 30 months. The standard errors on or between gene within time point basis ranged from 1.13 to 1.19.

Top 10 extreme ‘differential regression’ Wagyu minus Piedmontese in the postnatal samples

In an attempt to overcome this possible limitation, we asked the related question ‘which genes, if any, increase expression monotonically at all postnatal time points (i.e 280 days through to 30 months) in both breeds, and are also always relatively higher in W×H than P×H at each time point’. We asked this question on the basis that we know IMF content to increase over postnatal time. Only two genes met these very stringent criteria (LACTB2 and RAI14). Of these, retinoic acid-induced 14 (RAI14) appears particularly noteworthy as it has a potential functional link to marbling through its involvement in both the RA axis and adipocyte biology. The maintenance of the cross divergence in the expression profile until 30 months contrasts with the fatty acid metabolism genes (Figure 2d).
Expression-based prognostics for future marbling potential
In order to identify a set of genes that might better predict future marbling potential, we built an analysis on the assumption that ECM remodelling most likely precedes marbling, providing a favourable tissue environmental niche for the marbling adipocytes to divide and grow. Consequently, we aimed to identify those genes which both diverge between the breeds earlier than the classic end-point fatty acid metabolism genes (i.e. before 20 months), prioritising those (if any) annotated as being involved in matrix remodelling. This analysis prioritised WISP2 (Figure 2c).
W×H v. P×H DE
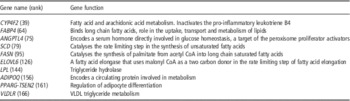
In the absence of any particular expectation of expression profile in the two crosses, we also explored overall patterns of DE of genes encoding proteins annotated as being involved in fatty acid metabolism. We ranked on the extent of surface DE. This prioritised the following genes encoding products with roles in fat metabolism as being most informative between breeds: CYP4F2 (Figure 2b), VLDLR, ANGPTL4, FABP4, SCD, FASN, ELOVL6, LPL, ADIPOQ and PPARG-TSEN2 (Table 2; Supplementary Material S2Footnote 2 ). Except for the first three, they are all ‘end-point’ genes (De Jager et al., Reference De Jager, Hudson, Reverter, Barnard, Cafe, Greenwood and Dalrymple2013). CYP4F2, the top-ranked gene, is most divergent between the two crosses at 7 months. However, unlike the other fat metabolism genes, which were more highly expressed in W×H animals, it was actually 16-fold higher in the lower IMF P×H animals. A number of other cytochrome P450 family members (e.g. CYP1A1, CYP4B1) are also highly DE between the breeds, although the direction of DE is not always consistent.
Top 10 extreme ‘surface DE’ accounting for abundance when comparing Wagyu v. Piedmontese muscle

DE=differential expression; VLDL=very low-density lipoprotein.
The illustration of those genes annotated as encoding proteins with roles in fat metabolism. All but CYP4F2 are relatively upregulated in high IMF Wagyu.
The transcriptional regulation of marbling
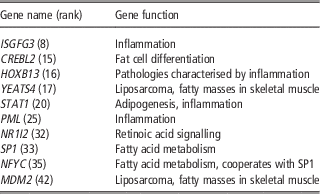
We ranked the RIF output, and explored those TF among the extremes of the ranked list that have been annotated as being involved in the transcriptional regulation of fat metabolism (Table 3; Supplementary Material S3Footnote 3 ). As previously reported (Hudson et al., Reference Hudson, Reverter and Dalrymple2009a), MSTN possesses the most extreme differential network value, reflecting the site of the causal mutation in Piedmontese, and its position as pre-eminent driver of the breed phenotype difference. Further manual exploration of this list with a view to identifying transcriptional regulators involved in adipogenic phenotypes highlighted YEATS4 (16th), STAT1, (18th) and MDM2 (34th).
Transcriptome wiring analysis

Tabulated are those transcriptional regulators who are in the top 5% (i.e. the top 46 out of 920 regulators) in terms of change of network connectivity between Piedmontese and Wagyu and who have been previously annotated as having a role relating to fat metabolism. MSTN, the causal double muscling mutation in Piedmontese, was ranked first by this analysis.
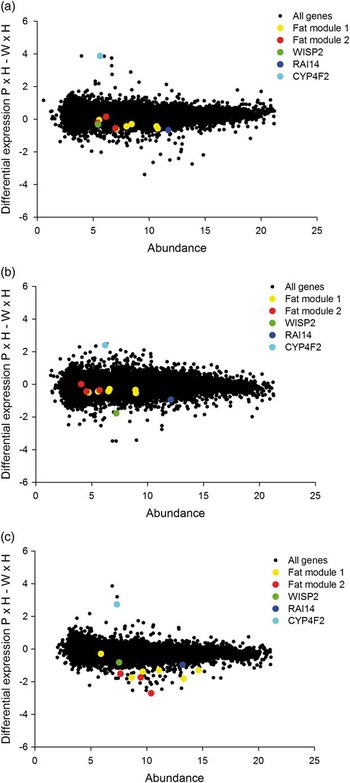
To provide the genome-wide context for the prioritised DE genes, we plotted MA plots at 7, 12 and 25 months (Figure 3a, b and c, respectively), highlighting those genes whose expression level was detected as relevant to fat metabolism.
Microarray-based genome-wide MA plots based on normalised mean expression levels (expressed as log 2 values) at 7 month (a), 12 month (b) and 25 month (c) postnatal highlighting the extent and timing of differential expression (DE) of fat module 1 (ADIPOQ, PLS1, PLIN1, CIDEC, FABP4 and TUSC5), fat module 2 (ADIG, THRSP, S100G), WISP2, RAI14 and CYPF42. Other DE functional groups not highlighted include those encoding muscle slow twitch fibre subunits, immune proteins and mitochondrial proteins.

Discussion
In this paper, we describe a combination of expression-based analyses aimed at defining genes related to marbling development. We were particularly interested in the identification of early markers of marbling potential. In comparing the breeds, we prioritised genes showing at least one of extreme DE; dramatic changes in regression; monotonic increase postnatally but always higher in the W×H; substantial global network re-wiring as estimated by genome-wide differential co-expression. A major strength of the experimental design under consideration is its comprehensiveness (seven postnatal time points, 10 developmental time points in total) and the extent of the breed divergence in the phenotype, which provides a favourable signal to noise.
Caveats
A weakness is that a component of the relative increase in marbling observed in the W×H will be attributable to the impact of the MSTN mutation on leanness in the Piedmontese, and that this MSTN signal interferes with interpretation. Thus, it is not clear whether any given fat metabolism gene expression change reflects MSTN-induced leanness in Piedmontese, or enhanced marbling in Wagyu, or some combination therein. This issue potentially complicates the generalisation of the gene expression findings reported here to other breeds. In an attempt to generate a gene list that might be attributable to impaired MSTN signalling, we examined the gene expression output for a MSTN knockout mouse model (Welle et al., Reference Welle, Cardillo, Zanche and Tawil2009). Surprisingly, no genes annotated in fatty acid metabolism displayed a downregulation in expression in this particular model. Unfortunately, this provides no information for us to refine our molecular understanding of the impact of MSTN on leanness observed at the phenotype level. It is unlikely that differences in the statistical methods used to establish significance of DE account for the fat metabolism discrepancy between our cattle study and this mouse study.
Marbling physiology and development
In postnatal ruminant muscle, adipocytes undergo hyperplasia before a period of infilling hypertrophy. The relative contributions of these two processes to marbling are not fully known. However, both processes – either in isolation or in combination – would be expected to systematically increase IMF% over postnatal development. In principle, this should be reflected by corresponding increases in the expression of a set of ‘adipocyte fat metabolism genes’. Indeed, examples of these, which tend to relate to TAG deposition, have been previously identified using DE (Wang et al., Reference Wang, Bower, Reverter, Tan, De Jager, Wang, McWilliam, Cafe, Greenwood and Lehnert2009), co-expression (Hudson et al., Reference Hudson, Reverter, Wang, Greenwood and Dalrymple2009b) and individual correlations of gene expression to phenotype (De Jager et al., Reference De Jager, Hudson, Reverter, Barnard, Cafe, Greenwood and Dalrymple2013). In the latter study, a TAG deposition gene set comprised THRSP, FABP4, CIDEA, DGAT2, PLIN1, PCK1, AGPAT2, ACSM1, CIDEC, ADIPOQ, S100G, TUSC5, ADIG, PLS1 and GPAM. Of these, ADIPOQ and THRSP were previously found to correlate with individual IMF% according to a study by Wang et al. (Reference Wang, Bower, Reverter, Tan, De Jager, Wang, McWilliam, Cafe, Greenwood and Lehnert2009), and a subset were previously found to be co-expressed in two separate network modules (ADIPOQ, PLS1, PLIN1, CIDEC, FABP4 and TUSC5 on the one hand and ADIG, THRSP and S100G on the other) in the muscle co-expression network according to a study by Hudson et al. (Reference Hudson, Reverter, Wang, Greenwood and Dalrymple2009b).
Some authors have argued that the best predictor of future marbling potential is current marbling status (Pethick et al., Reference Pethick, Harper and Oddy2004). If this is correct, the molecular profiles of the end-point fatty acid metabolism genes would be among the most valuable future predictors of marbling potential from a molecular perspective, but only in circumstances where animals are actively depositing fat. From a prognostic perspective, a problem is that these probe-based profiles (e.g. FABP4) do not diverge between the breeds until very late in the postnatal time course, that is, 20 to 25 months. This means they may have limited practical value, as substantial economic investment in the animal has already been made by this time.
Early gene expression markers for marbling development
Given these issues, we developed a number of simple analytical questions with a view to identifying novel gene expression markers of marbling adipocytes. By exploring positive regressions over postnatal development, we hoped one could identify hitherto unrecognised adipocyte markers, in addition to the conventional fat metabolism genes. Not surprisingly, enriched among the genes with positive slopes in both breeds postnatally, but steeper in the W×H, were the expected fat metabolism genes. THRSP was the single best performer, topping the ranked list. This prioritisation of THRSP on differential regression supports a previous finding based on DE using a cDNA array (Wang et al., Reference Wang, Bower, Reverter, Tan, De Jager, Wang, McWilliam, Cafe, Greenwood and Lehnert2009). However, the expression of THRSP fluctuates along the developmental time course, implying it is quite sensitive to environmental and nutritional signals.
Genes with more robust expression profiles, that are less sensitive to nutrition and that do not converge later on in the time course, may be of value. This logic provides the basis for our next steps. There are various lines of evidence linking adipogenesis and ECM biology. One is that during adipogenesis the ECM develops from a fibrillar to laminar structure as cells move from commitment to growth and triglyceride storage (Mariman and Wang, Reference Mariman and Wang2010). In addition, adipogenesis tends to proceed in a collagen-rich ECM environment (Sato-Kusubata et al., Reference Sato-Kusubata, Jiang, Ueno and Chun2011). Further, mature adipocytes invest a substantial amount of energy on ECM maintenance (Mariman and Wang, Reference Mariman and Wang2010). Along these lines, a recent publication using gene expression analysis on Korean Hanwoo cattle found a connective tissue remodeller ADAMTS4 to be a prominent candidate for marbling development (Lee et al., Reference Lee, Gondro, van der Werf, Kim, Lim, Park, Oh, Gibson and Thompson2010). Given the proposed role of ECM remodelling in driving the marbling tissue deposition environment, we undertook a deeper exploration of our data.
We attempted to identify genes annotated as ECM remodellers that diverge earlier than the 20 months displayed by the end-point fat metabolism genes. This process prioritised WISP2 that diverges much earlier, certainly by the 12-month time point and potentially as early as soon after 7 months. WISP2 is known to be highly expressed in human pre-adipocytes. It has recently been discovered to encode a novel secreted adipokine protein that is a negative regulator of pre-adipocyte commitment (Hammarstedt et al., Reference Hammarstedt, Hedjazifar, Jenndahl, Gogg, Grunberg, Gustafson, Klimcakova, Stich, Langin, Laakso and Smith2013). It has also been shown to inhibit the pro-fibrotic connective tissue growth factor (Sabbah et al., Reference Sabbah, Prunier, Ferrand, Megalophonos, Lambein, De Wever, Nazaret, Lachuer, Dumont and Redeuilh2011). Furthermore, WISP2 was recently identified as one of the top candidate secreted proteins in the development of obesity, as determined by fat depot DE between obese and lean humans (Dahlman et al., Reference Dahlman, Elsen, Tennagels, Korn, Brockmann, Sell, Eckel and Arner2012).
Therefore, it appears that the protein encoded by WISP2 has a number of biochemical properties that may lend itself to being a reasonable diagnostic marker for future marbling potential. Its expression level in 12-month bovine muscle apparently represents the number and/or activity of precursor adipocytes and their biological connection to the surrounding ECM. Its expression level would be predicted to be maximally informative in muscle tissue samples somewhere between 7- and 12-month old animals. WISP2 loses its descriptive ability later on in the time course in that, similar to the fat metabolism genes it also converges at the 30-month time point when the difference in IMF phenotype is actually expressed most strongly. This may reflect the fact that the muscle systems have ceased active matrix remodelling by this point and/or that precursor adipocytes have diminished in activity/number.
In a further effort to overcome issues of environmental and nutritional noise, we asked a more stringent question of the data. Which genes, if any, show a monotonic increase at all postnatal time points, in addition to being higher in Wagyu than the Piedmontese at those time points. Notable among the two genes that meet these criteria was RAI14. This gene has recently been discovered to be expressed in porcine adipocytes treated with an inhibitor of the microRNA-103 implicated in adipocyte differentiation (Li et al., Reference Li, Wu, Li, Ning, Li and Yang2010). The divergence between Wagyu and Piedmontese RAI14 is strongly maintained through to the 30-month time point. The expression of this gene would be hypothesised to reflect IMF% increases in a manner that is relatively insensitive to nutrition.
Differentially expressed fat metabolism genes
We were able to identify numerous differentially expressed fat metabolism genes, irrespective of the exact nature of their expression profile in the two breeds. The majority of these are relatively upregulated in the high IMF Wagyu. Having said this, the single largest discriminator between the breeds was CYP4F2, a monooxygenase that can inactivate leukotriene B4, a mediator of inflammation (Hardwick, Reference Hardwick2008). This molecule is relatively upregulated in the Piedmontese. Its role in metabolising both pro- and anti-inflammatory agents indicates it may function in both the activation and resolution of inflammation (Hardwick, Reference Hardwick2008). CYP4F2 is also involved in long chain and very long chain fatty acid metabolism whereupon the hydroxylated fatty acids are converted to dicarboxylic acids, which are preferentially metabolised in the peroxisome to shorter chain fatty acids that in turn can be processed in the mitochondrion (Hardwick, Reference Hardwick2008). CYP4F2 has high affinity for arachidonic acid (Hardwick, Reference Hardwick2008), a compound previously explored in the marbling literature, and is also responsive to RA stimulation (Kalsotra et al., Reference Kalsotra, Du, Wang, Ladd, Kikuta, Duvic, Boyd, Keeney and Strobel2008). Given the strong relationship between inflammation and adiposity, the observation that an inhibitor of inflammation is relatively downregulated in the high fat, pro-inflammatory Wagyu is noteworthy.
Transcriptional regulatory network
One means of inferring causal regulation of biological processes is to exploit global patterns of differential co-expression of TF and other regulators through RIF analysis (Hudson et al., Reference Hudson, Reverter and Dalrymple2009a; Reverter et al., Reference Reverter, Hudson, Nagaraj, Perez-Enciso and Dalrymple2010). RIF has been used to unravel the causal basis of Parkinson’s (Rhinn et al., Reference Rhinn, Qiang, Yamashita, Rhee, Zolin, Vanti and Abeliovich2012) and Alzheimer’s (Rhinn et al., Reference Rhinn, Fujita, Qiang, Cheng, Lee and Abeliovich2013) diseases from brain transcriptome data, showing it generalises very well across species, tissues and data structure. This approach identified key roles for a number of TF relating to inflammation, fatty acid metabolism and production of fatty masses called liposarcoma.
These exemplar TF molecules all possess substantially different patterns of network connectivity between the breeds even though they are not necessarily differentially expressed themselves. The purpose of this final aspect of our analysis is not to identify expression-based markers, but to shed light on earlier mechanisms. The biological origin of any observed differential connectivity between breeds is unknown, with possibilities including breed by developmental changes in (1) cellular localisation, (2) phosphorylation status, (3) ligand binding or (4) possible mutations in the coding sequence. YEATS4 and MDM2 are of particular interest as they have both been observed to be amplified and overexpressed in liposarcoma (Italiano et al., Reference Italiano, Bianchini, Keslair, Bonnafous, Cardot-Leccia, Coindre, Dumollard, Hofman, Leroux, Mainguene, Peyrottes, Ranchere-Vince, Terrier, Tran, Gual and Pedeutour2008), where proliferating fatty masses occur in an uncontrolled manner in a skeletal muscle environment. We have used a number of methods to highlight genes behaving differently between the breed crosses at a number of different development stages.
Conclusions
We conclude that divergent WISP2 expression implicates differential number and/or activity of precursor adipocyte cell populations and ECM remodelling, CYP4F2 may reflect divergent levels of systemic inflammation, RAI14 the differential involvement of the RA axis, and YEATS4 and MDM2 the differential TF regulatory activity in two molecules previously associated with liposarcoma.
The Future
The challenges for the future include the elucidation of a detailed molecular path from causal mutation (if any) to ultimate phenotype in high marbling breeds such as the Wagyu. From a more practical perspective, even earlier diagnostics of marbling potential would be useful, particularly tests that may aid decisions to short or long feed in a commercial feedlot. Given gene expression is an invasive procedure requiring tissue biopsies, connecting the muscle-derived expression data to a blood-borne diagnostic would be of great utility. In terms of the specific molecules whose abundance at key time points has been highlighted here for potential predictive purposes (particularly WISP2, but also potentially RAI14 and CYP4F2), their performance in other commercially important muscles (in addition to LD) and in additional breeds would be an important validation step.
Acknowledgements
We wish to thank Dr Gregory Harper and Dr Aaron Ingham for stimulating insights and discussion relating to an earlier version of this manuscript. The animal experimentation and tissue sampling associated with this study was conducted within the Australian Cooperative Research Centre for Cattle and Beef Quality. The analysis was partially supported by the CSIRO Food Futures Flagship.
Supplementary materials
For supplementary material/s referred to in this article, please visit http://dx.doi.org/10.1017/S1751731114002754