1. Introduction
The World Trade Organization (WTO)’s commitment ‘… to the protection and preservation of the environment through its objective of ensuring sustainable development …’Footnote 1 highlights the rising awareness of environmental concerns in the present-day globalized world. This topic becomes even more important with the increasing participation of developing countries in global value chains (GVCs) that represent nearly 70 per cent of the current trade flows, according to the Organisation for Economic Co-operation and Development (OECD, 2019). While the relationship between GVCs, the environment and firms’ performance is complex and multilayered (Golgeci et al., Reference Golgeci, Makhmadshoev and Demirbag2021; LeBaron and Lister, Reference LeBaron and Lister2021), such flows within GVCs might contribute to the increase in CO2 emissions (Nawaz and Rahman, Reference Nawaz and Rahman2024). Nevertheless, with the introduction of more stringent environmental regulations at the national and international levels, adopting green measures might increase the likelihood of firms integrating into GVCs, as firms must comply with increasingly diverse and demanding environmental standards to be able to compete internationally. Thus, this paper aims to examine the nexus between improving firms’ environmental performance and GVC integration.
As firms are increasingly held accountable for their significant contribution to environmental degradation, upgrading firms’ environmental performance is crucial for achieving environmental sustainability. This will help them mitigate the negative footprint of their production operations. Yet, the idea that the quest for profits and the quest for sustainability are opposing forces has been a long-standing belief among many business entities. More particularly, the assumption is that firms prioritize profits over environmental protection and that these two goals are inherently incompatible. This view, however, has been challenged in recent years, as a growing body of research suggests that businesses may be able to reap a range of long-term benefits as a result of the adoption of green strategies (Marchi et al., Reference Marchi, Maria and Micelli2013; Wang et al., Reference Wang, He and Song2021; Krishnan et al., Reference Krishnan, De Marchi and Ponte2023). The existing literature confirms that the adoption of environmental protection actions not only generates social benefits as the reduction of pollution, for instance, but also generates benefits specific to the firm as productivity gains and performance upgrading (Delmas and Pekovic, Reference Delmas and Pekovic2013; Dangelico and Pontrandolfo, Reference Dangelico and Pontrandolfo2015).
Nevertheless, less attention has been paid to the impact of the firm's environmental performance on its ability to participate in international trade. In light of the zero net emissions scenarios, gaining access to foreign markets represents one of the primary motivations for firms to adopt control measures that mitigate the environmental impact of their production operations (Achabou et al., Reference Achabou, Dekhili and Hamdoun2017). In this line of thought, a strand of the literature (country-specific) shows a significant positive effect of the adoption of environmentally oriented investments on the firm's export performance (Galdeano‐Gómez, Reference Galdeano‐Gómez2010; Antonietti and Marzucchi, Reference Antonietti and Marzucchi2014). Another strand of the literature analyses the impact of GVC participation on environmental performance (Agostino et al., Reference Agostino, Giunta, Ruberto and Scalera2023). These studies find that firms that enter GVCs are more likely to adopt environment-friendly production technologies and use energy more efficiently (Siewers et al., Reference Siewers, Martínez-Zarzoso and Baghdadi2024). This confirms the extent to which global supply chains can go hand in hand with greener production.
Against this background, this study contributes to the literature in two ways. First, it builds on the Porter Hypothesis framework, which suggests that compliance with environmental regulations, even if it imposes additional costs on firms, can serve as a driving force for investment in innovative and clean production technologies that may lead to productivity gains, enhancing the firm's competitiveness on the market (Porter and van der Linde, Reference Porter and van der Linde1995). Second, it thoroughly examines the nexus between the adoption of environmentally friendly measures and GVC integration.
Our paper is different from the paper by Paschoaleto and Martinez-Zarzoso (Reference Paschoaleto and Martínez-Zarzoso2024) in two ways. On the one hand, instead of aggregating all the environmental measures in one index, we analyse the impact of different measures on GVC participation. Environmental actions are divided into three dimensions, following Dangelico and Pontrandolfo (Reference Dangelico and Pontrandolfo2015). First, environmental actions related to raw materials usage include the adoption of waste minimization, recycling and waste management, and the adoption of water management. Secondly, actions related to energy usage include the adoption of more climate-friendly energy generation on-site, the adoption of energy management and the adoption of any measures to enhance energy efficiency. Finally, actions related to pollution are represented by the adoption of air pollution control measures. On the other hand, while Paschoaleto and Martinez-Zarzoso (Reference Siewers, Martínez-Zarzoso and Baghdadi2024) focus on the heterogeneities observed at the regional and technological intensity levels, our paper explores the heterogeneity across the polluting intensity of sectors and firm size levels. To do so, we use firm-level data from the Business Environment and Enterprise Performance Survey (BEEPS). We assess the impact of adopting environmental protection actions on the probability of integrating into GVCs (extensive margin) and on the degree of participation (intensive margin) in GVCs using various definitions (Dovis and Zaki, Reference Dovis and Zaki2020).
The empirical findings support the role of environmental protection measures in boosting firms’ participation in GVCs through the mediation of productivity gains. Precisely, the adoption of environmental actions is likely to increase the firm's integration into GVCs at both the extensive and intensive margin levels. Investing in eco-friendly energy creation measures increases the GVC index by 1.6 units and the GVC likelihood by 22 per cent. However, while the effect on the extensive margin level is robust across different regressions, the intensive one, though present, is less robust in a few cases. Thus, green investments could be considered as an additional source of firm heterogeneity that can help firms overcome the sunk costs of internationalization. Measures reducing air pollution, followed by waste minimization techniques and energy management tools, yield the highest impact at both margins. Our results remain robust after controlling for selection bias using a Heckman-two-stage least squares (2SLS) approach. This effect tends to be relatively higher for large corporations than for small- and medium-sized enterprises (SMEs), for non-dirty compared to dirty sectors and for firms located in Europe and Eastern European countries.
The rest of the paper is organized as follows: a review of the literature is provided in the following section, followed by the data and stylized facts in section 3. Section 4 is dedicated to the methodology and section 5 analyses the empirical results. Section 6 concludes and provides some policy implications.
2. Literature review
The relationship between international trade and environmental performance, whether at the macroeconomic or at the microeconomic level, is central in the recent literature. Most of the studies tend to determine the impact of trade liberalization on the environment. However, the impact of environmental performance improvements on trade has received less attention, especially when focusing on the firm level. Thus, to examine the impact of environmental performance on GVC participation, we bridge the gap between three strands of the literature: first, the firm-level determinants of participation in GVCs; second, the link between the environment and firms’ performance; and third, the nexus between trade, GVC and firms’ environmental performance.
2.1. Determinants of participation in GVCs
As the emergence and expansion of GVCs have reshaped trade flows in the globalized world economy, a variety of studies on GVCs have subsequently arisen. Correspondingly, a strand in the literature has emerged to examine the theoretical and conceptual framework of firms’ dynamics within GVCs that is based on the work of Melitz (Reference Melitz2003). Antras and Helpman (Reference Antras and Helpman2004) extend the heterogeneous firm model of Melitz (Reference Melitz2003) to analyse firms’ participation in GVCs. Their theoretical model suggests that, among the productive firms that serve the foreign market, only the most productive ones succeed in engaging in foreign direct investment (FDI) by offshoring the production of some of their intermediate inputs, or in foreign outsourcing.Footnote 2
At the empirical level, most of the studies identify a firm as a participant in a GVC if it is a two-way trader; hence, it is simultaneously directly or indirectly exporting and importing intermediate inputs (Cieślik et al., Reference Cieślik, Michałek and Szczygielski2019; Urata and Baek, Reference Urata and Baek2020). However, Beghin et al. (Reference Beghin, Maertens and Swinnen2015) and Nadvi (Reference Nadvi2008) consider every international trader – whether exporter, importer or two-way trader – that holds an internationally recognized quality certification, as a GVC firm. Then, a more comprehensive approach to identifying firms that are integrated in GVCs has been developed by Dovis and Zaki (Reference Dovis and Zaki2020), which provides four different definitions of GVC firms (based on whether they are two-way traders, and have foreign ownership and international certification).
The empirical literature shows that firm productivity is a fundamental determinant of its integration in a GVC. Indeed, firms that have different levels of productivity face a trade-off between incurring the variable transport cost of exporting to a foreign market and incurring the fixed cost of opening a foreign affiliate (offshoring). Yeaple (Reference Yeaple2009) argues that, for U.S. multinational enterprises, only the most productive firms in the domestic market would choose to open foreign affiliates, yet less productive ones will find it more profitable to export. Additionally, further empirical investigations have defined, using cross-country firm-level data from the World Bank Enterprise Surveys, a set of firm characteristics as key determinants of participation in GVCs. These variables are high labour productivity, firm size, foreign ownership, high technological capabilities and the possession of international quality certification (Cieślik et al., Reference Cieślik, Michałek and Szczygielski2019; Urata and Baek, Reference Urata and Baek2020; Fernandes et al., Reference Fernandes, Kee and Winkler2022).
2.2. The environment and firms’ performance
On another front, the relationship between environmental sustainability and firm's economic performance is attracting growing attention, in the light of two main contradictory views, namely the Porter Hypothesis and the Pollution Haven Hypothesis (Porter and van der Linde, Reference Porter and van der Linde1995; Ambec et al., Reference Ambec, Cohen, Elgie and Lanoie2013). On the one hand, the latter suggests that strict environmental regulations in developed countries can lead firms to relocate their production to countries with weaker environmental regulations, seeking to avoid the costs of complying with such regulations. In that case, the risk would be a ‘race to the bottom’ as globalization necessitates a shift to lower environmental standards for countries to become more competitive and attract FDI.
On the other hand, the Porter Hypothesis, named after the economist Michael Porter, challenges this view, by emphasizing the role of environmental regulations in ‘triggering innovation’, resulting in productivity gains that mitigate and sometimes counteract the cost of complying with these regulations (Delmas and Pekovic, Reference Delmas and Pekovic2013; Hu et al., Reference Hu, Jiao, Tang, Han and Sun2021). This is mainly related to the decrease in pollutant emissions by reducing the amount of waste, thus fewer inputs and higher outputs or higher labour productivity (Berman and Bui, Reference Berman and Bui2001; Dangelico and Pontrandolfo, Reference Dangelico and Pontrandolfo2015). In the same vein, other studies prove that the firm's efforts targeting its environmental performance can lead to a reduction in its production costs and enhance the efficiency of input usage (Christmann, Reference Christmann2000). Ultimately, firms can achieve environmental and economic upgrading simultaneously.
2.3. Trade, GVC and environmental performance of firms
With regard to trade, GVC and the environment, Cui et al. (Reference Cui, Lapan and Moschini2012) develop a theoretical model to tackle the relationship between adopting clean technologies and exporting firms, by introducing a choice of technology upgrade to a cleaner one in the framework of Melitz (Reference Melitz2003). They define three levels of productivity cut-offs and argue that less productive firms serve the domestic market while preserving their dirty technology, more productive firms succeed in entering the foreign market but also preserve their dirty technology, and only the most productive firms can upgrade to cleaner technology. However, under different assumptions regarding the cost structure, the results show that the productivity cut-off above which firms upgrade to a cleaner technology is lower than the productivity cut-off above which firms enter the foreign market. Nonetheless, the cut-off of clean technology remains higher than the one above which firms serve the domestic market without technology upgrading.
At the empirical level, Galdeano‐Gómez (Reference Galdeano‐Gómez2010) finds a 41 per cent differential of environmental productivity between exporters and non-exporters. Moreover, Cui et al. (Reference Cui, Lapan and Moschini2016) argue that the most productive firms – exporters – are more likely to bear the fixed investment cost of adopting a cleaner technology than non-exporting firms that eventually have lower levels of productivity. On the other hand, the positive relationship between productivity and environmental performance may also be attributed to the efficiency of the production of more productive firms that, by definition, manage to produce the same quantity of output while using less inputs than less productive ones, thus emitting less pollution (Cui et al., Reference Cui, Lapan and Moschini2016).
Nonetheless, studies examining the impact of firms’ environmental upgrading on their performance in the international market are scarcer and lack a comprehensive cross-country analysis. For instance, Antonietti and Marzucchi (Reference Antonietti and Marzucchi2014) show that, for Italian manufacturing firms, firms’ investments aiming at reducing the environmental impact of their production and the use of inputs are one of the sources of firm productivity heterogeneity, predicted by Melitz (Reference Melitz2003). Therefore, green investments can have a significant positive indirect effect on firms’ export performance at both the extensive margin and the intensive margin through productivity gains. Similarly, further empirical investigations of the food industry show evidence of the positive impact of environmental performance on the intensity of exports of the firms (Galdeano‐Gómez, Reference Galdeano‐Gómez2010).
Two studies are particularly related to our work. First, Siewers et al. (Reference Siewers, Martínez-Zarzoso and Baghdadi2024) explore the impact of GVC integration on the adoption of environmental measures. They show that firms that enter GVCs are more likely to adopt environment-friendly production technologies and use energy more efficiently. On the other hand, Paschoaleto and Martinez-Zarzoso (Reference Siewers, Martínez-Zarzoso and Baghdadi2024) analyse the impact of environment-friendly measures on the integration into GVCs at both the extensive and intensive margin levels. Our paper adds to their analysis in two ways. On the one hand, instead of aggregating all the environmental measures in one index, we analyse more detailed environmental actions following Dangelico and Pontrandolfo (Reference Dangelico and Pontrandolfo2015). Second, we explore the heterogeneity across different regions, the polluting intensity of sectors and firm size level.
Briefly, the reviewed literature shows that exporting firms tend to experience an environmental upgrading. However, the evidence on the positive effect of environmental performance on GVC integration has not been thoroughly studied. Therefore, this study contributes to the existing literature by assessing the impact of firms’ environmentally oriented investments on the likelihood of integrating into GVCs and on the intensity of GVC participation within a cross-country framework.
3. Data and stylized facts
The EBRD–EIB–WB (BEEPS)Footnote 3 serves as a comprehensive tool for analysing key business environment and firm performance indicators that are comparable across countries. The dataset encompasses a wide range of key firm characteristics, performance metrics and economic variables, including total annual sales, export and import volumes, and output. It focuses on firms with at least five full-time employees operating in non-agricultural businesses across manufacturing, construction, services and transport sectors.Footnote 4
In our analysis, we rely on the sixth round of the BEEPS (BEEPS VI), conducted between 2018 and 2020, to examine the environmental responsibility of firms and its economic implications for their performance (Nguyen and Vu, Reference Nguyen and Vu2024). The survey covers approximately 28,000 enterprises across 41 countriesFootnote 5 in four different regions, namely the European Union (EU), Eastern Europe, Central Asia, and the Middle East and North Africa (MENA). A key addition to BEEPS VI is the inclusion of a Green Economy module, which introduces questions on firms’ green investments and environmental initiatives. As this is the first BEEPS version to incorporate environmental responsibility measures, a panel analysis is not feasible, and the study is therefore limited to a cross-sectional analysis. The survey is conducted using stratified random sampling with three levels of stratification: industry, firm size and region. It is based on two sampling frames: one consisting of establishments provided by the national statistical office of each country and another comprising firms that had previously participated in Enterprise Surveys. Non-responses are carefully managed, and sampling weights are adjusted to account for ineligible units, ensuring the representativeness and reliability of the data.
GVC firms are distinguished by their involvement in the production and distribution of goods and services across different stages and locations around the world. Usually, they are highly specialized, focusing on a particular product or stage of the production process of the GVC in which they participate. The existing literature also deduces that GVC firms tend to be larger, more productive, foreign-owned and have internationally recognized quality certification (Cieślik et al., Reference Cieślik, Michałek and Szczygielski2019; Urata and Baek, Reference Urata and Baek2020). As was mentioned before, to define a GVC firm, we follow Dovis and Zaki (Reference Dovis and Zaki2020). The first definition (GVC 1) is the laxest one as it considers all two-way traders, hence firms simultaneously exporting and importing, as GVC firms. The second (GVC 2) includes two-way traders who hold an international quality certification, and the third (GVC 3) includes two-way traders with foreign ownership.Footnote 6 Finally, the strictest definition (GVC 4) entails exclusively two-way traders with foreign ownership who hold an international quality certification. While these variables measure GVC at the extensive margin, we follow Urata and Baek (Reference Urata and Baek2020) to measure GVC at the intensive level. The latter is computed as the share of the firm's exports multiplied by the share of its imported inputs.
Table A2 in the online appendix shows the distribution of GVC firms, according to each definition, across the different regions, highlighting that the EU stands out with the highest share of GVC firms. According to the strictest definition of GVC (GVC 4), only 2.5 per cent of all firms in the dataset qualify as GVC firms, revealing that most of the firms are domestic, with the highest share of domestic firms in Central Asia.
The data in this sample match the literature that argues that GVC firms tend to be large corporations rather than SMEs (Cieślik et al., Reference Cieślik, Michałek and Szczygielski2019; Urata and Baek, Reference Urata and Baek2020). Indeed, figure A1 in the online appendix shows that the share of GVC firms among the small-sized firms is only 13 per cent, and is the highest for the larger ones, as it reaches 40.3 per cent. In addition, figure A2 provides further evidence supporting this observation, as it demonstrates that larger firms exhibit greater involvement in GVCs at the intensive margin. This is reflected by their higher GVC participation scores.
GVCs are most prevalent in manufacturing industries. Indeed, manufacturing sectors such as machinery, equipment, electronics and vehicles, as well as textiles and garments, account for a significant proportion of firms engaged in GVCs. This trend is evident at both the extensive (figure A3) and intensive (figure A4) margins. This is in line with Rodrik (Reference Rodrik2018) who argues that high-tech and knowledge-intensive sectors rely heavily on GVCs. However, sectors such as construction and the wood products and furniture industry exhibit a relatively low share of GVC firms. Although a relatively small proportion of firms in the services sector participate in GVCs, those that do are highly engaged, as reflected by their high GVC participation scores.
When it comes to environmental and ecological measures, the evaluation of the firm's environmental performance is based on its engagement in different environmental actions, namely adopting an eco-friendly energy generation, energy management measures, any measures that enhance energy efficiency, air pollution control measures, water management measures or waste minimization, recycling and waste management measures. Figure A5 in the online appendix compares the average level of labour productivityFootnote 7 between firms that adopt one of these environmental actions and those that do not. Consistent with existing literature, firms engaged in environmental initiatives – excluding those implementing waste minimization measures – tend to exhibit higher average productivity levels compared to firms that do not adopt such measures (Delmas and Pekovic, Reference Delmas and Pekovic2013; Dangelico and Pontrandolfo, Reference Dangelico and Pontrandolfo2015).
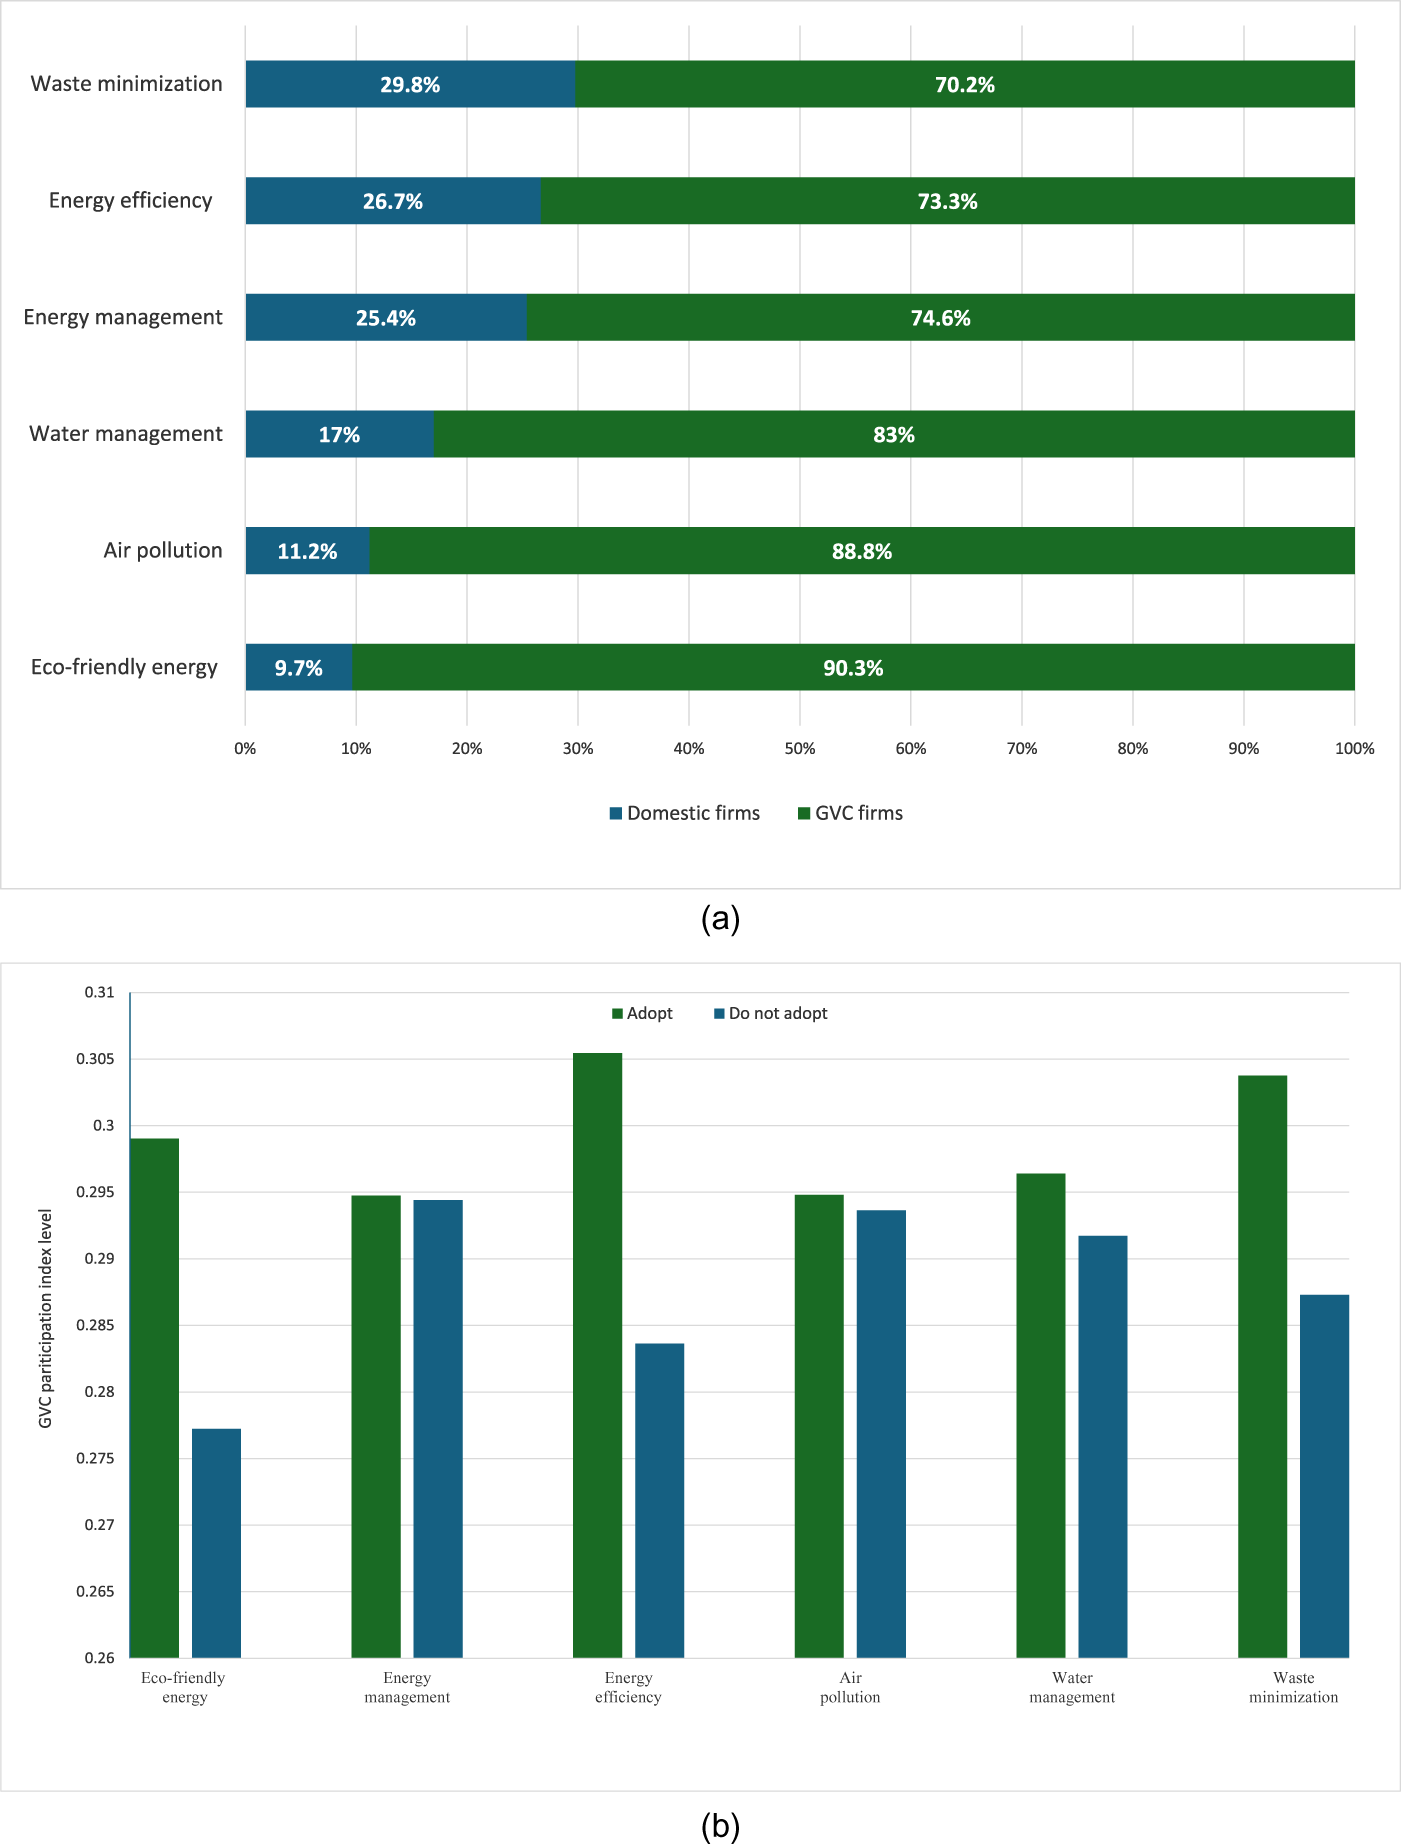
As environmental activities are associated with higher productivity levels, it is expected that firms that engage more in such actions are more productive and hence get access to the international market, as affirmed by Melitz (Reference Melitz2003). Accordingly, figure 1a illustrates that, among the firms adopting environmental actions, the proportion of those engaged in GVCs is higher than their domestic counterparts. Moreover, these environmentally engaged firms tend to exhibit a higher GVC participation score (figure 1b), reflecting a greater intensity of engagement compared to firms within GVCs that do not adopt environmental measures. This is in line with the literature that argues that GVC firms tend to have a higher environmental performance (Cui et al., Reference Cui, Lapan and Moschini2016). Therefore, environmental performance is positively correlated with both the probability of integration in GVCs and the intensity of GVC participation.
GVC and environmental measures. (a) Share of domestic versus GVC firms involved in environmental initiatives. (b) GVC participation index and adoption of environmental measures.

Figure 1 Long description
A showing a horizontal stacked bar chart with six categories on the vertical axis: Waste minimization, Energy efficiency, Energy management, Water management, Air pollution, Eco-friendly energy. The horizontal axis shows percent from 0 percent to 100 percent with tick marks at 0 percent, 10 percent, 20 percent, 30 percent, 40 percent, 50 percent, 60 percent, 70 percent, 80 percent, 90 percent, 100 percent. A legend lists Domestic firms and GVC firms. Values printed on the bars are: Waste minimization, Domestic firms 29.8 percent and GVC firms 70.2 percent. Energy efficiency, Domestic firms 26.7 percent and GVC firms 73.3 percent. Energy management, Domestic firms 25.4 percent and GVC firms 74.6 percent. Water management, Domestic firms 17 percent and GVC firms 83 percent. Air pollution, Domestic firms 11.2 percent and GVC firms 88.8 percent. Eco-friendly energy, Domestic firms 9.7 percent and GVC firms 90.3 percent. B showing a grouped vertical bar chart. The vertical axis label is GVC participation index level. The vertical axis ranges from 0.26 to 0.31 with tick marks at 0.26, 0.265, 0.27, 0.275, 0.28, 0.285, 0.29, 0.295, 0.3, 0.305, 0.31. The horizontal axis categories are Eco-friendly energy, Energy management, Energy efficiency, Air pollution, Water management, Waste minimization. A legend lists Adopt and Do not adopt. Bar heights by category: Eco-friendly energy, Adopt about 0.299 and Do not adopt about 0.277. Energy management, Adopt about 0.295 and Do not adopt about 0.295. Energy efficiency, Adopt about 0.306 and Do not adopt about 0.283. Air pollution, Adopt about 0.295 and Do not adopt about 0.294. Water management, Adopt about 0.297 and Do not adopt about 0.292. Waste minimization, Adopt about 0.304 and Do not adopt about 0.288.
In a nutshell, this descriptive analysis shows an interrelationship between firms’ environmentally oriented investments, their productivity levels, and both their potential involvement in GVCs and the intensity of such participation. This suggests that these measures enhance firm productivity, thereby improving their performance in international markets and affecting both the extensive and intensive margins of firms’ participation in GVCs.
4. Methodology
In this paper, we assess the impact of the firm's environmental performance on GVC integration at both the intensive and extensive levels. Thus, we rely on the theoretical framework of the heterogeneous firm model that accounts for the role of the heterogeneity of the firms’ characteristics in terms of their productivity levels, inputs, technology and other features in determining their behaviour in the international market (Melitz, Reference Melitz2003; Cieślik et al., Reference Cieślik, Michałek and Szczygielski2019).
We focus on two dependent variables. The first measures the likelihood for a firm to participate in a GVC (extensive margin), by a dummy variable that takes the value 1 if firm i in industry j of country c in year t is a part of a GVC and 0 otherwise. The second one measures the degree of participation (intensive margin) of firm i in industry j of country c in year t in GVCs, using a GVC index that is computed for each firm, following Urata and Baek (Reference Urata and Baek2020), as:
 \begin{equation}GVC{\text{ }}Index = {\text{ }}\left(\frac{{Exports}}{{Total{\text{ }}Sales}}\right)*\left( {\frac{{Imported{\text{ }}inputs}}{{Total{\text{ }}procurements}}{\text{ }}} \right)\end{equation}
The specifications of the empirical model are defined based on the existing literature on the fundamental firm-level determinants of integration in GVCs (Cieślik et al., Reference Cieślik, Michałek and Szczygielski2019; Dovis and Zaki, Reference Dovis and Zaki2020; Urata and Baek, Reference Urata and Baek2020; Fernandes et al., Reference Fernandes, Kee and Winkler2022) as follows:
 \begin{equation}GV{C_{i,j,c,t}} = {\beta _0} + {\beta _{1{\text{ }}}}{X_{i,j,c,t}} + {\beta _2}E{P_{i,j,c,t}} + {\delta _j} + {\delta _c} + {\delta _t} + \varepsilon ,\end{equation}
where 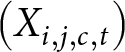 $\left( {{X_{i,j,c,t}}} \right)$ is a vector of control variables that includes firms’ characteristics that affect the firms’ participation in GVCs, such as firm size, firm age and the share of government ownership.Footnote 8 The firm size is captured by dummy variables, which subdivide firms into three categories, namely small size (firms with 5–20 employees), medium size (firms with 20–99 employees) and large size (firms with more than 99 employees). The firm age is calculated by taking the natural logarithm of the difference between the year when the survey was conducted for the firm and the year in which the firm started its operations. The government ownership is included as the natural logarithm of the share of capital owned by the government.
 ${\delta _j}$,
 ${\delta _c}$ and
 ${\delta _t}$ represent industry, country and year fixed effects, respectively, and
 $\varepsilon $ is an error term.
The main variable of interest 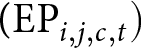 ${\text{(E}}{{\text{P}}_{i,j,c,t}})$ measures the firm's environmental performance through a vector of six dummy variables, each representing an environmental action that takes the value 1 if the firm is adopting this action and 0 otherwise. Environmental actions are divided into three dimensions, following Dangelico and Pontrandolfo (Reference Dangelico and Pontrandolfo2015). First, environmental actions related to raw material usage include the adoption of waste minimization, recycling and waste management, and the adoption of water management. Secondly, actions related to energy usage include the adoption of more climate-friendly energy generation on-site, the adoption of energy management and the adoption of any measures to enhance energy efficiency. Finally, actions related to pollution are represented by the adoption of air pollution control measures.
Yet, equation (2) is subject to a selection bias given that firms are not observed at the intensive margin level of GVC unless they are already observed at the extensive margin. This is why we adopt a two-stage Heckman selection model. The first stage is estimated to define the determinants of integration into GVCs, while the second stage determines the variables that affect the intensity of participation in GVCs. Following Melitz (Reference Melitz2003), our selection variable is labour productivity. It is computed as the ratio of total sales to total employment by firm.Footnote 9 The rationale is as follows. Firms produce at varying levels of productivity after entry and must contend with fixed production costs in addition to sunk entry costs, which results in increasing returns to scale of production. Since a firm joins export markets if and only if the net revenues from its exports in a particular nation are enough to cover the fixed export costs, the decision to export only happens after the firms observe their productivity. Thus, the latter determines the likelihood of exporting (and thus of integrating into GVCs) more than its intensity.
Second, the regressions suffer from a potential endogeneity because of the presence of reverse causality between participation in GVCs and firms’ environmental performance, as proven by the literature. Indeed, exporters are more likely to adopt green investments than non-exporters (Cui et al., Reference Cui, Lapan and Moschini2016). Thus, it would be more appropriate to interpret the estimated results as correlations between environmental performance and GVC integration. Moreover, the absence of a panel dimension in the data does not allow us to control for firm fixed effects (Urata and Baek, Reference Urata and Baek2020). However, to address this issue, a shift-share instrument is used. Thus, the firm's environmental performance is instrumented by the shift-share instrument, which is computed as the industry-country-year average (calculated for all firms of a certain country in a specific industry and for the same year) minus the firm's own response (Dovis and Zaki, Reference Dovis and Zaki2020). Table A3 in the online appendix confirms that the variables are endogenous based on the tests of Durbin and Wu–Hausman as we reject the null of exogeneity. In addition, the first stage results show that our instruments are positive and significant, with an F statistic that is also significant.
Therefore, we adopt the Heckman-2SLS approach, which is commonly used to address endogeneity problems in cross-sectional data. The advantage of the Heckman-2SLS model is that it allows for correction of both sample selection bias and endogeneity bias by combining the Heckman selection model as the first stage and the 2SLS regression as the second stage (Liu et al., Reference Liu, Shao, De Sisto and Li2021). In other words, it consists of estimating a first-stage Probit model that examines the likelihood of integrating into a GVC, including the shift-share instrument and the selection variable (labour productivity). Then, from this Probit regression, the probability of sample selection (inverse mills ratio (IMR)) is predicted. Finally, a 2SLS regression is carried out in the second stage, while incorporating the probability of selection (IMR) as an additional variable to account for the selection bias and instrumenting the endogenous explanatory variable by the shift-share instrument to control the endogeneity bias.
Our analysis is extended in four ways. First, we show how environmental measures matter for deeper levels of GVC integration. Thus, we explore the other definitions of GVC that go beyond the two-way traders by incorporating international certification (GVC 2), foreign ownership (GVC 3) and the four criteria together (GVC 4). Second, we examine the heterogeneity stemming from firm size. This will help us examine the potential differences in the impact of green investments on the likelihood of integrating into GVCs between small, medium and large firms that have different capabilities, resources and constraints. Clearly, small firms are expected to be in a worse position when it comes to GVC integration and adoption of green investments. Third, at the sectoral level, following Harris et al. (Reference Harris, Kónya and Mátyás2002), we distinguish between dirty and non-dirty sectors based on the carbon content.Footnote 10 This will help us examine whether non-dirty sectors are more likely to adopt such environment-friendly measures and thus able to better integrate into GVCs. Finally, given that different regions have different environmental performance and different levels of environmental stringency, we explore the heterogeneity at the regional level. Our data include four regions: EU, Eastern Europe, Asia and MENA. While the first two regions have a higher environmental performance, the second two (Asia and MENA) have mainly a comparative advantage in polluting sectors such as oil, chemicals and machinery. Hence, Asia and MENA are less likely to invest in green measures compared to firms located in the EU and Eastern Europe. It is important to note that all these regressions are run with the Heckman-2SLS estimation method.
5. Empirical findings
The first subsection reports the results of the first definition of GVC for firms that are two-way traders (directly or indirectly exporting and importing). Table 1 presents the results of the baseline and those controlling for the endogeneity between GVC integration and environmental measures. Tables 2–5 in section 5.2 present some extensions. Table 2 displays the results of deeper levels of GVC integration. Table 3 addresses the heterogeneity of this impact on firms of various sizes. Lastly, while table 4 examines the heterogeneity at the sectoral level, table 5 focuses on regional disparities.
Heckman selection model, baseline and 2SLS for GVC and environmental measures

Table 1 Long description
Coefficients and standard errors are reported for six environmental measures across two model types, Heckman baseline and Heckman 2SLS, each with columns for Prob (GVC) and GVC index. For Eco-friendly energy creation, coefficients are 0.317 with standard error 0.0294 and 0.121 with 0.0311 in Heckman baseline, and 0.825 with 0.199 and 1.593 with 0.557 in Heckman 2SLS. For Energy management, coefficients are 0.302 with 0.0225 and 0.134 with 0.0277 in Heckman baseline, and 0.904 with 0.142 and 3.302 with 1.907 in Heckman 2SLS. For Waste minimization, coefficients are 0.334 with 0.0219 and 0.143 with 0.0287 in Heckman baseline, and 1.148 with 0.135 and 2.190 with 0.898 in Heckman 2SLS. For Air pollution, coefficients are 0.329 with 0.0281 and 0.133 with 0.0291 in Heckman baseline, and 1.200 with 0.186 and 2.538 with 1.052 in Heckman 2SLS. For Water management, coefficients are 0.266 with 0.0257 and 0.125 with 0.0267 in Heckman baseline, and 0.558 with 0.165 and 0.920 with 0.330 in Heckman 2SLS. For Energy efficiency, coefficients are 0.301 with 0.0224 and 0.115 with 0.0278 in Heckman baseline, and 0.340 with 0.147 and 1.231 with 0.388 in Heckman 2SLS.
Notes: (1) Standard errors are in parentheses. (2) A constant term, control variables and year, size, country and sector fixed effects are included. (3) For the instrumental variable, the environmental measures are instrumented using a shift share instrument. (4) For the Heckman model, the selection variable is labour production. (5) Each line represents a regression using the Heckman-2SLS model, where Prob (GVC) is the first stage and GVC index is the second one.
5.1. GVC and environmental performance
First, the baseline model results (see table 1 and table A5 in the online appendix) display the fundamental determinants of integration into GVCs (extensive margin) and the firms’ key characteristics that affect the intensity of GVC participation. Despite this, the firm's age exerts a significant positive effect on the extensive margin as expected, but its coefficient becomes insignificant for the intensive margin (GVC Index). This result is in line with previous studies in the literature that show that older firms are more likely than younger ones to integrate into GVCs owing to their experience. Government ownership has a negative and significant impact on the two margins of GVC. Labour productivity, being our selection variable in the two-stage Heckman model, is positive and significant, pointing out that higher productivity increases the likelihood of integrating into GVCs. Productivity is positively associated with an increased participation in global markets (Melitz, Reference Melitz2003). Second, regarding our variables of interest, namely firm's environmental performance, we regress environmental action variables individually given their potential collinearity.
The results in table 1 highlight that the improvement in the environmental performance of the firm, illustrated by the adoption of an environmental action, increases the probability of its integration in GVCs (extensive margin) and the intensity (intensive margin) of its participation, with a higher impact on the former compared to the latter. For instance, investing in eco-friendly energy creation measures increases the GVC index by 0.12 units and the GVC likelihood by 7.6 per cent.Footnote 11 Notably, adopting measures that tend to reduce the emitted air pollutants by the firm has the highest impact. The results apply to the adoption of an energy management plan, waste minimization, reduction of air pollution, water management and energy efficiency measures. The results of waste minimization are particularly important as they help reduce the amount of materials that are used in the production of goods and services, which leads to a decline in waste generated and thus less energy is required to process the waste. Moreover, energy efficiency measures and management plans enhance production and capacity utilization, reduce resource use and pollution, and lower operation costs. For instance, the experience of Schneider Electric sites that adopted the Superior Energy Performance Program experienced an increase in energy savings of 7.5 per cent compared to 3.2 per cent before certification (IEA, 2018).
This finding is in line with the New-New Trade literature, as environmental performance is expected to affect the integration in GVCs through the channel of productivity given that firms adopting cleaner technologies tend to experience productivity gains (Girma et al., Reference Girma, Hanley and Tintelnot2008; Delmas and Pekovic, Reference Delmas and Pekovic2013). The heterogeneous firm model emphasizes the role of the firm's level of productivity in determining its participation in the international market, thus in GVCs (Melitz, Reference Melitz2003; Cieślik et al., Reference Cieślik, Michałek and Szczygielski2019). Therefore, investments in cleaner production technologies could be considered an additional source of fixed costs and thus of firm heterogeneity. These costs include the adoption of green investments that require the reshaping of the production organization; training employees to adapt to these new technologies; reducing waste and pollution; and adopting new business models and strategies to align with the environmental goals (Hart and Ahuja, Reference Hart and Ahuja1996).
In addition, the GVC firms’ engagement in environmental activities has an impact on the intensity of their participation in GVCs (intensive margin), but to a lesser extent. These results are in line with the existing literature, which argues that environmental performance affects the firm's export performance at both the extensive and intensive margins (Galdeano‐Gómez, Reference Galdeano‐Gómez2010; Antonietti and Marzucchi, Reference Antonietti and Marzucchi2014). Finally, it is also worth noting that the benefits of green investments may not be realized immediately, as it may take time to achieve the expected productivity gains and cost savings (Elsayed and Paton, Reference Elsayed and Paton2005).
Nevertheless, it should be recalled that these estimates might be biased due to the two-way causality problem, given that firms that are part of GVCs (and thus more exposed to international competition) might be more likely to adopt such environmental measures. This is why the final stage of our analysis comprises treating the problem of endogeneity and selection bias simultaneously, by estimating a Heckman-2SLS model with shift-share instruments. The results shown in table 1 are also in line with the previous conclusions, showing a positive and significant impact of environmentally oriented investments on the likelihood of integrating into a GVC and on the intensity of participation in GVCs, albeit with higher coefficients. For instance, investing in eco-friendly energy creation measures increases the GVC index by 1.6 units and the GVC likelihood by 22 per cent. Thus, not controlling for the endogeneity between the two variables underestimates the impact of environmental measures on GVC integration (at both margins). Our analysis yields a higher impact of environmental measures on GVC integration compared to Paschoaleto and Martínez-Zarzoso (Reference Paschoaleto and Martínez-Zarzoso2024) who find that environmental measures increase 6.4 percentage points. Table A3 in the online appendix confirms that the shift share instruments are positive and significant, showing that they are correlated with the endogenous variable. In addition, the F test of the first stage is significant at conventional levels, and the majority pass the test of Stock and Yogo (Reference Stock and Yogo2005) at conventional significance levels (as the instrument for energy management has a significant but low F statistic).
It is important to note that different measures have a heterogeneous effect on GVC integration. At the extensive margin level, and in a descending order, air pollution, followed by waste minimization and then energy management, yields the highest impact on GVC integration. At the intensive margin level, the ranking is slightly different as energy management ranks first, followed by air pollution and then waste minimization. This is in line with the literature showing that air pollution measures are the most efficient in reducing CO2 emissions, which helps firms abide by environmental rules. In addition, waste minimization is cost-effective. One of the important examples in this regard is the Alliance for Clean Air, which is a coalition of business leaders aiming at measuring and reducing value chain air pollutant emissions. They created a guide on how to measure and curb air pollution across the whole value chain (Stockholm Environment Institute and Climate and Clean Air Coalition, 2022).
5.2. Extensions
Traditionally, GVC firms have been measured as those that are two-way traders. However, deeper levels of GVC can be proxied by incorporating the share of foreign capital or the possession of an internationally recognized quality certification. Table 2 presents the impact of different environmental measures on various measures of GVCs. Three main remarks are worth mentioning. First, the deeper the definition, the more likely environmental measures matter for the extensive margin only, not the intensive one. Indeed, while the intensive margin is affected in the case of GVC 2, it is not affected for GVC 3 or GVC 4. This confirms the fact that the environmental measures are generally associated with a fixed cost for deeper levels of GVC integration. Second, the only measure that remains significant for both the extensive and intensive margins is energy efficiency, pointing out that this measure can be perceived as both a fixed and a variable cost for GVC integration at different levels. Finally, adopting measures that tend to reduce the emitted air pollutants by the firm has the highest impact for GVC 2 and GVC 3 (similar to GVC 1). For GVC 4, the highest coefficient is associated with energy management measures. As previously mentioned, the fixed cost related to these measures is high. Only the most productive firms possess the capacity to invest, enabling them to integrate into GVCs at the extensive margin level.
Heckman selection model 2SLS, GVC and environmental measures, alternative definitions
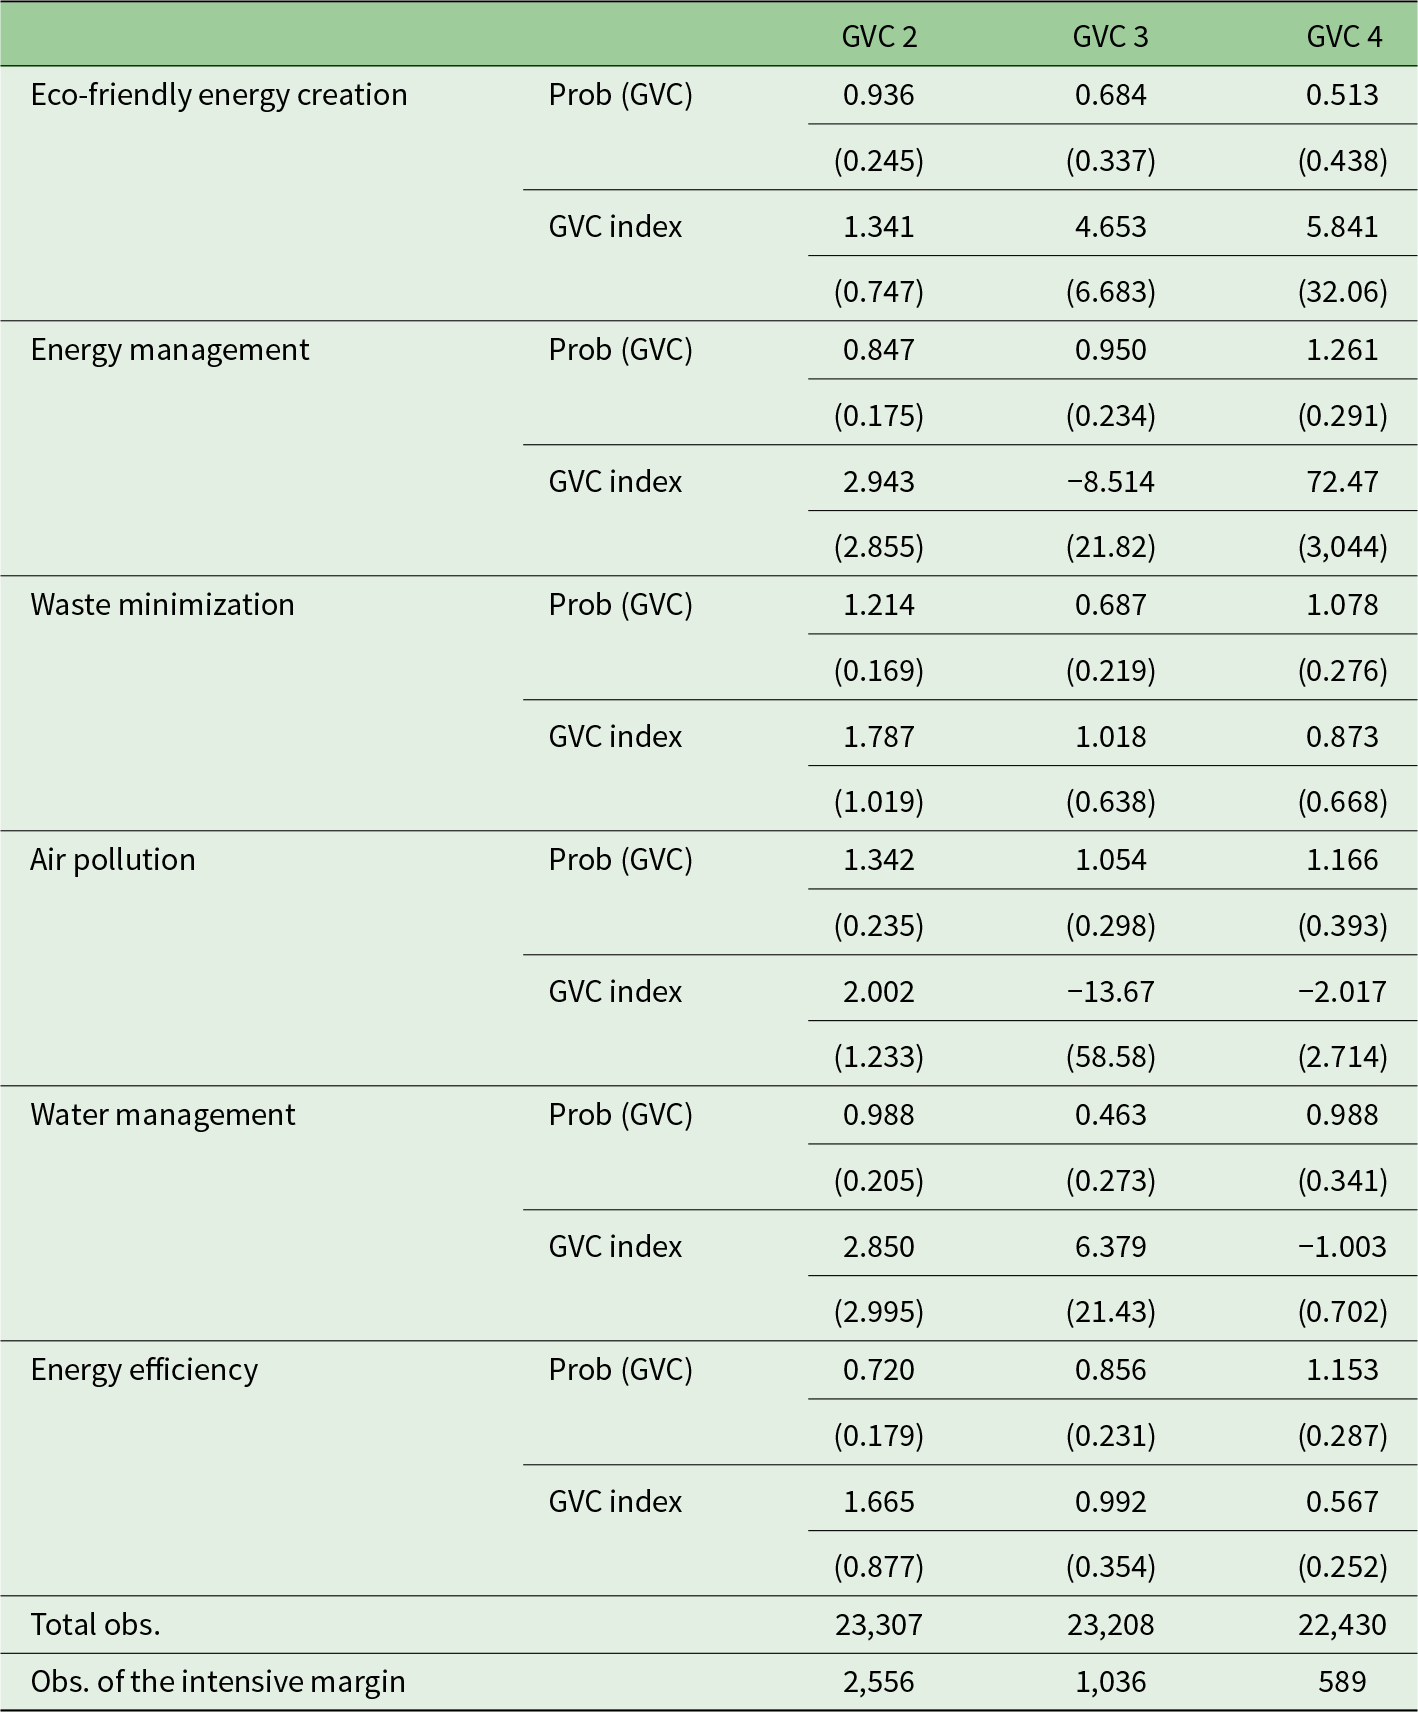
Table 2 Long description
Coefficients are reported for six environmental measures across three columns labeled GVC 2, GVC 3, and GVC 4, with two outcomes per measure: Prob (GVC) and GVC index; standard errors appear in parentheses on the line below each coefficient. For Eco-friendly energy creation, Prob (GVC) is 0.936, 0.684, and 0.513, and GVC index is 1.341, 4.653, and 5.841. For Energy management, Prob (GVC) is 0.847, 0.950, and 1.261, and GVC index is 2.943, minus 8.514, and 72.47. For Waste minimization, Prob (GVC) is 1.214, 0.687, and 1.078, and GVC index is 1.787, 1.018, and 0.873. For Air pollution, Prob (GVC) is 1.342, 1.054, and 1.166, and GVC index is 2.002, minus 13.67, and minus 2.017. For Water management, Prob (GVC) is 0.988, 0.463, and 0.988, and GVC index is 2.850, 6.379, and minus 1.003. For Energy efficiency, Prob (GVC) is 0.720, 0.856, and 1.153, and GVC index is 1.665, 0.992, and 0.567. Total obs. are 23,307 for GVC 2, 23,208 for GVC 3, and 22,430 for GVC 4; Obs. of the intensive margin are 2,556, 1,036, and 589.
Notes: (1) Standard errors are in parentheses. (2) A constant term, control variables and year, size, country and sector fixed effects are included. (3) For the instrumental variable, the environmental measures are instrumented using a shift share instrument. (4) For the Heckman model, the selection variable is labour production. (5) Each line represents a regression using the Heckman-2SLS model, where Prob (GVC) is the first stage and GVC index is the second one.
The effects of adopting environmental measures are heterogeneous given that countries, sectors and firms are affected in varying ways. In all the following regressions, we interact the environmental measures with each dimension and introduce all the categories (of this dimension) in the regressions.Footnote 12 Table 3 shows that the impact of the firm's environmental performance on the likelihood of integrating into GVCs is conditional on the firm's size. Indeed, when the firm's size is interacted with environmental performance variables, the highest positive and most significant coefficients are associated with larger firms followed by medium firms. Conversely, the interaction variables with small firms are either insignificant or negative. This suggests that larger firms are more likely to experience an international upgrading, regarding their participation in GVCs, through the adoption of green investments, compared to their smaller counterparts. This could be because SMEs face resource constraints and limited access to financing, which makes it challenging for them to invest in new clean technologies. In addition, they may also struggle to attract skilled labour due to their inability to offer competitive wages, which may stifle the productivity gains attained through such investments (Urata and Baek, Reference Urata and Baek2020). The literature has indeed shown that larger firms (that are more productive) are more likely to incur high fixed costs that could potentially include the cost of adopting such measures.
Heckman selection model 2SLS, GVC and environmental measures, by size

Table 3 Long description
Columns report coefficients for Small times Measure, Medium times Measure, and Large times Measure, each shown for Prob (GVC) and for GVC index, with standard errors in parentheses. For eco friendly energy creation, Prob (GVC) is minus 0.790 with standard error 0.219 for small, 1.362 with 0.218 for medium, and 3.833 with 0.230 for large; GVC index is 1.587 with 1.197 for small, 3.127 with 1.349 for medium, and 3.161 with 1.145 for large. For energy management, Prob (GVC) is minus 0.0957 with 0.149 for small, 1.127 with 0.146 for medium, and 2.333 with 0.147 for large; GVC index is 5.595 with 5.187 for small, 5.943 with 5.123 for medium, and 5.454 with 4.462 for large. For waste minimization, Prob (GVC) is 0.357 with 0.139 for small, 1.322 with 0.138 for medium, and 2.330 with 0.139 for large; GVC index is 2.816 with 1.798 for small, 3.271 with 1.897 for medium, and 3.504 with 1.895 for large. For air pollution, Prob (GVC) is minus 0.443 with 0.205 for small, 1.740 with 0.200 for medium, and 3.857 with 0.207 for large; GVC index is 3.038 with 1.817 for small, 3.935 with 1.913 for medium, and 3.329 with 1.473 for large. For water management, Prob (GVC) is minus 0.704 with 0.181 for small, 0.895 with 0.176 for medium, and 2.429 with 0.176 for large; GVC index is 0.991 with 0.630 for small, 1.653 with 0.478 for medium, and 1.679 with 0.358 for large. For energy efficiency, Prob (GVC) is minus 0.593 with 0.154 for small, 0.560 with 0.151 for medium, and 1.734 with 0.154 for large; GVC index is 1.314 with 0.696 for small, 1.832 with 0.639 for medium, and 2.151 with 0.623 for large.
Notes: (1) Standard errors are in parentheses. (2) A constant term, control variables and year, size, country and sector fixed effects are included. (3) For the instrumental variable, the environmental measures are instrumented using a shift share instrument. (4) For the Heckman model, the selection variable is labour production. (5) Each line represents a regression using the Heckman-2SLS model, where Prob (GVC) is the first stage and GVC index is the second one.
Another important source of heterogeneity is the sector in which the firm operates. Indeed, some sectors are more carbon intensive and therefore might have less incentive to adopt such environmentally friendly measures. Table 4 shows the results where a dirty (and a non-dirty) dummy variable is interacted with different measures. Two findings are worth mentioning. First, all sectors that adopt such environment-friendly measures are more likely to integrate into GVCs relative to those that do not. This confirms the previous results where green investments help firms better integrate into the global economy. However, the effect is stronger for non-dirty sectors, as is shown in all the regressions below. Second, while the effect on the intensive margin is stronger than that on the extensive one, the latter is always more statistically significant at 1 per cent. Again, whereas the green investments effect matters for the intensity of integrating into GVCs, it is more robust for the extensive margin one. It is important to note that dirty sectors include non-metallic mineral products, fabricated metal, rubber and plastics, construction, chemicals and petroleum products, among others.
Heckman selection model 2SLS, GVC and environmental measures, by sector

Table 4 Long description
Coefficients and standard errors are reported for two outcomes, Prob (GVC) and GVC index, under two columns, Dirty Measure and Non-dirty Measure, for six environmental measures. For Eco-friendly energy creation, Prob (GVC) is 0.920 with standard error 0.201 for Dirty Measure and 2.379 with standard error 0.173 for Non-dirty Measure; GVC index is 2.897 with standard error 1.565 and 3.732 with standard error 1.733. For Energy management, Prob (GVC) is 1.624 with standard error 0.122 and 2.233 with standard error 0.112; GVC index is 3.407 with standard error 1.624 and 4.014 with standard error 1.850. For Waste minimization, Prob (GVC) is 1.964 with standard error 0.110 and 2.407 with standard error 0.101; GVC index is 4.560 with standard error 2.754 and 5.029 with standard error 2.971. For Air pollution, Prob (GVC) is 2.376 with standard error 0.177 and 2.991 with standard error 0.135; GVC index is 3.041 with standard error 1.336 and 3.525 with standard error 1.433. For Water management, Prob (GVC) is 0.963 with standard error 0.133 and 1.894 with standard error 0.129; GVC index is 0.970 with standard error 0.235 and 1.581 with standard error 0.304. For Energy efficiency, Prob (GVC) is 0.993 with standard error 0.132 and 1.692 with standard error 0.122; GVC index is 1.702 with standard error 0.487 and 2.108 with standard error 0.553.
Notes: (1) Standard errors are in parentheses. (2) A constant term, control variables and year, size, country and sector fixed effects are included. (3) For the instrumental variable, the environmental measures are instrumented using a shift share instrument. (4) For the Heckman model, the selection variable is labour production. (5) Each line represents a regression using the Heckman-2SLS model, where Prob (GVC) is the first stage and GVC index is the second one.
Given that developing countries are often perceived as ‘pollution havens’ (Khan and Ozturk, Reference Khan and Ozturk2021) and typically hold a comparative advantage in carbon-intensive products, their firms will have to bear a higher fixed cost to integrate into GVCs and abide by new rules such as the Carbon Border Adjustment Mechanism. The latter is being implemented by the EU to reduce the incentives for firms to outsource their carbon emissions, targeting industries such as iron and steel, aluminium, fertilizers, cement, electricity and hydrogen. Consequently, these developments are poised to significantly affect the trade dynamics of developing countries and their integration into GVCs (Magacho et al., Reference Magacho, Espagne and Godin2024).
Based on the previous analysis, it is key to take the regional dimension into account. Indeed, adopting such environment-friendly measures will depend on the ability of firms to bear this fixed cost that clearly depends on productivity, research and development, government incentives and the stringency of environmental regulations in the country. Figure A6 in the online appendix confirms the heterogeneity of environmental treaties and regulations that exist in each region, with most developing regions (South Asia, MENA, sub-Saharan Africa and Latin America) consistently having lower standards than those in developed ones (Europe and Central Asia). Table 5 explores those heterogeneities and confirms this observation as most of the interaction variables with regional dummies are the highest for the EU and Eastern Europe followed by MENA and Asia (apart from eco-friendly energy creation measures). Moreover, in several cases, the interaction with MENA and Asia turns out to be insignificant, especially in the case of water management and energy efficiency for both extensive and intensive margins. Finally, the effect on the extensive margin is always more robust and more significant than on the intensive one.
Heckman selection model 2SLS, GVC and environmental measures, by region

Table 5 Long description
Regression coefficients are reported for six environmental measures, with two outcomes per measure: Prob, (GVC) and GVC index, shown for MENA, EU, Asia, and Eastern Europe, with standard errors in parentheses. For eco friendly energy creation, Prob, (GVC) is 2.300 in MENA, 0.457 in the EU, 1.716 in Asia, and 1.369 in Eastern Europe; GVC index is minus 3.757 in MENA, 0.851 in the EU, minus 0.350 in Asia, and 3.620 in Eastern Europe. For energy management, Prob, (GVC) is 0.615 in MENA, 1.074 in the EU, 0.516 in Asia, and 1.006 in Eastern Europe; GVC index is 0.761 in MENA, 1.969 in the EU, minus 0.240 in Asia, and 1.673 in Eastern Europe. For waste minimization, Prob, (GVC) is 0.550 in MENA, 1.672 in the EU, 0.295 in Asia, and 1.103 in Eastern Europe; GVC index is 0.579 in MENA, 2.195 in the EU, 4.100 in Asia, and 0.0494 in Eastern Europe. For air pollution, Prob, (GVC) is 1.428 in MENA, 1.635 in the EU, minus 0.219 in Asia, and 1.296 in Eastern Europe; GVC index is 2.667 in MENA, 2.534 in the EU, 0.513 in Asia, and 3.288 in Eastern Europe. For water management, Prob, (GVC) is 0.196 in MENA, 0.767 in the EU, 0.0228 in Asia, and 0.789 in Eastern Europe; GVC index is 0.208 in MENA, 1.022 in the EU, minus 0.256 in Asia, and 1.766 in Eastern Europe. For energy efficiency, Prob, (GVC) is 0.281 in MENA, 0.125 in the EU, 0.256 in Asia, and 1.029 in Eastern Europe; GVC index is 2.168 in MENA, 1.840 in the EU, 1.221 in Asia, and 5.809 in Eastern Europe.
Notes: (1) Standard errors are in parentheses. (2) A constant term, control variables and year, size, country and sector fixed effects are included. (3) For the instrumental variable, the environmental measures are instrumented using a shift share instrument. (4) For the Heckman model, the selection variable is labour production. (5) Each line represents a regression using the Heckman-2SLS model, where Prob(GVC) is the first stage and GVC index is the second one.
In sum, the results reported earlier show that firms that pursue environmental upgrading by adopting new measures to control their environmental impact experience performance upgrading reflected by a higher likelihood of integrating into GVCs and higher intensity of participation for GVC firms owing to productivity gains. However, this effect tends to be relatively higher for large firms compared to SMEs. This effect is also stronger in the EU and Eastern European countries and in non-dirty sectors. Overall, the consistency of the results across different models and definitions provides stronger evidence in support of the relationship between environmental performance and GVC integration.
6. Conclusion and policy implications
The paper assesses the impact of firms’ adoption of environmental protection actions on the likelihood of integrating into GVCs (extensive margin) and the degree of GVC participation (intensive margin), using a Heckman-2SLS model and firm-level data from BEEPS. The main findings of the paper suggest that the adoption of environmental protection actions boosts the firm's opportunity to integrate into GVCs owing to productivity gains. Less robust results are observed for the intensity of participation of GVC firms. Therefore, investments in cleaner production technologies could be considered more as a fixed cost through their effect on the extensive margin of GVCs and to a lesser extent a variable cost through their effect on the intensive margin of GVCs. Measures reducing air pollution followed by waste minimization techniques and energy management tools yield the highest impact at both margins. When firm size is taken into account, large firms are more likely to benefit from investing in environmental activities rather than medium and small firms, which struggle to get access to financing resources and skilled labour. The latter finding is crucial for the elaboration of tailored recommendations suitable for the specific needs of different firms to promote their successful integration into GVCs and to reach the net zero emissions target. More heterogeneities are observed at the regional and sectoral levels, as non-dirty sectors are more likely to experience a strong positive impact of environmentally friendly measures compared to dirty ones. Moreover, firms in the EU or Eastern European countries are more likely to benefit from these measures.
From a policy perspective, major and significant environmental challenges have forced the elaboration of multiple national and international environmental policies and regulations, although few significant positive outcomes have been achieved in terms of sustainable development. Therefore, this study provides evidence on the implications of firms’ adoption of environmental policies to improve both the likelihood and the intensity of GVC integration. Governments need to provide incentives for firms to comply with environmental regulations, given that the adoption of clean technologies is usually associated with significant costs and requires the reshaping of the production organization. At the macroeconomic level, this can take place through adequate public investments, notably in green infrastructure that raises the firms’ private benefits, and through technical and financial support to firms investing in sustainable practices. As predicted by Porter and van der Linde (Reference Porter and van der Linde1995), the elaboration of well-designed environmental regulations should result in productivity gains owing to the firms’ investments in clean and innovative technologies, which may partially, and sometimes fully or more than fully, ‘offset’ the initial costs of complying with the regulations.
Nonetheless, it is important to note that the relationship between green investments and GVC intensity is complex and context-specific, given that there may be other factors that mediate this relationship. Indeed, upgrading within GVCs involves a complex combination of factors, including access to technology, skills and financing (Urata and Baek, Reference Urata and Baek2020). The adoption of green investments may not be a sufficient condition for upgrading within GVCs. In addition, the effect of green investments on the intensity of participation in GVCs may differ depending on the context and the characteristics of the GVC in which the firm is involved. For instance, Antonietti and Marzucchi (Reference Antonietti and Marzucchi2014) argue that the impact of such environmental upgrading on firms’ performance in the international market tends to be higher for firms that export to markets with stricter environmental regulations.
Supplementary material
The supplementary material for this article can be found at https://doi.org/10.1017/S1355770X25100193.
Funding statement
This paper is supported by the Chair of Environmental and Mineral Economics (CEME) funded by the BRGM and a research grant from the Agence Nationale de la Recherche at the Laboratoire d'Economie d'Orléans.
Competing interests
The authors declare none.