The October 7, 2003 California Recall Election strained California's direct democracy. In recent California politics there has not been a statewide election conducted on such short notice; county election officials were informed on July 24 that the election would be held on October 7. Nor has California recently seen a ballot with so many candidates running for a single statewide office (see Mueller 1970). Under easy ballot access requirements, Secretary of State Kevin Shelley certified 135 candidates for the official ballot on August 13.1
The California Election Code was oddly silent on the exact ballot access requirements for a statewide recall election. Secretary of State Shelley made the barriers quite low: candidates either had to provide 10,000 signatures of registered voters and no filing fee, or 65 signatures from registered voters and a $3,500 filing fee.
In the recall, voters cast votes on (1) whether to recall Governor Davis from office, and (2) his possible successor. These two voting decisions were made independent by the federal district court's decision on July 29. The court's decision invalidated a state law requiring a vote on the recall question in order for a vote on the successor election to be counted (Partnoy et al. 2003). The abbreviated election calendar also led to many improvisations, including a dramatically reduced number of precinct poll sites throughout the state and the unprecedented ability of military personnel, their dependents, and civilians living overseas to return their absentee ballots by fax. These problems produced litigation and speculation that substantial problems would mar the election and throw the outcome of both the recall and a possible successor's election into doubt. In the end, the litigation failed to stall the recall election, and the large final vote margins on both the recall question and the successor ballot seemingly overwhelmed Election Day problems.
In this paper, we concentrate on some of the problems produced by the complexity of the recall election, but we do not attempt an exhaustive presentation of these problems. We focus on polling place problems on election day, the problems associated with translating the complicated recall election ballot into six languages, how the long ballot influenced voter behavior, and voter difficulties with the ballot measured with survey data. We conclude with a short discussion of the possible impact of these problems on the recall election.
Precinct Practices
The recall process was complicated by a variety of logistical factors. Two issues—precinct consolidations and the problem of serving the language minority population—were most pronounced in Los Angeles County, the largest electoral jurisdiction in the United States. The consolidation issue was discussed prior to the election and spawned several lawsuits (Dolan and Guccione 2003). In a statewide election, local election officials are normally required by law to have one election precinct for approximately every 1,000 voters. Because the recall election was called on short notice and election officials were cash-strapped, polling places were consolidated to simplify the process of managing elections. For example, in Los Angeles County the number of precincts went from 4,922 in the 2002 general election to 1,786 in the recall election. Before the election, many observers predicted that consolidations would produce long lines, disgruntled voters, and mistakes by harassed precinct workers. County officials, however, hoped that bringing more voters to fewer locations could ensure that the precincts that they did use would open successfully and be properly staffed.2
In addition to working to make precinct voting work efficiently with fewer polling places, county election officials worked to expand early voting opportunities and to facilitate absentee voting. At least 28 of the 58 counties allowed early voting in the recall election.
The precinct consolidations confused many voters, even though, prior to the election, the County sent every voter a guide that included the street address of their poll site. Many voters went to the most convenient poll site and voted. Because the ballot was the same countywide, registered Los Angeles County voters could cast a legal ballot at any precinct in the county using the provisional balloting process. Over 100,000 provisional ballots were cast, more than have ever been cast in any election in Los Angeles County.
In other instances, the precinct consolidations generated confusion and long lines. Fifteen polling places in Los Angeles County failed to open on time, with the latest opening about an hour late. Two of us toured polling places throughout Los Angeles County on election day.3
Alvarez and Hall conducted all of the interviews discussed in this section.
In one voting location in downtown Los Angeles, the polling location was inside a closed electronic gate (with no directions on how to enter). Once inside the gate, the voter had to find a small elevator, proceed (confusingly, as the elevator appeared to be on the ground floor) down to the third floor, and from there find a poorly marked room to vote. In another voting location (inside a tire shop!), we witnessed a long line of voters waiting impatiently in the middle of the morning to vote; the poll workers had established an inefficient means of checking voter registrations (and it didn't help matters that instead of removing a malfunctioning vote recorder from service, a handful of polling place workers ignored the long line and proceeded to try to fix the one of perhaps a dozen vote recorders). Throughout the day, we saw examples of voters having difficulty understanding how to vote, questions arising about provisional balloting procedures, and polling places running out of provisional or regular ballots.
These sorts of problems were scattered, and not systematic. Although many voters were likely affected by polling place problems, it does not appear from any information currently available that these problems were of sufficient magnitude to call the recall election into doubt. However, there is no question that there were problems in polling places on October 7.
Multilingual Voting Problems
A second, largely ignored, issue arose with the ballot and the two-part nature of the recall election. Specifically, in the four Asian languages that Los Angeles County is required to serve under language minority provisions of the Voting Rights Act—Chinese, Japanese, Korean, and Vietnamese—it was very difficult to translate the recall question.
As Rosa Flores with the Los Angeles County Registrar-Recorder, County Clerk's Office explained, “There are words that do not translate into other languages exactly and ‘recall’ is one of them. Sometimes, because there are not exact words that exist, they sometimes make up a new word by using the English. Sometimes the insinuation does not translate, so the translators may have the word correct but the meaning isn't quite right.” This problem was clear in interviews with voters and pollworkers conducted in Chinatown and Koreatown (in downtown Los Angeles), though the extent of this problem is impossible to assess after the election. For example, an elderly Korean man repeatedly explained to us that he didn't understand how to vote on the two questions and that the Korean language newspapers did not adequately explain the meaning of the recall election.
A poll worker we interviewed in Chinatown noticed two interesting phenomena. First, the concept of the recall did not translate well. Many voters were confused about to how they could vote “No” on the recall but then vote for a replacement candidate. Second, many of these voters were less interested in the recall and more interested in defeating Proposition 54, which would ban the collection of information by race or ethnicity. This problem manifested itself in a high residual vote rate on the recall question in high immigrant population precincts (Hoffman 2003).
Other data implies that voter confusion about how to vote on the recall ballot's two questions extended beyond the multilingual community. In a telephone survey of California voters (which we discuss more completely below), conducted in the week prior to the election, we found that over 6% of the respondents who preferred Davis to all other candidates indicated that they favored the recall. Given there is no reasonable strategy that could justify such a choice, we think it is very likely that some voters believed that in order to vote for Davis, they needed to vote yes on the recall.
Ballot Design and “Vertical Proximity”
In the recall election, each county designed its own ballot and selected its voting machines—punch cards, optical scan, and touchscreen voting.4
In our analysis we exclude Alpine County (which used paper ballots), which provided 0.0067% of the votes cast and which does not provide a large enough sample to study their ballot format.
All ballots listed the candidates based on a random alphabetical ordering drawn by the secretary of state. In the first Assembly District, the names of candidates appeared on the ballot in the random alphabetical order, but in the second Assembly district the first candidate of the random alphabetical list moved to the last place and all other candidates moved up one position.
5 Empirical research on ballot design has documented a potential topof-the-ballot effect: a propensity for candidates appearing at the top of the ballot to receive, solely by nature of their position, more votes than other candidates. A standard practice to correct this problem is the rotation of the random alphabetical ordering. For recent research, see Jennifer A. Steen and Jonathan G. S. Koppell, forthcoming; Jon A. Krosnick, Joanne M. Miller, and Michael P. Tichy 2003.
This procedure was repeated for the remaining 78 Assembly districts. Regardless of exact position, the same two “neighbor” candidates determined by the randomized alphabet surround a name.
6 The only exceptions are the assembly districts in which the candidate's name is listed in the first position or in the 135th position. Even in these two districts, the candidate will be adjacent to one of his two neighbor candidates, while his other adjacent spot is empty.
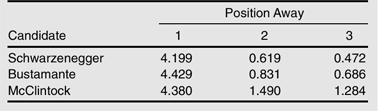
To examine the added benefit of proximity to a high vote-receiver, we compared the amount of votes neighboring candidates received as a function of how many positions they were away from a prominent candidate. Using county level election returns reported by the California secretary of state, we constructed the relative amount of votes by summing the votes of the pair of candidates who were +i, −i positions away from the top candidate and dividing the number of votes they received by the number of votes the top candidate received, per 1,000 voters. For example: (Votes for Lawrence Strauss + Votes for George Schwartzman) * 1,000/Votes for Arnold Schwarzenegger. This value was calculated for the neighboring candidates who were one, two, and three positions away from Schwarzenegger, Cruz Bustamante, and Tom McClintock, respectively.
Table 1 shows the additional votes per thousand that neighboring candidates received in relation to their position away from a top-three vote getter.
7 This value was also calculated for the fourth highest vote recipient, Camejo, but at this level the results are within the margin of error and are not statistically significant.
The consistency across candidates demonstrates that all neighbors benefit from the same effect. While their absolute votes vary, the increase in absolute votes is proportional to the votes their top-three neighbor candidates received. A simple model of this effect is that the number of votes a neighbor candidate receives is the sum of their base vote (defined as the average votes received by all non-top vote getters) plus an additional 0.004% of the votes received by the top votereceiving adjacent candidate. The ratio for candidates two and three positions away increases from Schwarzenegger to Bustamante to McClintock because the initial ratio of base vote to top candidate vote increases: (base vote/McClintock) > (base vote/Bustamante) > (base vote/Schwarzenegger), as the absolute vote of the top candidate decreases (McClintock < Bustamante < Schwarzenegger).
What is the causal mechanism producing the vertical proximity effect? One possible answer is voter alignment errors: voters see the name of the candidate they intend to vote for, but instead mark their ballot to cast a vote for one of the neighboring candidates.8
We do note that it is impossible, ex post facto, to definitively determine what kind of error was made, or even to distinguish errors from intentional votes for the neighbor candidate. However, we feel the statistical evidence is strong enough to warrant suspicion that these votes were not intentional.
Bad eyesight, shaky hands, or even left-handedness could cause voters to misalign their decision mark with their candidate choice.
9 We thank Professor Charles Stewart for suggesting these explanations. A left-handed voter must often position their hand in a way that covers the candidates' names, which frequently appear to the left of the box to be marked. Inability to see the candidate name and box at the same time may result in increased proximity error.
The other possible explanation for the proximity effect is voting machine problems. Punch card ballots may increase the chances of alignment errors, regardless of voter characteristics, because punch card ballots can be incorrectly inserted into the vote recorder. Many of the problems in the recount of the Florida presidential vote in 2000 focused on alignment errors in the format of the punch card ballots, for example, problems associated with the butterfly ballot.
10 For further discussion of the butterfly ballot, see Wand et al. 2001.
We estimated the differences in average vertical proximity effects across counties using punch cards, optically scanned ballots, or touchscreens. Punch card technologies showed vertical proximity effects that were almost two votes per 1,000 higher.
11 Regressing the relative benefit ratio used above on dummy variables for optical scan ballots and touch screen ballots gives coefficients of – (s.e. 0.324) and – (s.e. 0.538) respectively, with an adjusted R2 of 0.380. Since vote and ballot type data was reported in county units, this regression was weighted by the number of ballots.
Vertical alignment effects between optical scan and touchscreen technologies were not statistically distinguishable.
Vertical proximity effects suggest that ballot order is not neutral, even when randomized. There may be other problems with ballot design, such as top of the page effects or horizontal proximity effects. Although we have studied one fairly unique election with a restricted set of alignments, the appearance of clear vertical proximity effects and their variance across ballot types suggests that the randomization of names on the ballot in California is not neutral and the need remains for careful systematic evaluation of ballot designs. Although there are many possible explanations for this effect, it is likely caused by difficulties voters have aligning names with voting options and this effect apparently hampered the accurate re-flection of voter intention in the recall election.
Difficulties With Ballot Design and Voter Confidence
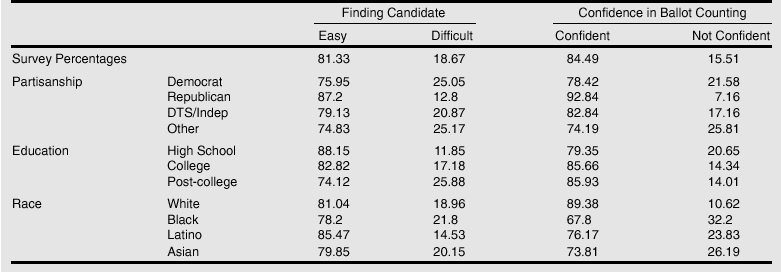
There is also evidence that this complicated election influenced voter perceptions. The Los Angeles Times exit poll, which interviewed 5,205 voters at 74 polling places statewide, included a question asking “How easy or difficult was it to locate your candidate on the ballot?” As the first two columns of Table 2 show, the vast majority of voters found it easy to locate their candidate on the ballot (81.33%), but some voters found it difficult (18.67%). Also, 4.59% stated it was “very difficult” to find their candidate on the ballot, and 13.57% said it was “somewhat difficult.” While 18.67% is a small percentage, we estimate that as many as 1.7 million of the 8.9 million voters statewide found it difficult to find their candidate on the ballot, with possibly 400,000 voters finding it “very difficult” to locate their candidate on the ballot.12
At the time we write this paper, the California secretary of state is reporting 8,958,369 total votes cast.
If we breakdown the responses to this exit poll question for three variables, partisanship, education, and race, we see that Republicans were approximately half as likely to report having troubles finding their candidate on the ballot. We also see a surprising pattern with respect to education: voters at the lower end of the educational spectrum were less likely (11.85% had difficulty) to express having trouble finding their candidate on the ballot than those with a post-college education (25.88% had difficulty). Last, we see that Latinos reported less difficulty finding their candidate on the ballot (14.53% reported difficulty), compared to the other major racial and ethnic groups.
In the last two columns of data in Table 2, we report results from a telephone survey of 1,457 registered voters conducted before the recall election.13
This telephone survey (N = 1500) was supervised by D. Roderick Kiewiet and R. Michael Alvarez. Interviewing was conducted by trained interviews from Interviewing Services of America. The first survey responses were collected on September 25, 2003, and the survey was completed on October 7, 2003. Details about the sample and the response rates are available from Kiewiet and Alvarez.
This survey asked respondents (who said they had already voted absentee or early, or that they planned to vote on election day), “How much confi-dence do you have that your vote in the current election will be recorded and counted correctly?” Despite all of the potential problems and the attention they received in the media, most voters (84.49% of the sample) felt confident that their ballots would be recorded and counted correctly. However, 15.51% lacked confidence, which implies that 1.4 million voters may have lacked confidence in the accurate recording and counting of their ballots. We also see in
Table 2 that the lack of confidence in the accurate recording and counting of ballots in the recall election was much lower among Republicans.
14 To clarify, the Los Angeles Times exit poll and our telephone survey differ in the measurement of partisanship. Exit poll voters provided their party registration (Democrat, Republican, Decline-to-state, or other). Our telephone survey asked voters “No matter how you are registered, do you usually think of yourself as a Democrat, a Republican, an Independent, or as something else?”
Furthermore, voters with a high school education or less were less confident that their vote would be counted than were those with higher levels of educational attainment. Finally, White voters were much more confident that their vote would be accurately recorded and counted: 10.62% of Whites were not confident, in contrast to 32.2% of Blacks, 26.19% of Asians, and 23.83% of Latinos.
Did These Complexities Influence the Outcome of the Recall Election?
A great deal of attention is now paid to election procedures and the myriad of problems that were identified in the wake of the 2000 presidential election. As has been pointed out frequently by many observers, nothing new really occurred in the 2000 presidential election. There was a very close election, one that hinged on the outcome in Florida, where a lack of sound procedures for recounting ballots, long lines in polling places, problems with voter registration lists, and the use of antiquated voting machines with high “residual vote rates” produced concerns about the accuracy of the election (and recount) result. These problems occurred throughout the nation in 2000, producing an estimated 4 to 6 million “lost” votes in the presidential race (of the total 105,405,100 votes cast) (Caltech/MIT Voting Technology Project 2001).
Were the same proportion of votes—somewhere between 3 to 5% of ballots cast—“lost” in the 2000 California recall election? Until the final certified results of the election are available, detailed statistical analyses of residual vote rates can be calculated, and other data on administrative issues in the recall election (in particular, the numbers of disqualified provisional and absentee ballots) are known, it is difficult to estimate a precise “lost” vote rate for the recall election. The preliminary analyses presented in this paper suggest that there are grounds for concern. We know that:
- the dramatic precinct consolidations in the recall election produced problems in polling places throughout the state;
- non-English speaking voters had difficulty understanding the complicated ballot;
- the design of the ballot, in particular the long list of candidate names, produced a “vertical proximity” effect that might have affected many votes cast;
- sizeable numbers of voters had difficulty finding their candidates on the ballot and lacked confidence that their ballots were accurately tabulated and counted.
More careful and detailed analyses are required for us to understand these issues clearly.
We thank Conny McCormack (Los Angeles County Registrar-Recorder) and Susan Pinkus (director of the Los Angeles Times Poll) for some of the data used in this paper. We also thank the California Institute of Technology and the Carnegie Corporation of New York for their support.