Introduction
Studies of socioeconomic status (SES) and race/ethnicity disparities in health in the United States have traditionally treated SES and demographic characteristics as independent, additive influences on health. However, the effects of SES and of demographic characteristics like race/ethnicity on health are not easily disentangled. The persistence of socioeconomic disadvantages among, for example, African-Americans, women and older adults suggests the possibility that the health characteristics they frequently share may be related to the effect of stratification forces that confound socioeconomic and demographic indicators, and not only from additive effects that arise from socioeconomic and demographic indicators independently.
Vast evidence points to the existence of an SES–health gradient in the United States and abroad. Individuals located in the lower tails of education and income distributions show elevated levels of morbidity and mortality (Adler et al., Reference Adler, Boyce, Chesney, Cohen, Folkman, Kahn and Syme1994; Pearlin et al., Reference Pearlin, Schieman, Fazio and Meersman2005; Clougherty et al., Reference Clougherty, Souza and Cullen2010; Bound et al., Reference Bound, Geronimus, Rodriguez and Waidmann2014, Reference Bound, Geronimus, Rodriguez and Waidmann2015). Research also indicates that low SES is more heavily concentrated in racial/ethnic minority communities, that there is similar confounding between older age and low SES, and likewise between being a female and low SES (Geronimus et al., Reference Geronimus, Hicken, Pearson, Seashols, Brown and Cruz2010; Williams et al., Reference Williams, Mohammed, Leavell and Collins2010). Additionally, the influences of SES on health risks such as cardiovascular disease, for example, appear to vary significantly by race, age and gender (Karlamangla et al., Reference Karlamangla, Merkin, Crimmins and Seeman2010; Kwarteng et al., Reference Kwarteng, Schulz, Mentz, Israel, Shanks and Perkins2016). Much research has found morbidity differences between females and males, mortality and health disparities between blacks and non-blacks, and higher co-morbidity among older adults (Black, Reference Black1982; Verbrugge, Reference Verbrugge1989; Lipowicz et al., Reference Lipowicz, Szklarska and Malina2013).
Although many analyses find that health outcomes coincide with socioeconomic and demographic subgroups, less attention has been devoted to analysing how socioeconomic and demographic indicators may segregate into selected typologies with respect to their impact on health outcomes. Establishing econo-demographic typologies associated with the distribution of health could refine and push forward current research on SES health gradients and suggest new ways to address health disparities.
Considerable research has looked at the ways race and SES combine to produce health outcomes in the US, especially among African-Americans and whites. The unique social, political and economic histories of African-Americans continue to shape individual and structural discrimination effects on their health. Their ‘migration’ experience was involuntary and their participation in the most decisive restructuring episodes of American history (i.e. the writing of the Declaration of Independence and the Constitution, and the Civil War) happened under the jurisdiction of the slavery system. Today’s African-Americans are the descendants of those who lived under slavery or who were socialized under the Jim Crow system (Sears et al., Reference Sears, Citrin and Van Laar1995; Sears & Savalei, Reference Sears and Savalei2006). And in spite of advancements prompted by the Civil Rights Movement, blacks continue to experience socioeconomic, legal and political disadvantages that manifest in detrimental biological expressions (Collins & Williams, Reference Collins and Williams1999).
The intersection between gender and SES has also been the focus of a large body of research. The role of gender, as a powerful principle for social organization, is well documented in social, economic and political histories (Crenshaw, Reference Crenshaw1991; Josephson & Tolleson-Rinehart, Reference Josephson and Tolleson-Rinehart2000; McCall, Reference McCall2005; Hancock, Reference Hancock2007). From the distribution of rights to access to public resources, and from reproductive roles to unequal labour market opportunities, the life experiences of females differ from those of males (Sapiro, Reference Sapiro2003). Not surprisingly, given these differences, research has also established gender-based inequalities in health, with women reporting higher levels of distress and depression and a higher burden of chronic illnesses than males, independent of any genetic factors (Marcus & Seeman, Reference Marcus and Seeman1981; Denton et al., Reference Denton, Prus and Walters2004; Annandale, Reference Annandale2009). Females in general, but especially racial/ethnic minority females, tend to locate at the lower tail of the SES distribution and to experience associated accumulations of negative health outcomes (Geronimus, Reference Geronimus1992; Geronimus et al., Reference Geronimus, Hicken, Pearson, Seashols, Brown and Cruz2010).
Although reaching older age is selective on health (Markides & Machalek, Reference Markides and Machalek1984), there is a strong relationship between ageing and functional limitation and disability, especially among older adults. In the United States, for example, more than 60% of individuals over the age of 65 have multiple chronic conditions (Vogeli et al., Reference Vogeli, Shields, Lee, Gibson, Marder and Weiss2007). As retirees age, they also become more vulnerable to the negative health effects of a lower SES due to higher risk of co-morbidity. Apart from functional, cognitive and productivity declines related to ageing, pension allowances that often do not correspond to pre-retirement income levels push new retirees towards the left tail of the SES spectrum. In fact, psychosomatic manifestations, frailty and multi-system physiological dysregulation are the rule more than the exception in older adults (Fried et al., Reference Fried, Tangen, Walston, Newman, Hirsch and Gottdiener2001).
A key argument of this study is that the same social forces that non-randomly sort demographic groups into socioeconomic statuses affect their health in profound ways. The health statuses of blacks, older adults and females often concur with the multi-system dysregulation found in lower socioeconomic statuses. Multi-system physiological indicators have evinced poorer metabolic performance, higher inflammatory burden, higher concentration of stress-related hormones and higher risk of cardiovascular disease among these groups (Geronimus et al., Reference Geronimus, Hicken, Keene and Bound2006). The purpose of this paper is, therefore, to investigate how allostatic load – an index constructed from biomarkers that assess the orchestration of the nervous, metabolic, immune, cardiovascular and endocrine systems – may be linked to social stratification as evinced in econo-demographic within-class homogeneity and between-class dissimilarity.
Methods
Data
The study used data from the national survey of Midlife Development in the United States (MIDUS) – a longitudinal study first fielded in 1995/1996 with a national baseline sample including more than 7000 participants. The baseline cohort also included a subsample of siblings (n = 950) and a subsample of twins (n = 1914). Data on psychosocial, physiological, demographic and behavioural indicators important for the understanding of the long-term pathways that lead to health and illness were collected via random-digit dialling telephone surveys and self-administered questionnaires. A longitudinal follow-up assessment in 2004/2006 (MIDUS II) included the measures used in the baseline MIDUS plus new biological and neurological measures. The final analytic sample implemented in the present analyses used data from the MIDUS II Biomarker substudy (n = 1255), which includes a subsample of Milwaukee African Americans (n = 201), participants from the baseline sample (n = 666) and a subsample of twins (n = 388). The Biomarker Project data were collected during a 2-day protocol at Georgetown University, UCLA, and the University of Wisconsin. Visit protocols were standardized across the three research centres (Love et al., Reference Love, Seeman, Weinstein and Ryff2010). The analysed sample included 1244 individuals (of which 199 were from the Milwaukee subsample) who had sufficient data to construct the allostatic load scale.
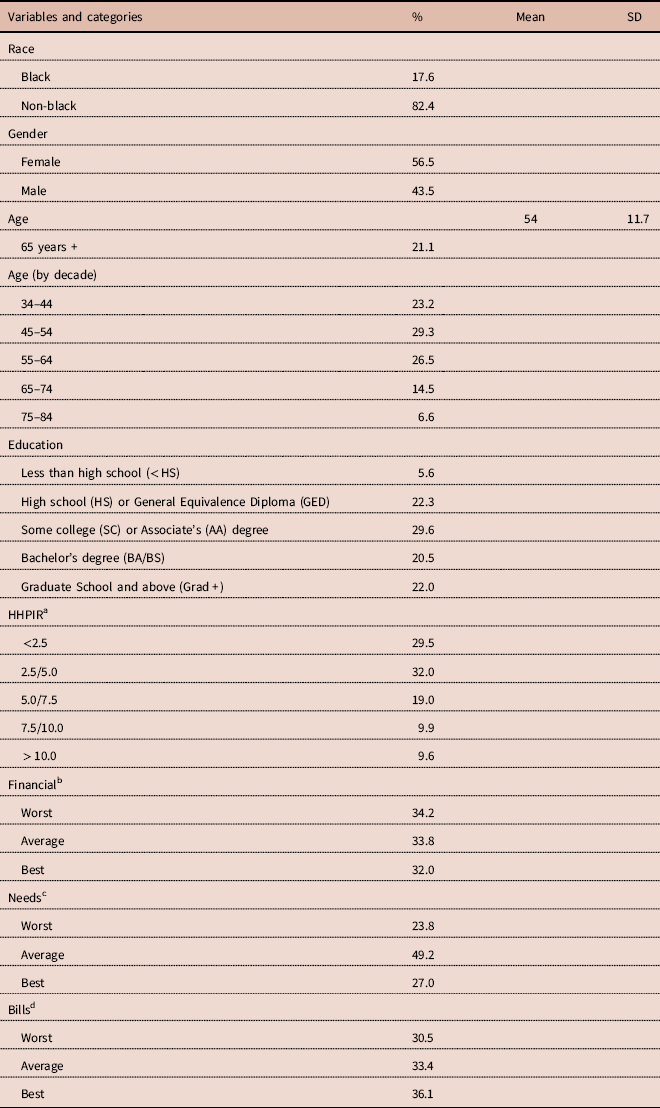
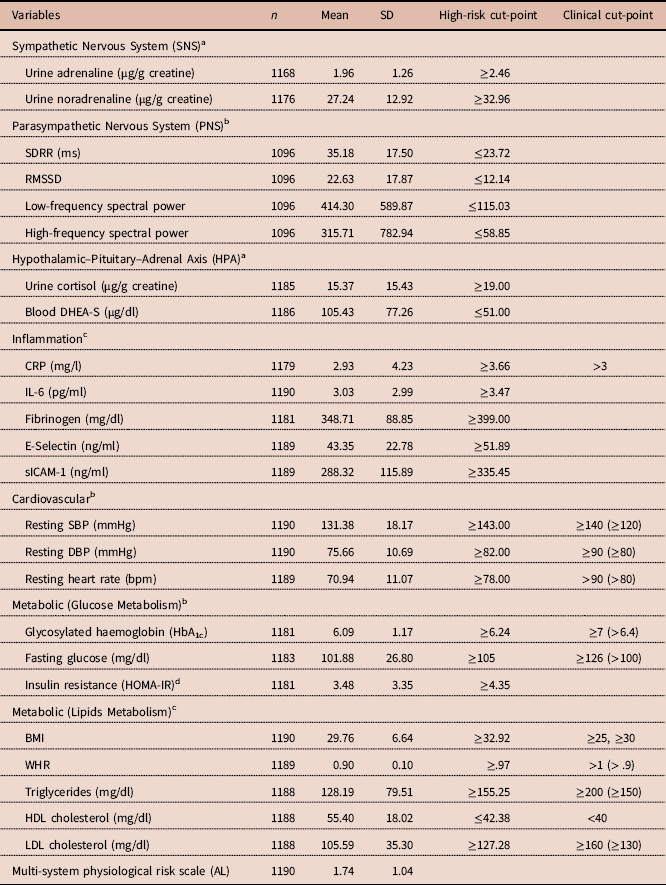
The analyses implemented socioeconomic and demographic indicators, and physiological biomarkers – all of which are standard in the literature. The SES indicators were divided into two objective measures (education and household-adjusted poverty-to-income ratio) and three subjective measures (perception of current financial situation, enough money to meet basic needs and having enough money to pay bills). The demographic indicators were race/ethnicity, gender and age (Table 1). Finally, the study used 24 physiological biomarkers that represent seven biological systems of the human body (Table 2).
Descriptive statistics for socioeconomic and demographic indicators of study sample, MIDUS Biomarker Project, N = 1190

a Household-adjusted poverty-to-income ratio.
b Perception of current financial situation.
c Having enough money to meet basic needs.
d Difficulty in paying bills.
Descriptive statistics for individual physiological biomarkers and multi-system physiological risk scale (allostatic load), N = 1190
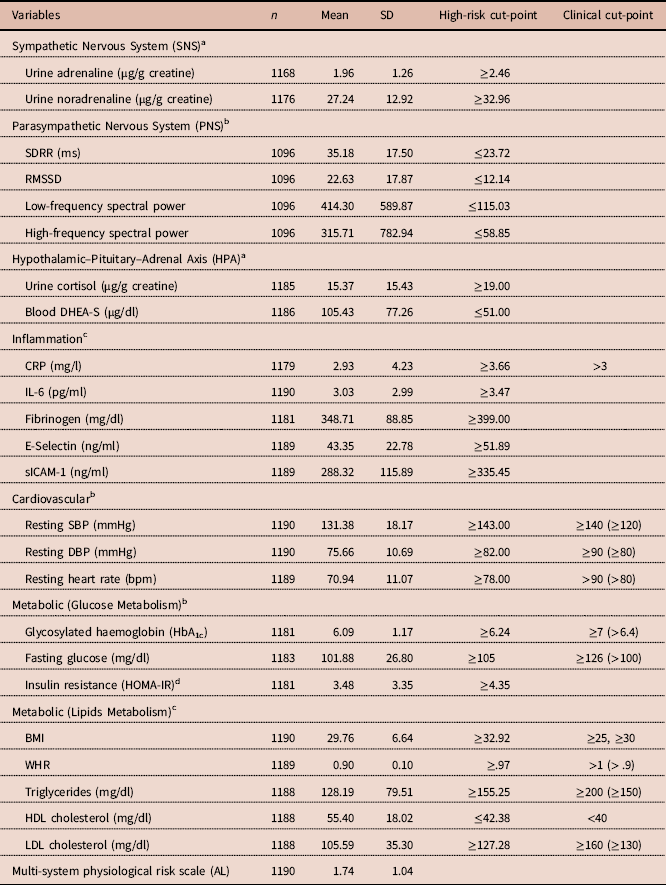
See text for definitions of abbreviations.
a Scores computed for individuals with at least 1 item.
b Scores computed for individuals with at least 2 items.
c Scores computed for individuals with at least 3 items.
d HOMA-IR = fasting insulin (uIU/ml) × fasting glucose (mg/dl) × 0.00247 (Matthews et al., Reference Matthews, Hosker, Rudenski, Naylor, Treacher and Turner1985).
Variables
Socioeconomic indicators
Education was coded from 1 to 5: 1 = less than high school (HS), 2 = HS/GED, 3 = some college/associate’s degree, 4 = bachelor’s degree and 5 = post-graduate degree or higher. The construction of household-adjusted poverty-to-income ratio (HHPIR) required three main computations: (1) household size, calculated as total number of children (individuals 17 years and younger) and adults (individuals 18 years and older) living in the household; (2) household income, adjusted to inflation, calculated as the sum of the inflation-adjusted respondent’s, spouse’s and other household members’ personal earnings, pension income, social security income and government assistance income; (3) poverty threshold, obtained from the US Census Bureau and assigned to participants according to household size and the year their data were collected. The HHPIR was coded from 1 to 5: 1 = less than 2.5 times the poverty threshold, 2 = 2.5–4.99, 3 = 5.0–7.49, 4 = 7.5–9.99 and 5 = 10 times or more. Perception of current financial situation was coded from 1 to 3: 1 = worst possible, 2 = average and 3 = best possible. Having money necessary to meet basic needs was coded from 1 to 3: 1 = not enough, 2 = just enough and 3 = more than enough. And level of difficulty paying bills was coded from 1 to 3: 1 = very or somewhat difficult, 2 = not very difficult and 3 = not at all difficult.
Demographic indicators
Race/ethnicity was coded dichotomously: 2 = black/African-American and 1 = non-black (n = 1025; white (n = 960), multi-racial (n = 44), other (n = 21)). Gender was coded dichotomously: 2 = female and 1 = male. Age was coded by decade from 1 to 5: 1 = 34–44 years, 2 = 45–54 years, 3 = 55–64 years, 4 = 65–74 years, and 5 = 75–84 years.
Physiological biomarkers
The 24 physiological biomarkers represent seven biological systems: the sympathetic nervous system (SNS), parasympathetic nervous system (PNS), hypothalamic–pituitary–adrenal axis (HPA), inflammation and cardiovascular and metabolic (glucose and lipids) systems. The biomarkers were measured as follows for the seven biological systems. (1) SNS: overnight urinary measures of adrenaline and noradrenaline. (2) PNS: four heart rate variability parameters: (a) low- and high-frequency spectral power, (b) the standard deviation of heartbeat-to-heartbeat intervals (SDRR), and (c) the root mean square of successive differences (RMSSD). (3) HPA: an overnight urinary measure of cortisol and a serum measure of dehydroepiandrosterone sulfate (DHEA-S). (4) Inflammation: plasma C-reactive protein (CRP), fibrinogen and serum measures of interleukin-6 (IL-6) and the soluble adhesion molecules E-Selectin and the intracellular adhesion molecule-1 (ICAM-1). (5) Cardiovascular: three measures of cardiovascular performance were used: (a) resting pulse, (b) resting systolic blood pressure (SBP) and (c) diastolic blood pressure (DBP). (6) Glucose metabolism: levels of glycosylated haemoglobin, fasting glucose and the homeostasis model of insulin resistance (HOMA-IR). (7) Lipids metabolism: high-density lipoprotein (HDL) cholesterol, low-density lipoprotein (LDL) cholesterol, triglycerides, body mass index (BMI) and waist-to-hip ratio (WHR).
Allostatic Load (AL)
From these biomarkers, 7 indices of physiological risk were developed and then used to construct the allostatic load (AL) scale. This was computed as the sum of the 7 separate physiological risk indices and a score was assigned to each participant, as is standard in the literature (Gruenewald et al., Reference Gruenewald, Karlamangla, Hu, Stein-Merkin, Crandall, Koretz and Seeman2012; Brooks et al., Reference Brooks, Gruenewald, Karlamangla, Hu, Koretz and Seeman2014; Karlamangla et al., Reference Karlamangla, Miller-Martinez, Lachman, Tun, Koretz and Seeman2014; Mori et al., Reference Mori, Karlamangla, Merkin, Crandall, Binkley, Greendale and Seeman2014; Seeman et al., Reference Seeman, Merkin, Karlamangla, Koretz and Seeman2014; Friedman et al., Reference Friedman, Karlamangla, Gruenewald, Koretz and Seeman2015; Wiley et al., Reference Wiley, Gruenewald, Karlamangla and Seeman2016). Each of these 7 indices was calculated as the proportion of the total number of biomarkers for each system (ranging from 2 to 6) that reached high-risk quartile values (upper or lower quartile, depending on the biomarker). Indices thus ranged from 0 to 1, where 0 = none of the system biomarkers reached high-risk quartile levels, and 1 = all of the system biomarkers reached high-risk quartile levels. Indices were assigned to participants with values on at least half of the respective system biomarkers. The sum of these 7 individual physiological risk indices produced an AL scale with a possible range from 0 to 7, where 0 = none of the biomarkers across the 7 indices reached high-risk quartile levels, and 7 = all of the biomarkers across the 7 indices reached high-risk quartile levels. This AL score was assigned to participants with data on at least 6 of the 7 physiological risk indices. Missing AL data were very few, permitting an AL score to be assigned to over 99% of the sample participants.
Data analysis
The main objective of the study was to investigate whether variations in AL scores were associated with social differentiation forces that sort individuals with similar socioeconomic and demographic characteristics into mutually exclusive, latent econo-demographic classes – that is, whether the distribution of manifest characteristics in the sample generates socioeconomic typologies found in demographic subgroups that in turn are associated with variations of multi-system physiological risk. Accordingly, a two-step procedure was applied: first a Latent Class Analysis, and then a series of linear regressions.
The analyses began by using a Polytomous Variable Latent Class Analysis (hereafter LCA) (Stouffer et al., Reference Stouffer, Guttman, Suchman, Lazarsfeld, Star and Clausen1950; Lazarsfeld, Reference Lazarsfeld1955; Marcoulides & Moustaki, Reference Marcoulides and Moustaki2012) to detect patterns of association between manifest SES and demographic indicators. For this analysis, the statistical package poLCA was run in R (Linzer & Lewis, Reference Linzer and Lewis2007, Reference Linzer and Lewis2011). This method provides a semiparametric alternative to traditional additive modelling of SES and demographic indicators allowing latent heterogeneity in respondents’ characteristics to be unearthed, and to thereby cluster respondents with shared demographic profiles and similar socioeconomic response values into mutually exclusive, latent econo-demographic classes. These latent classes result from important yet commonly overlooked non-measurable sources of systematic unobservable variation in both SES indicators and demographic subgroups. The LCA, therefore, offers an alternative perspective to traditional additive modelling of SES gradients and demographic differences in health. Instead of assuming monotonic associations in the data, LCA permits the similarities and differences in the patterns that live in the cross-categorizations of the socioeconomic and demographic indicators to be sorted out. The underlying assumption is therefore a different one: that the presumable unobserved sources of heterogeneity that generate the latent econo-demographic classes are related to an important degree to processes of social stratification. Results from this modelling strategy encapsulate a rich interpretation of social stratification and its relationship to health.
The LCA models were fitted for 2 to 7 latent classes using Maximum Likelihood Estimation. Since the variables were categorical, this was accomplished without making assumptions (other than local independence) about the distribution of the indicators that define the classes (Hagenaars & McCutcheon, Reference Hagenaars and McCutcheon2002; Lanza et al., Reference Lanza, Collins, Lemmon and Schafer2007). To avoid local maxima and increase the probability of a global maximum solution of the log-likelihood function, each model was fitted 100 times (Linzer & Lewis, Reference Linzer and Lewis2011). Complete data cases were used with no imputation for missing data. Differences between missing and non-missing data cases were trivial.
There are differences in the qualitative nature of the variation that SES and demographic indicators contain, respectively. The SES indicators mostly contain a social type of variation while demographic indicators may contain both social and other (e.g. biological) types of variation. Because fitted classes mostly emerge from correlations among the cross-categorizations of the socioeconomic and demographic indicators, the LCA algorithm would exhaust most of the social-type variance shared by the SES and demographic indicators, increasing the confidence that LCA-fitted classes are representative, at least to an important degree, of social processes of differentiation. To account for the non-social variation in demographic indicators, these covariates were also included in the regression models.
For the regression analysis, each participant was assigned a Posterior Probability (PP) of class membership – one for each of the fitted classes. The PP is a measure of similarity between the participant and the prototypical person in the class, and it is estimated via the LCA algorithm. The PPs sum to 1 for each individual, and differ from one LCA-fitted class to another precisely because they capture unobservable heterogeneity. In essence, a PP represents the probability that a participant with specific characteristics would belong to a given class.
It is hypothesized that AL scores vary across the LCA-identified classes, and vary among individuals within a class, according to how much class members resemble the prototypical person in the class. To test this hypothesis, OLS estimation was used to run a series of linear regressions of AL scores on the PPs. All linear regressions reported robust standard errors that accounted for non-normality and that were corrected for possible confounding due to same-family membership in the sample. The Predicted Class (PC) membership was also estimated, which assigns each participant to exactly one class.
Because the final analytic sample came from the Biomarker Project (complete financial data n = 1190) – which is a subsample of the MIDUS II longitudinal study (complete financial data n = 4332) – the latent classes were fitted using the longitudinal study sample. This step allowed generalizability to be improved – i.e. the certainty that the fitted classes were more representative of classes detectable in the national population. A final model with 5 latent classes was selected, and it fitted the data very well; models with 2 to 4 latent classes did not fit the data as well as the 5-class model. Models with 6 and 7 classes had a similar fit quality as the 5-class model – that is, they did not add new meaning to the classification, but they generated sub-classes (as opposed to primary divisions in the data) that compromised parsimony. In essence, the 5-class model portrayed the most information with the least number of fitted classes.
To ensure that the 5 latent classes generated using the longitudinal study sample were representative of classes extant in the final analytic sample extracted from the Biomarker Project, a random sample from the longitudinal study was generated as well, with the same size as the final biomarker analytic sample (n = 1190), and the level of similarity between the PPs of the 5-class model were assessed and the PPs estimated using the biomarker sample and the random sample, respectively. No significant differences were detected, indicating that the Biomarker sample participants were assigned PPs representative of classes that exist in the national population rather than classes affected by sample variability.
Results
Table 1 shows the descriptive statistics for SES and demographic indicators in the Biomarker Project sample. As show, the sample is predominantly non-black (83.4%), with an average age of 54 years and with a slightly greater proportion of females (56.5%). Levels of education are rather high, with 42.5% of the sample having a Bachelor’s degree or higher. Despite educational attainment, HHPIRs are somewhat high, with 29.5% of the sample living around or below the poverty level (HHPIR ≤2.5). The three subjective financial indicators show somewhat uniform distributions, indicating considerable variation in their score ranges.
The descriptive statistics for individual biomarkers, high-risk and clinical cut-points and AL scores are reported in Table 2. High-risk quartile values in the sample for CRP, resting SBP, BMI, WHR and HDL cholesterol were comparable to customary clinical risk cut-points. High-risk quartile values for glycosylated haemoglobin, fasting glucose, triglycerides and LDL were moderate in size compared with typical clinical risk cut-points. The mean AL score was 1.76 (SD = 1.03) from a potential range of 0 to 7, and an actual range of 0.00 to 5.03. Although the mean AL score ( $$\overline{{{\rm AL}}} {\equals}1.74$$) indicates a rather healthy sample, the score distribution shows significant variation (SD = 1.04).
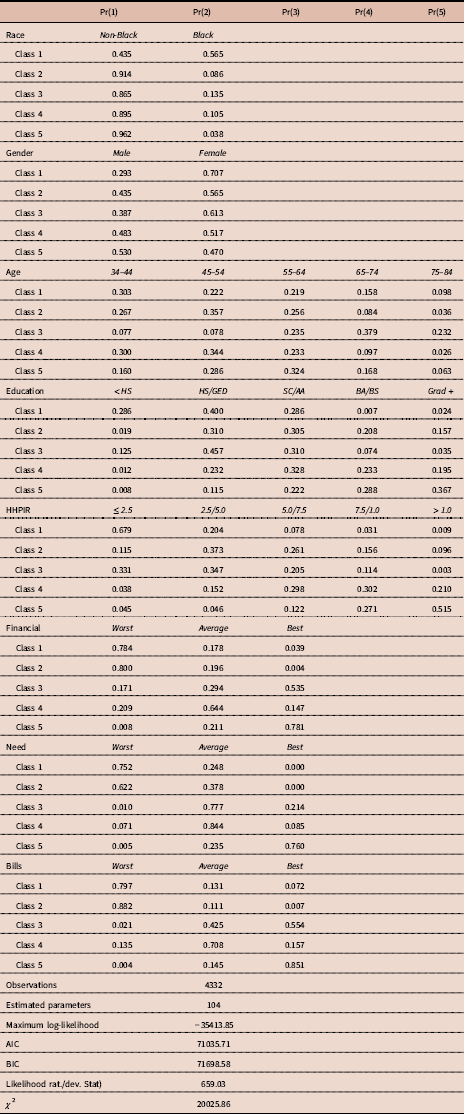
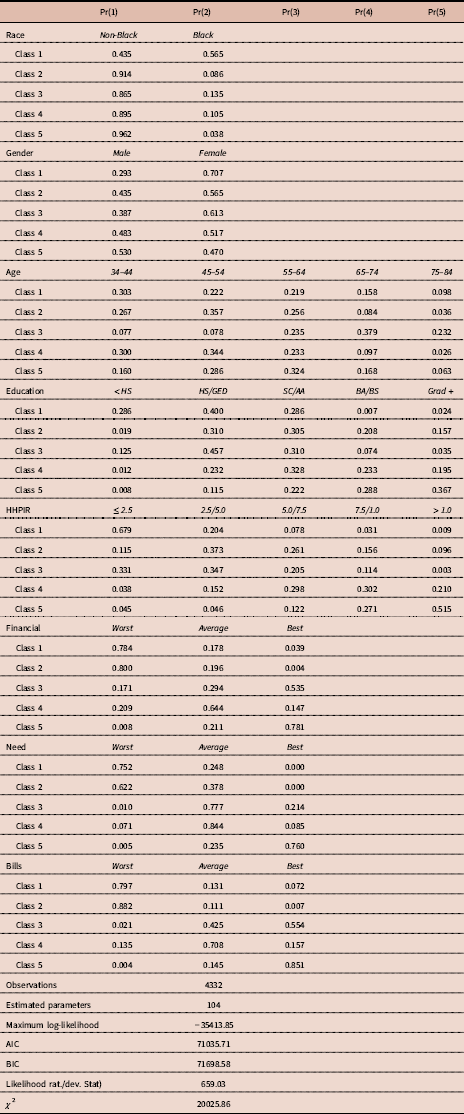
Table 3 provides the composition of the five fitted latent classes using the longitudinal sample. For example, the subscale Race, which has two possible values (non-black and black), shows that individuals in Class 2 have a 0.914 probability of being non-black (Pr(1) = 0.914), meaning that Class 2 highly discriminates between the racial categories. The same cannot be said, however, using the response values of the subscale; for instance, individuals in Classes 3 to 5 have a 0.865, 0.895 and 0.962 probability, respectively, of being non-black – in other words, being non-black is not exclusively descriptive of Class 2.
Polytomous Variable Latent Class Analysis (LCA) results for final five-classes model, showing the conditional item response probabilities by outcome variable for each class in the longitudinal sample, N = 4332
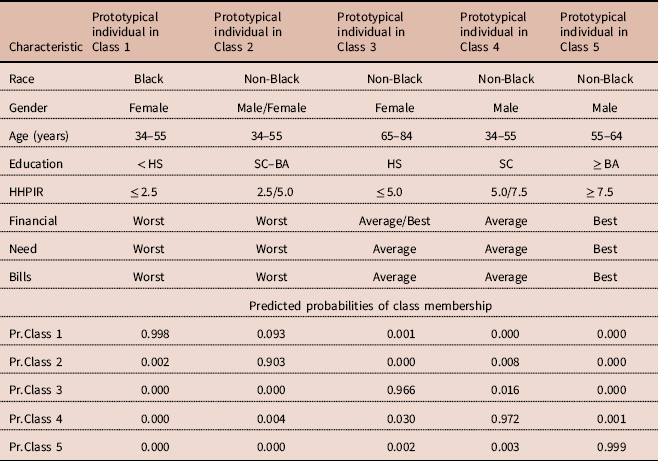
The top panel of Table 4 depicts specific combinations of traits that approximate the prototypical individual in each class in the analytic sample (n = 1190), and the bottom panel reports the predicted probability of class membership for the respective combinations. As shown, Class 1 individuals are likely to be black, relatively young females with exceptionally low SES. Class 2 individuals are likely to be non-black, relatively young males and females with low SES (relatively high education, but low financial indicators). Class 3 individuals are likely to be older, non-black females of low-to-medium SES (low objective SES, yet slightly better than average subjective SES). Class 4 individuals are likely to be non-black, relatively young males with medium-level SES (somewhat high HHPIR, yet average subjective SES). Class 5 individuals are likely to be older, non-black males with high SES. Put more succinctly, Class 1 represents disadvantaged blacks, especially females; Class 2 represents young, low-SES non-blacks; Class 3 represents older adults (retirees); Class 4 represents the middle class; and Class 5 represents the privileged class.
Predicted probability of class membership and characteristics of prototypical individuals in each class (N = 1190)
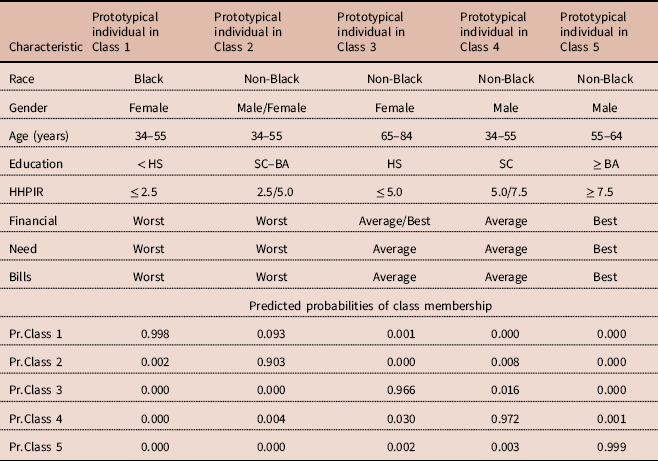
In the top panel, each column represents a combination of characteristics representing the prototypical individual in each class. For instance, a prototypical individual who is black, female, aged 34–55 years, with less than a high school education (<HS) and a HHPIR under 2.5, and with the worst possible financial, meeting basic need and difficulty paying bills situation has a 99.8 probability of belonging to Class 1, a 0.002 probability of belonging to Class 2, and a 0.000 probability of belonging to Classes 3–5 (bottom panel).
These findings suggest that social forces sort individuals into mutually exclusive classes structured in complex interactions between socioeconomic and demographic indicators. These latent classes, not revealed in traditional analyses of the additive, independent associations of SES and demographic indicators, are useful illustrations of the social combinatory bounds that exist between these indicators.
Table 4 also illustrates the heterogeneity of the relationship of income and financial-situation with education. For instance, while the prototypical individual in Class 1 has both low education and a poor economic/financial situation, the prototypical individual in Class 2 has at least some college education but also low SES. Notably, there is no overlap of race categorizations across the classes. Being black and poor is not the same as being non-black and poor.
Socioeconomic differences between prototypical individuals in Classes 2 and 4 exemplify heterogeneity in economic/financial standing on the basis of gender. Probabilities of class membership increase for young non-blacks in both classes, but while the probability of membership increases about equally by gender in Class 2, it increases only for males in Class 4. Significantly, the prototypical individual in Class 4 is likely to have a higher economic and financial standing despite having a slightly lower level of education than the prototypical individual in Class 2.
These two examples corroborate that the relationship of economic and financial-situation with education vary along racial and gender lines, and that these circumstances of disadvantage follow mutually exclusive processes of social differentiation. Privileged Class 5 reinforces this notion: the prototypical individual also tends to be a non-black male, albeit older than the Class 4 prototypical non-black male. Females are exposed to greater stratification constraints than males. Being a female increases the probability of belonging to Classes 1 to 3, which manifest lower levels of SES, while being a non-black male increases the probability of belonging to higher-SES Classes 4 and 5. This pattern coincides with the traditional view of additive effects of race and gender on SES. However, probing these relationships reveals other interactions at work. Females’ social class stratification appears to be conditional on their race in Class 1, on a lack of positive returns of education on economic and financial-situation in Class 2, and on longevity in Class 3.
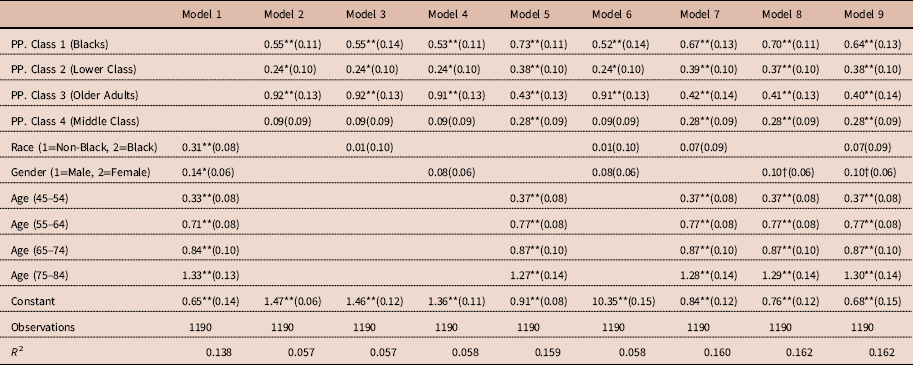
Table 5 shows the results of the regression models. Model 1 illustrates the direct relationship between demographic indicators and allostatic load. As expected, there are substantial and statistically significant differences in AL between races and genders and among age groups. Model 2 shows the results of testing for relationships between PPs and AL as demographic indicators were progressively added to Models 3 to 5, and as they were added in combinations to Models 6 to 9.
Linear regression model estimates for the associations between posterior probabilities of class membership (PP) and allostatic load

Robust standard errors are in parentheses.
The reference category is Class 5 (privileged class).
** p <0.01
* p <0.05
† p <0.1.
The results of Model 9 show statistically significant differences in AL associated with the probability of belonging to Classes 1 to 4 in comparison to privileged Class 5. Predicted average AL scores from Model 9 are 2.08, 1.82, 1.84, 1.72 and 1.44 for Classes 1 to 5, respectively. These results illustrate that blacks, and especially black females (Class 1), constitute a distinctively separate class in US society with the worst socioeconomic standing and the worst health.
Since LCA clusters individuals for the most part using socially relevant variance, further controls for age, gender and race help to remove bias from estimated PP coefficients due to within-class variance unrelated to social stratification. Accordingly, Model 9 shows that the difference in AL between Classes 5 and 1 is substantial considering that it equals half of the difference in AL scores between age groups 75–84 and 34–44 years (ß = 1.30) that is attributable to ageing-variance unrelated to social stratification. In other words, their difference in AL corresponds to about 20 years of non-stratification ageing, on average. Another way to describe the health disparity between these classes is by looking at the differences between Classes 5 and 4: the AL difference between Classes 5 and 1 (ß = 0.64) is more than double the AL difference between Classes 5 and 4 (ß = 0.28).
Table 5 also shows that, apart from the contributions that each demographic indicator brings to the configuration of the classes, AL differences exist independent from social stratification – most notably between age groups and to a lesser extent between the genders, but not between the races (ß = 0.07, SE = 0.09). This finding suggests that the poor health status of blacks is better characterized by the econo-demographic composition of Class 1 – or by social stratification processes – than by other independent factors. Racial disparities in allostatic load are to an important degree socially constructed.
It is worth noting that predicted AL levels for Classes 2 and 3, and to some extent for Class 4, are similar in spite of the distinct configuration of the classes. This indicates that different social stratification experiences can lead to similar levels of physiological dysregulation. This is a crucial piece of the story that gets lost in traditional additive models of SES gradients. Whether diverse environmental stressors/stimuli may take similar physiological tolls is a question that needs further exploration. These results imply, as well, that policymakers attempting to ameliorate negative health outcomes in the population at large should understand the underlying social stratification forces to which individuals are exposed to in the first place.
Discussion
Most social stratification research focuses on how SES differs on the basis of age, race and gender rather than how these indicators jointly conform to actual social structures. This traditional model of analysis has been widely replicated in studies of SES differences in health, including health as measured by allostatic load. Departing from, yet complementing, this approach, this study shows that social stratification – an important source of unobservable heterogeneity – operates by non-randomly sorting individuals into a set of mutually exclusive econo-demographic classes. Results show that variation in multi-system physiological dysregulation, as measured by allostatic load, is strongly associated with social class membership.
These findings extend current research on SES gradients and demographic differences in health because social stratification encompasses dimensions of social differentiation beyond SES, including historical, legal and political processes that act selectively upon the demographic profile of individuals. Social stratification influences daily life experiences by delineating life opportunities, quality of life and individual’s relative power and privileges (Williams & Collins, Reference Williams and Collins1995; Haas, Reference Haas2006; Rodriguez et al. Reference Rodriguez, Bound and Geronimus2013, Reference Rodriguez, Bound and Geronimus2014, Reference Rodriguez, Geronimus, Bound and Dorling2015; Solís et al., Reference Solís, Kelly-Irving, Fantin, Darnaudéry, Torrisani, Lang and Delpierre2015; Cottrell et al., Reference Cottrell, Herron, Rodriguez and Smith2018; Rodriguez, Reference Rodriguez2018). In this study, the Posterior Probability (PP) of group membership results from the interactive association between socioeconomic and demographic indicators at the individual level, allowing for the simultaneous integration of these two commonly separate aspects of social stratification. Accordingly, the resulting classes represent the complex, interactive socioeconomic circumstances of individuals – a key component of health variation scarcely captured through additive modelling of SES gradients.
Findings are consistent with previous research on SES gradients in health in the US (Merkin et al., Reference Merkin, Basurto-Dávila, Karlamangla, Bird, Lurie, Escarce and Seeman2009; Gruenewald et al., Reference Gruenewald, Karlamangla, Hu, Stein-Merkin, Crandall, Koretz and Seeman2012; Hudson et al., Reference Hudson, Neighbors, Geronimus and Jackson2016) and on the association between SES and allostatic load in specific (Gruenewald et al., Reference Gruenewald, Seeman, Karlamangla and Sarkisian2009; Bird et al., Reference Bird, Seeman, Escarce, Basurto-Dávila, Finch and Dubowitz2010; Slopen et al., Reference Slopen, Lewis, Gruenewald, Mujahid, Ryff, Albert and Williams2010; Geronimus et al., Reference Geronimus, Pearson, Linnenbringer, Schulz, Reyes and Epel2015). For instance, privileged non-blacks (Class 5) showed the lowest AL while low-SES non-blacks (Class 2) showed a much higher level of AL (O’Brien, Reference O’Brien2012). The results also show strong evidence supporting previous findings that low SES is concentrated among blacks, females and older adults (Geronimus et al., Reference Geronimus, Hicken, Keene and Bound2006; Juster et al., Reference Juster, McEwen and Lupien2010; Upchurch et al., Reference Upchurch, Stein, Greendale, Chyu, Tseng and Huang2015). The results suggest that variations in AL are linked to underlying socially related interactions between SES and demographic indicators beyond non-social variation found in demographic indicators.
The AL index was operationalized using 23 biomarkers that measure both primary mediators of stress and its secondary effects (McEwen & Seeman, Reference McEwen and Seeman1999). Using AL scores free of social and cultural components allowed the variations in AL due to social stratification to be differentiated from those explicitly due to race, gender or age. Accordingly, the findings indicate that AL variations in age are influenced by both social and non-social sources of variation, as are AL variations in gender – albeit to a lesser extent. The AL differences between blacks and non-blacks, however, showed a high degree of association with the indicator composition of the classes, suggesting that racial disparities in AL are mostly determined by social stratification in the US. In the analyses, blacks tended to inhabit an isolated social class with the lowest socioeconomic standing and the worst health. This indicates that racial variation in health is closely related to the degree to which the individual characteristics of blacks are grouped by forces of social differentiation, and that this process is neither necessarily nor entirely related to the independent variation of their individual characteristics. That the most disadvantaged class tends to be inhabited practically by blacks alone in the US, reaffirms their unique historical and socio-political circumstances.
The findings also concur with research on ‘weathering’ among black populations in the US, which posits that blacks in general, and black females in particular, experience earlier and more significant multi-system physiological dysregulation than their white counterparts (Geronimus, Reference Geronimus1992). Results showing that high AL scores were concentrated among black females also support the ‘double jeopardy’ effect hypothesis, or the view that black women in the US suffer the dual negative effects of gender and racial discrimination (Geronimus et al., Reference Geronimus, Hicken, Pearson, Seashols, Brown and Cruz2010).
The associations found between AL and the indicator composition of the five social classes represent the physiological expressions of social stratification. Since the LCA methodological approach permitted the unobservable heterogeneity extant in the socioeconomic and demographic characteristics of individuals to be disentangled, the composition of the resulting classes may well represent the distribution of, and access to, health-relevant resources and other health-related circumstances beyond observable associations between these indicators. In this case, the value of the LCA approach lies in the exhibition of how these indicators ‘stick together’ and how their latent interactions are associated with health – which needed not to be true. Consequently, the variation in AL found across classes may be less attributable to individual characteristics than to the structural forces that sort individuals into mutually exclusive classes in the first place.
Taken together, these findings present evidence that disparities in health emerge from group-differentiation processes to the degree that individuals are differentially exposed to the ecological, political, social, economic and historical contexts in which social stratification is ingrained. Considering that social stratification is to an important extent tempered by government-mediated processes, the diminishment of health disparities will require a deeper understanding of the historically entrenched institutional structures that outlive the individual and that prescribe and execute current policy. This study posits that these historical and existing aspects of the legal and political environments constitute the underlying social class-generating mechanism – more so than individual characteristics. Given that health policies and programmes emanate from said legal and political environments, the findings indicate that interventions should target the structural conditions that expose different subgroups to different stress risks (Thoits, Reference Thoits2010). Results highlight the importance of developing innate political and legal mechanisms for self-monitoring and self-correcting the production and elimination of conditions that induce stress among vulnerable populations.
There are some limitations of this study worth mentioning. As noted earlier, the complete financial data in the Biomarker Project were limited to 1190 participants, which could have led to some selection bias. The analytic sample is also skewed towards higher socioeconomic status; however, there is enough variation in the sample to effectively identify five mutually exclusive classes, as demonstrated by the Latent Class Analysis. A third limitation is that, although the overall characteristics of black participants in the sample resemble those in the general US population, a majority of these black participants come from Milwaukee, reminding us that the statistical generalizability of findings to the whole of the US should be done with caution. Even though the findings reinforce and expand research on socioeconomic and racial disparities in health, another limitation is that the uncovered relationships between social stratification and allostatic load are cross-sectional, which prevents causal claims being made. As the analysis is cross-sectional this precludes the allostatic load at baseline being controlled for, and therefore a clear understanding of how the evolution of social stratification at different life stages affects physiological pathways according to individual characteristics.
Results from this study confirm that the social stratification processes that distribute the psychosocial environment in which we grow up and grow old influence how we age, our health and functioning in later life and our life expectancy. The deleterious consequences of social differentiation forces are thought to modify the dysregulation of the physiological systems associated with how we handle the challenges and stresses of life. Individuals exposed to greater life stresses therefore have more dysregulation; allostatic load is the biological summary of dysregulation across multiple physiological systems, and as such is greater in the groups that are more likely to experience life stresses intrinsically related to the degree to which certain individuals – as a group – are forcedly put in a disadvantaged status in society. The hierarchy/rank-ordering of allostatic load across the latent classes uncovered in this study is consistent with the hierarchy/ranking of social privilege in the United States. That there is persistent association of allostatic load with age even within the latent classes implies that in addition to the life stresses related to the social ranking/hierarchy (as captured by the classes), there is also an accumulation of effects of stress over time (with increasing age). That no substantive residual gender and racial differences in allostatic load were detected once the classes were accounted for, offers supporting evidence that gender and racial differences in allostatic load are mostly socially constructed in the US through social stratification processes.
Ethical Approval
The authors assert that all procedures contributing to this work comply with the ethical standards of the relevant national and institutional committees on human experimentation and with the Helsinki Declaration of 1975, as revised in 2008.
Conflicts of Interest
The authors have no conflicts of interest to declare.
Funding
This research received no specific grant from any funding agency, commercial entity or not-for-profit organization.