





Introduction
In the United States, organic farming provides economic opportunities for many types of producers due to price premiums from value-added products such as USDA-certified organic food or feed (Carlson and Jaenicke Reference Carlson and Jaenicke2016). However, weed management has been consistently ranked as the primary obstacle to adopting organic production practices and achieving profitability, as reported in nationwide surveys of certified organic and transitioning producers (Brown et al. Reference Brown, Hoshide and Gallandt2019; Snyder et al. Reference Snyder, Schonbeck, Vélez and Tencer2022). Weeds compete aggressively with vegetable crops for light, water, nutrients, and space, often causing significant yield losses when left unmanaged (Zimdahl Reference Zimdahl1980). Unlike conventional systems where herbicides provide reliable control, certified organic and transitioning-organic producers must rely on cultural, mechanical, and biological strategies that are often labor-intensive and economically challenging (Bond and Grundy Reference Bond and Grundy2001). The soil weed seedbank, a reservoir of viable seeds capable of germinating over multiple growing seasons, serves as the primary source of weed recruitment and is typically concentrated in the upper soil profile, where it contributes heavily to ongoing weed infestations in cultivated systems (Grundy et al. Reference Grundy, Jones, Naylor and Naylor2002; Schwartz-Lazaro and Copes Reference Schwartz-Lazaro and Copes2019). Understanding and depleting seedbank reserves is therefore critical for developing sustainable weed management strategy in organic vegetable production systems.
For both organic and non-organic vegetable producers, polyethylene plastic mulches have long been the preferred method to control weeds in the planting rows (Moreno and Moreno Reference Moreno and Moreno2008), with tillage being the most common tool to control weeds between vegetable production rows (Röös et al. Reference Röös, Mie, Wivstad, Salomon, Johansson, Gunnarsson, Wallenbeck, Hoffmann, Nilsson and Sundberg2018). Without tillage, unmanaged weed pressure can substantially reduce vegetable yield while simultaneously building up large stockpiles of weed seedbank that can plague producers for years. But heavy reliance on tillage for weed control raises concerns about sustainability for many organic producers, because it disturbs the soil, degrading its long-term fertility and productivity (Hussain et al. Reference Hussain, Olson and Ebelhar1999). In recent years, cover crops—which are grown during fallow periods between cash crop growing seasons—have emerged as a promising strategy for suppressing weed seedbanks through multiple complementary mechanisms, including resource competition, physical smothering, allelopathic interference, and alteration of the soil microbial environment (Mirsky et al. Reference Mirsky, Gallandt, Mortensen, Curran and Shumway2010; Sias et al. Reference Sias, Wolters, Reiter and Flessner2021; Teasdale et al. Reference Teasdale, Brandsaeter, Calegari, Neto, Upadhyaya, Blackshaw, Upadhyaya and Blackshaw2007). In Missouri, annual cover crops are typically planted in the fall after vegetable crops are harvested, grown through the winter, and terminated in the spring before next season’s vegetable crops are planted. However, under such a short growing season window, annual cover crops may not produce sufficient biomass to effectively suppress weed seedbanks.
An alternative strategy is to establish permanent or semi-permanent cover crops in the alleyways or traffic paths between vegetable production beds (hereafter referred to as traffic pathways), potentially suppressing weeds without sacrificing cash crop production. Integrating a living perennial grass–legume cover crop mixture tolerant of frequent mowing into organic vegetable systems may offer a robust approach to suppressing weeds and enhancing soil health without compromising the production of economically valuable crops. A prior study at this site demonstrated that both annual and perennial grass–legume cover crop bicultures established in traffic pathways significantly improved several soil health indicators during a 3-yr organic transition period, including soil organic carbon, potentially mineralizable nitrogen, and enzyme activities, compared with tilled no-cover control pathways (Karki Reference Karki2024). However, that study did not evaluate the effectiveness of cover-cropped traffic pathway systems at suppressing weed seedbanks, which is the purpose of the present study. This knowledge gap is critical, because controlling weeds, along with soil health and fertility management, were identified by organic and transitioning producers as the most pressing production challenges and high-priority research areas to accelerate adoption of organic food and feed production in the United States (Bàrberi Reference Bàrberi2002; Clark et al. Reference Clark, Ferris, Klonsky, Lanini, Van Bruggen and Zalom1998). A comprehensive evaluation of cover-cropped traffic pathway systems must therefore address both soil health and weed seedbank dynamics to determine whether this approach offers a viable alternative to the conventional bare-fallow approach that depends on tillage for weed control or to taking an entire field out of cash crop production to grow cover crops every other year or longer as practiced by some vegetable producers in the U.S. Midwest.
Thus, the aim of this study was to evaluate germinable weed seedbank responses to 3 yr of cover cropping in traffic pathways during organic vegetable transition with tilled fallow traffic pathways as a control. Specifically, this research addressed the following objectives: (1) determine total weed seedbank density under annual versus perennial grass–legume cover crop bicultures; (2) assess weed community composition, including species richness and shifts across functional groups (annual broadleaf, annual grass, perennial broadleaf, perennial grass); and (3) characterize temporal emergence patterns to determine how cover crops affect weed recruitment timing and intensity over a 60-d germination period. We hypothesized that the presence of cover crops in traffic pathways, particularly perennials (which are mowed multiple times over 3 yr of the transition period), would interrupt weed life cycles and reduce germinable weed seedbanks through sustained resource competition, light interception, and physical suppression compared with tilled fallow pathways with no cover crops. By evaluating weed seedbank dynamics in cover-cropped traffic pathways, this study addresses a critical knowledge gap in the integrated weed management approach for sustainable organic vegetable production.
Materials and Methods
Study Site and Experimental Design
This study was a component of a large project that evaluated the impact of living perennial versus annual grass–legume cover crop bicultures that tolerate frequent mowing and established in traffic pathways between vegetable production beds on soil health improvement and yield and profitability. The study was conducted at Lincoln University of Missouri’s Alan T. Busby Research Farm near Jefferson City, MO (38.5054°N, 92.2449°W; elevation 201 m) on certified organic land during three consecutive vegetable production seasons (2021 to 2024). The soil at the study site is classified as Moniteau silt loam (fine-silty, mixed, superactive, mesic Typic Endoaqualfs) with 1% to 3% slope. Supplementary Figure S1 shows the monthly mean temperature and monthly total precipitation during the three study years (USDA-NRCS 2001) relative to the 30-yr average (1991 to 2020) (Fleishman Reference Fleishman2023).
Treatments and Experimental Design
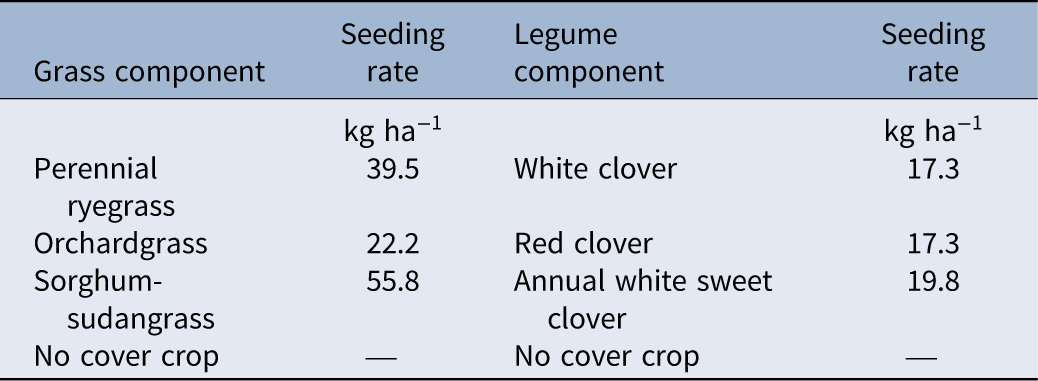
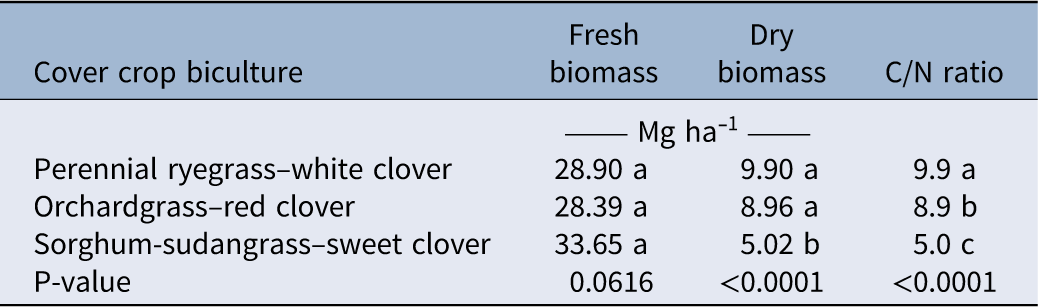
In fall 2021, the experiment was laid out as a split-plot randomized complete block design with four replications. The identity of cover crops represented main plots, and vegetable crops represented split-plots. Each main plot measured 26-m wide by 8-m long and contained nine 1.2-m-wide vegetable production beds alternating with 1.8-m-wide traffic pathways between each bed. Within each main plot, each vegetable crop was planted into three adjacent beds separated by traffic pathways such that the two outside rows were kept as buffers, with the interior bed used for data collection. Grass–legume cover crop bicultures established in the traffic pathways were: (1) perennial ryegrass (Lolium perenne L.)–white clover (Trifolium repens L.), (2) orchardgrass (Dactylis glomerata L.)–red clover (Trifolium pratense L.), (3) sorghum-sudangrass [Sorghum × drummondii (Steud.) Millsp. & Chas]–white sweet clover [Melilotus officinalis (L.) Lam.], and (4) tilled fallow traffic pathway that served as a control. These four main plot treatments are hereafter referred to as “Perennial-Ryegrass,” “Orchardgrass,” “Sorghum-Sudangrass,” and “Tilled,” respectively, in all tables and figures presented in this paper for the sake of greater simplicity. Cover crops seeding rates are provided in Table 1. Aboveground cover crop biomass samples were collected from three 25 by 25 cm quadrats per plot (or alleyway) by cutting at approximately 2.5 cm above the ground using clippers, then oven-dried at 55 C to a constant weight and weighed for dry mass determination. Aboveground fresh and dry biomass and carbon-to-nitrogen ratio (calculated as biomass C content divided by biomass N content) of the three cover crop bicultures, averaged over 3 yr of the transition period, are presented in Table 2.
Seeding rates of grass–legume cover crop bicultures used in this studya

Table 1. Long description
The table presents seeding rates for different grass and legume components used in cover crop bicultures. It has four rows and three columns. The columns are labeled ‘Grass component’, ‘Seeding rate kg ha⁻¹’, and ‘Legume component Seeding rate kg ha⁻¹’. The grass components listed are Perennial ryegrass, Orchardgrass, Sorghum-sudangrass, and No cover crop. The corresponding seeding rates for these grass components are 39.5, 22.2, 55.8, and not applicable respectively. The legume components and their seeding rates are White clover at 17.3 kg ha⁻¹, Red clover at 17.3 kg ha⁻¹, Annual sweet clover at 19.8 kg ha⁻¹, and No cover crop.
a Main plot treatments: perennial ryegrass–white clover, orchardgrass–red clover, sorghum sudangrass–white sweet clover, and tilled fallow with no cover that served as a control.
Aboveground fresh and dry biomass and carbon-to-nitrogen (C/N) ratio of the three grass–legume cover crop bicultures established in traffic pathways during organic vegetable transition, measured in 2023 (Karki Reference Karki2024)a

Table 2. Long description
A table comparing aboveground fresh and dry biomass and carbon-to-nitrogen (C/N) ratios of three grass-legume cover crop bicultures. The table has four rows and three columns. The columns are labeled ‘Cover crop biculture’, ‘Fresh biomass’, ‘Dry biomass’, and ‘C/N ratio’. The row labels are ‘Perennial ryegrass–white clover’, ‘Orchardgrass–red clover’, ‘Sorghum-sudangrass–sweet clover’, and ‘P-value’. The values in the table are as follows: Row 1: Perennial ryegrass–white clover, 28.90 a, 9.90 a, 9.9 a. Row 2: Orchardgrass–red clover, 28.39 a, 8.96 a, 8.9 b. Row 3: Sorghum-sudangrass–sweet clover, 33.65 a, 5.02 b, 5.0 c. Row 4: P-value, 0.0616, <0.0001, <0.0001.
a Within each column, values followed by the same letter are not significantly different at α = 0.05.
Perennial cover crop treatments (perennial ryegrass–white clover and orchardgrass–red clover) were seeded in October 2021 using a no-till drill after initial disking and tilling. The annual cover crop treatment (sorghum-sudangrass–white sweet clover) was seeded each spring (May 3 to 17) in 2022, 2023, and 2024 with a no-till drill. All cover crops in the traffic pathways were periodically mowed using a flail mower to prevent competition with vegetable crops and for ease of foot traffic. Control traffic pathways with no cover crops were tilled up to five times per year depending on presence of weeds. Vegetable production beds were established around mid-May by transplanting 6- to 8-wk-old greenhouse-grown seedlings of tomato (Solanum lycopersicum L.), kale (Brassica oleracea L. var. acephala), and cucumber (Cucumis sativus L.) to single-row beds spaced 60 cm apart and rotated annually in the sequence: kale–tomato–cucumber. Irrigation was provided via drip tape (one line per bed, 30-cm emitter spacing) as needed to maintain adequate soil moisture in the root zone (0- to 15-cm depth). Immediately after vegetable harvest, vegetable production beds were seeded with a cover crop mixture of winter wheat (Triticum aestivum L.) and Austrian winter pea (Pisum sativum L. ssp. arvense) except in the tilled control, where vegetable production beds kept bare fallow during the non-vegetable growing season (early October to mid-May). An aerial view of the study plots is shown in Supplementary Figure S1.
Weed Seedbank Sampling
Soil samples for weed seedbank assessment were collected from traffic pathways in late July 2025, representing the cumulative effect of three full growing seasons of cover crop management. Within each main treatment plot, three traffic pathways were selected for sampling, with each pathway measuring 8-m long by 1.8-m wide. To capture spatial variability, nine soil cores were collected per pathway using a 4.5-cm-diameter push probe to 10-cm depth. This sampling depth targets the germinable seedbank, as approximately 74% of weed seeds capable of emergence are found in the upper 5 cm of the soil profile, with germination generally limited beyond 8-cm depth (Buhler et al. Reference Buhler, Hartzler and Forcella1997; Hartzler et al. Reference Hartzler, Buhler and Stoltenberg1999). All 27 soil cores (9 cores × 3 pathways) from each main plot treatment were emptied into a bucket, thoroughly mixed, and combined into one composite sample following established protocols (Maqsood et al. Reference Maqsood, Abbas, Khaliq and Zahir2018; Nichols et al. Reference Nichols, English, Carlson, Gailans and Liebman2020). Composite samples were transferred into airtight plastic bags, placed in coolers with ice packs for transport, and stored at 0 C for 48 h to halt any metabolic activity (Oys et al. Reference Oys, Krupek, Proctor, Koehler-Cole and Basche2025) before greenhouse processing.
Germinable Weed Seedbank Assessment
The germinable seedbank approach was employed due to its practical advantages and proven effectiveness for comparing treatment effects (Reinhardt and Leon Reference Reinhardt and Leon2018). This method provides direct measurement of viable seeds capable of producing seedlings under favorable conditions. Composite soil samples were sieved through an 8-mm mesh screen to remove plant debris and weighed to ensure uniform sample mass across treatments. Plastic germination trays (27 by 52 cm) with adequate drainage were prepared with a 1-cm base layer of vermiculite. Sieved soil was evenly distributed over the vermiculite substrate to create a 1-cm growing medium layer. Three replicate trays were prepared per treatment per field replication, yielding 12 trays per treatment (4 field replications × 3 greenhouse replications).
Trays were maintained in a greenhouse under the following environmental conditions: temperature of 28 C ± 5 C, natural photoperiod (∼14 h), and automated irrigation delivering uniform watering for 2 min twice daily. The constant warm temperature was selected to optimize germination of summer-annual weed species, which represent the dominant and most agronomically problematic component of the weed community in vegetable traffic pathways during the summer growing season at this site. Accordingly, this bioassay targets the readily germinable warm-season fraction of the weed seedbank rather than the total viable seedbank, which would require variable temperature regimes and dormancy-breaking treatments to fully characterize (Baskin and Baskin Reference Baskin, Baskin, Smith, Dickie, Simon, Pritchard and Probert2003). Seedling emergence was monitored over a 60-d period at 3-d regular intervals after greenhouse setup. During the 60-d monitoring period, all emerged seedlings were identified to species level, counted, and carefully removed once or twice per week depending on emergence rate (Reinhardt and Leon Reference Reinhardt and Leon2018). Cumulative emergence data were used to calculate seedbank density for each identified weed species.
Weed Community Classification
Identified weed species were classified into four functional groups based on life cycle and growth form: annual broadleaf, annual grass, perennial broadleaf, and perennial grass. This classification allows evaluation of how cover crop treatments differentially affect weed functional groups with distinct ecological characteristics and management implications.
Statistical Analysis
All statistical analyses were conducted using R statistical language v. 4.3.1 (R Core Team 2024). Seedbank density data (total seedlings and species-specific densities) were analyzed as seedling counts per composite sampling unit based on standardized soil core volume and tray surface area. The distribution of seedbank count data was assessed for normality and homoscedasticity using Shapiro-Wilk tests and residual plots. Total weed seedbank density and functional group densities were analyzed using generalized linear mixed-effects models (GLMMs) with negative binomial distribution to account for overdispersion, fit using the glmer.nb function from the lme4 package. Cover crop treatment was considered a fixed effect, while field replication was included as a random effect. Before analysis, seedling counts were summed across all species and germination observation days within each treatment and field replication combination, yielding four experimental units per treatment corresponding to the four field replications. The three greenhouse trays prepared per treatment per field replication served as subsamples rather than independent replicates and were not modeled as a separate level in the random effects structure. Because weed seedbank sampling was conducted exclusively in traffic pathways, which represent main plot units in the split-plot design, the vegetable crop split-plot factor was not included in the weed seedbank statistical models. When significant treatment effects were detected (P < 0.05), pairwise comparisons among treatments were conducted using Tukey’s HSD test with the emmeans package. Weed species richness (number of species per treatment) was calculated for each treatment and analyzed using a linear mixed-effects model with replication as a random effect. Temporal emergence patterns were visualized and analyzed to assess treatment effects on weed recruitment timing and intensity.
Results and Discussion
Effect of Traffic Pathway Cover Crops on Total Weed Seedbank Density
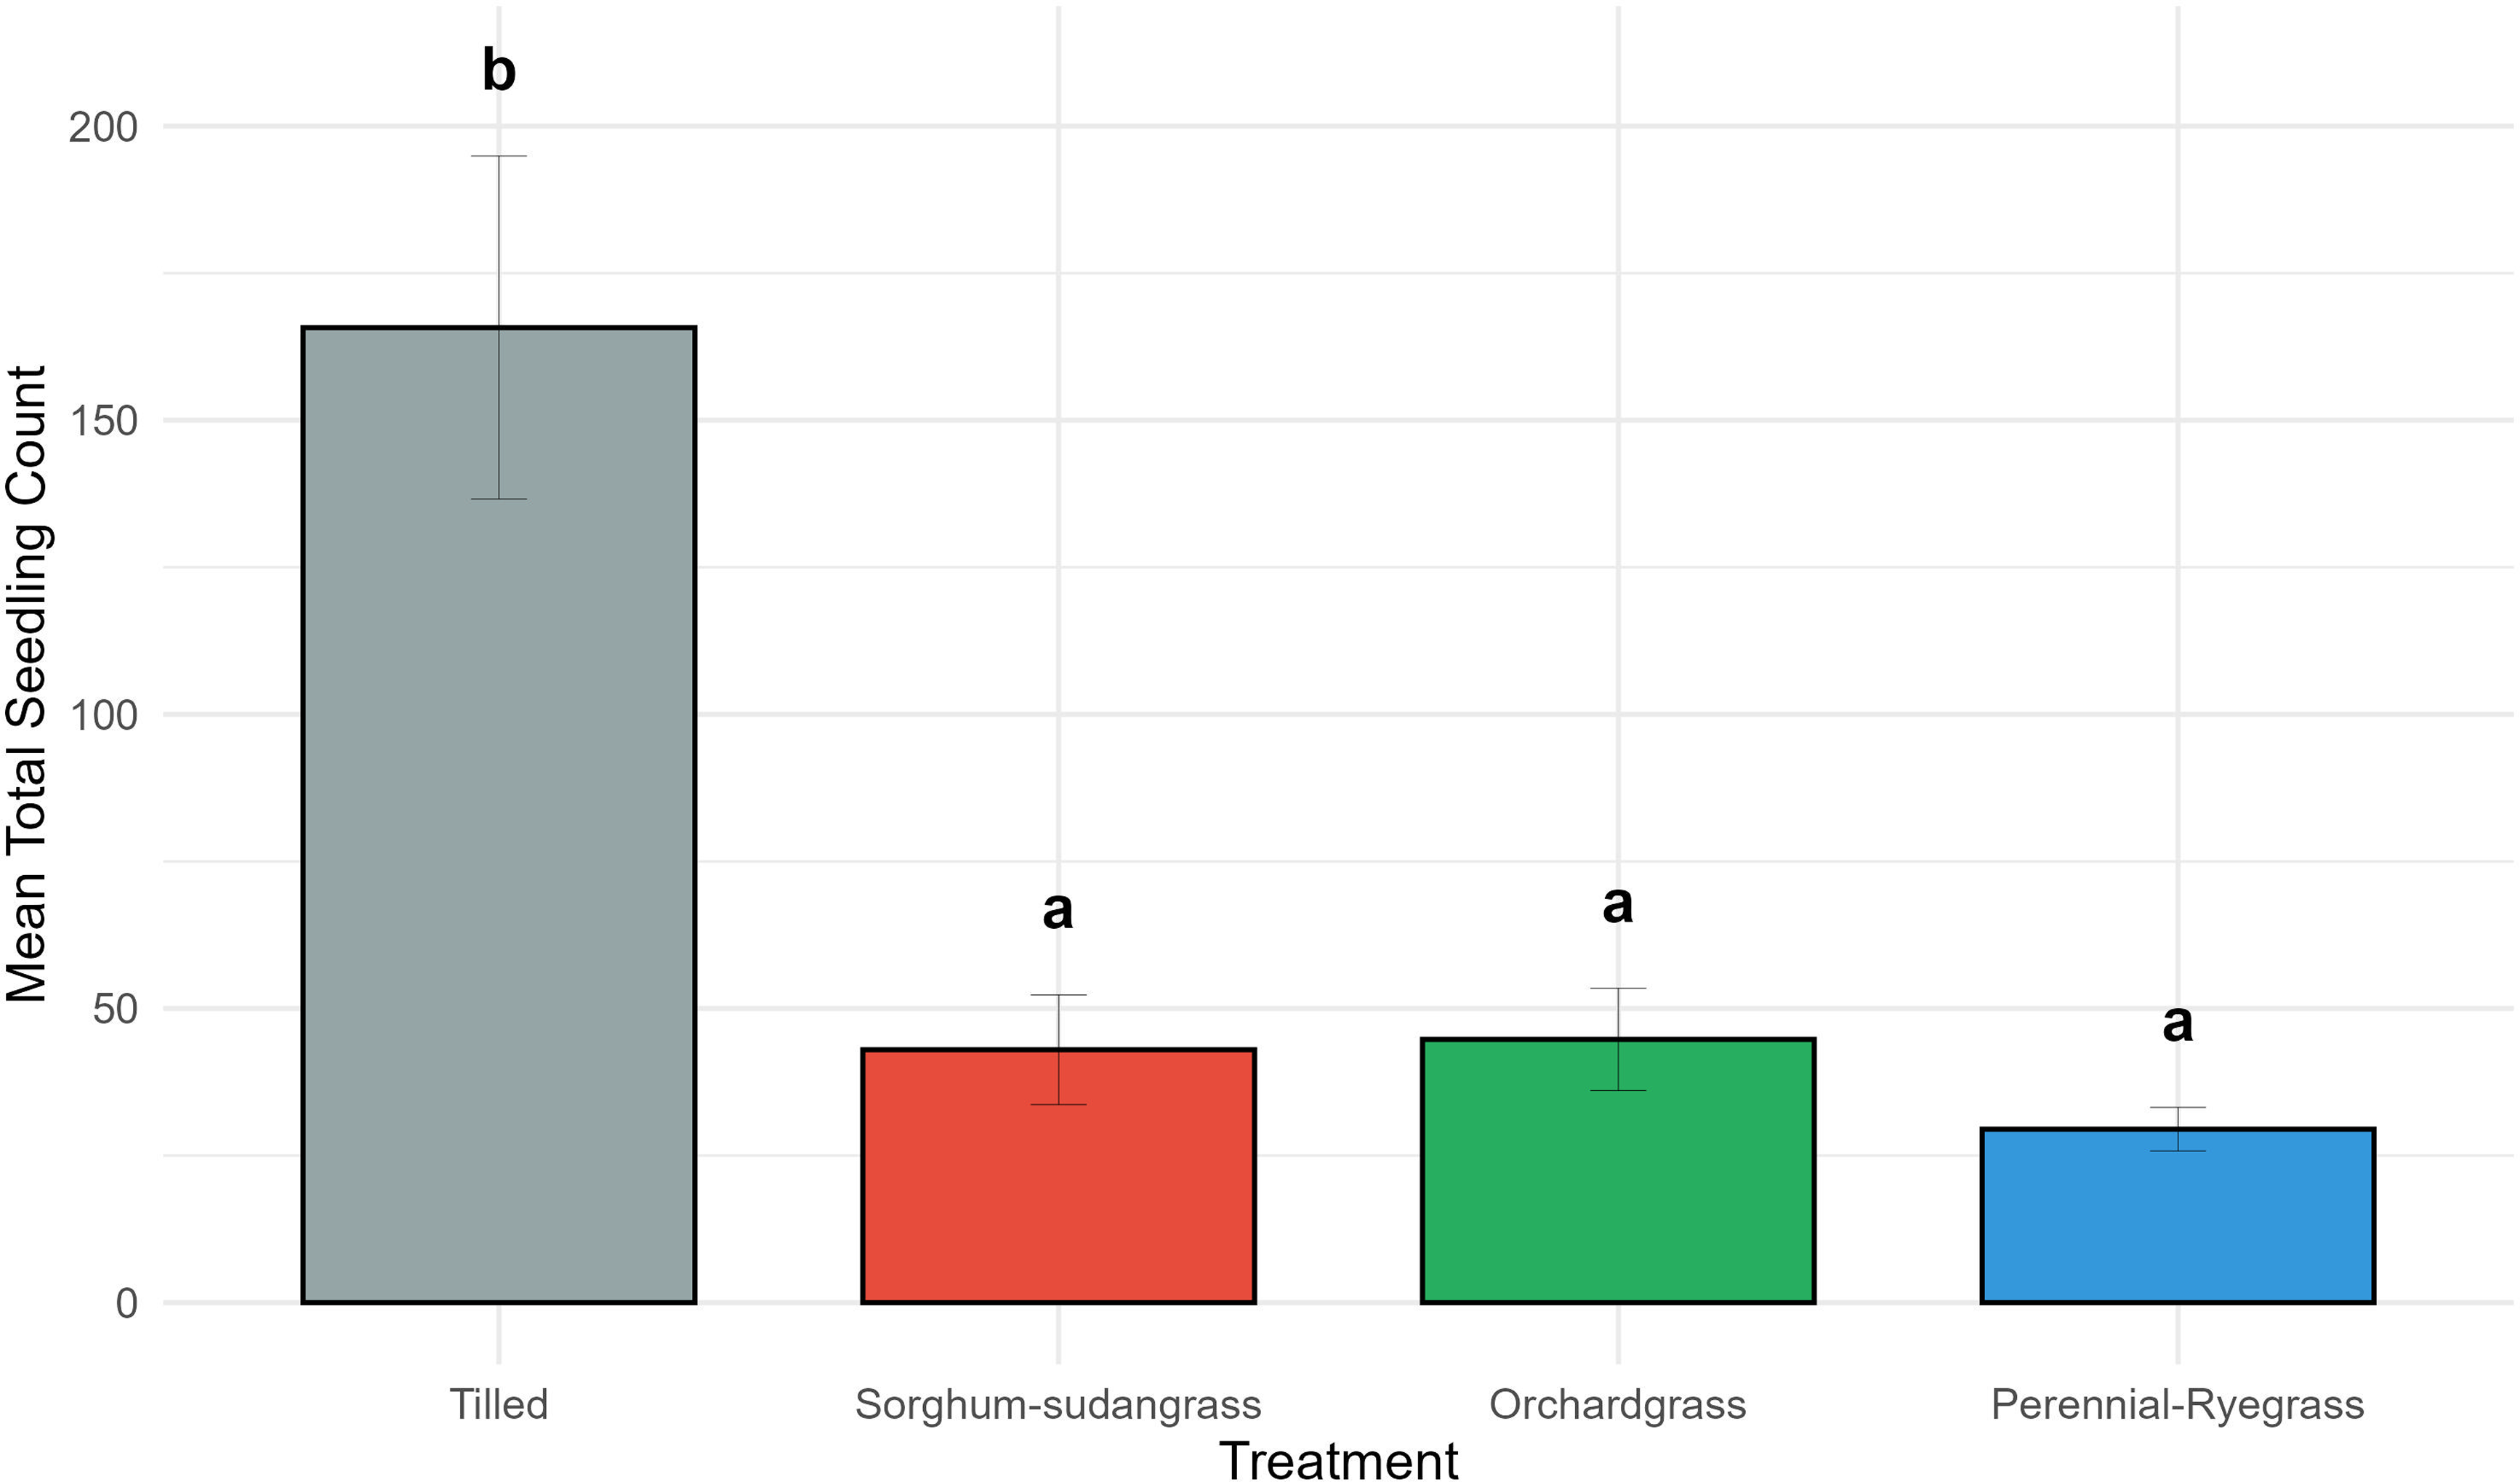
Cover crop treatment significantly affected total germinable weed seedbank density (P < 0.05; Figure 1). The tilled control accumulated approximately 167 seedlings per sampling unit on average, which was four to six times greater than all three cover crop treatments. Perennial ryegrass–white clover, orchardgrass–red clover, and sorghum-sudangrass–sweet clover averaged approximately 30, 44, and 43 seedlings, respectively, and were not significantly different from each other (Figure 1). These findings are consistent with reports of cover crops reducing germinable weed seedbanks in organic and transitional production systems through sustained competition for light, space, and soil resources (Corbin et al. Reference Corbin, Thelen, Robertson and Leep2010; Schmidt et al. Reference Schmidt, Junge and Finckh2019). The comparable suppressive capacity between the annual sorghum-sudangrass–sweet clover and the perennial ryegrass–white clover and orchardgrass–red clover mixtures is noteworthy and suggests that, within a 3-yr transition window, the life history of the cover crop does not confer differential seedbank suppression, provided sufficient biomass and ground cover are established. This is in agreement with MacLaren et al. (Reference MacLaren, Swanepoel, Bennett, Wright and Dehnen-Schmutz2019), who reported that cover crop type mattered less than continuity of ground cover for weed-suppression outcomes. The substantially higher seedbank density in the tilled control is consistent with the well-established role of soil disturbance in promoting weed seed germination and recruitment from deeper soil layers into the germinable fraction (Benech-Arnold et al. Reference Benech-Arnold, Sánchez, Forcella, Kruk and Ghersa2000; Mirsky et al. Reference Mirsky, Gallandt, Mortensen, Curran and Shumway2010, Reference Mirsky, Ryan, Curran, Teasdale, Maul, Spargo, Moyer, Grantham, Weber and Way2012). Tillage disrupts resident weed populations by burying seeds but also stimulates emergence flushes by moving dormant seeds into favorable near-surface positions (Carr et al. Reference Carr, Gramig and Liebig2013), thereby perpetuating seedbank replenishment across growing seasons.
Mean total germinable weed seedbank density (seedling count per sampling unit) under four traffic pathway treatments: tilled no-cover control, sorghum-sudangrass–sweet clover, orchardgrass–red clover, and perennial ryegrass–white clover, following 3 yr of organic vegetable transition at the Busby Organic Research Farm near Jefferson City, Missouri. Error bars represent 1 standard error of the mean. Bars sharing the same letter are not significantly different at α = 0.05.

Although weed seedbank density differed markedly among treatments, species richness did not differ significantly across the tilled control and all three cover crop treatments (P > 0.05; Supplementary Figure S2). Mean species richness ranged from approximately 4.5 to 5.8 species per sample, with no consistent pattern associated with cover crop type or presence. This result parallels findings by McKenzie-Gopsill et al. (Reference McKenzie-Gopsill, Nyiraneza, Arseneault, Lynch and Fraser2025), who reported no significant difference in seedbank species richness across land-use intensity levels in soils, despite substantial variation in seedbank density and community composition. The lack of a species richness response in the current study suggests that cover crops may suppress the abundance of seeds entering the bank without eliminating species from the community entirely over the short term. Weed species capable of in situ seed production in field margins, vegetable production beds, and adjacent areas likely continued to contribute to the local seedbank through lateral dispersal regardless of treatment, thereby maintaining species diversity across plots (Cousens and Mortimer Reference Cousens and Mortimer1995; Marshall and Moonen Reference Marshall and Moonen2002).
Shifts in Weed Community Composition and Functional Group Dominance
While total density and species richness responses diverged, treatment effects on weed community composition were pronounced. The tilled control was dominated by annual broadleaf species, which accounted for the preponderance of the seedbank, with annual grasses contributing the next largest fraction, and perennial grasses and broadleaves comprising comparatively minor components (Supplementary Figure S3). In contrast, all three cover crop treatments exhibited a markedly different compositional profile, characterized by a substantial reduction in the annual broadleaf fraction and a proportionally greater representation of perennial grasses within the seedbank (Supplementary Figure S3). This compositional reorganization under cover crops mirrors community-level responses described in other long-term cover cropping and reduced-tillage systems, where persistent ground cover selectively suppresses annual ruderal species that depend on bare, disturbed soil for establishment (Cardina et al. Reference Cardina, Herms and Doohan2002; Teasdale et al. Reference Teasdale, Mangum, Radhakrishnan and Cavigelli2004).
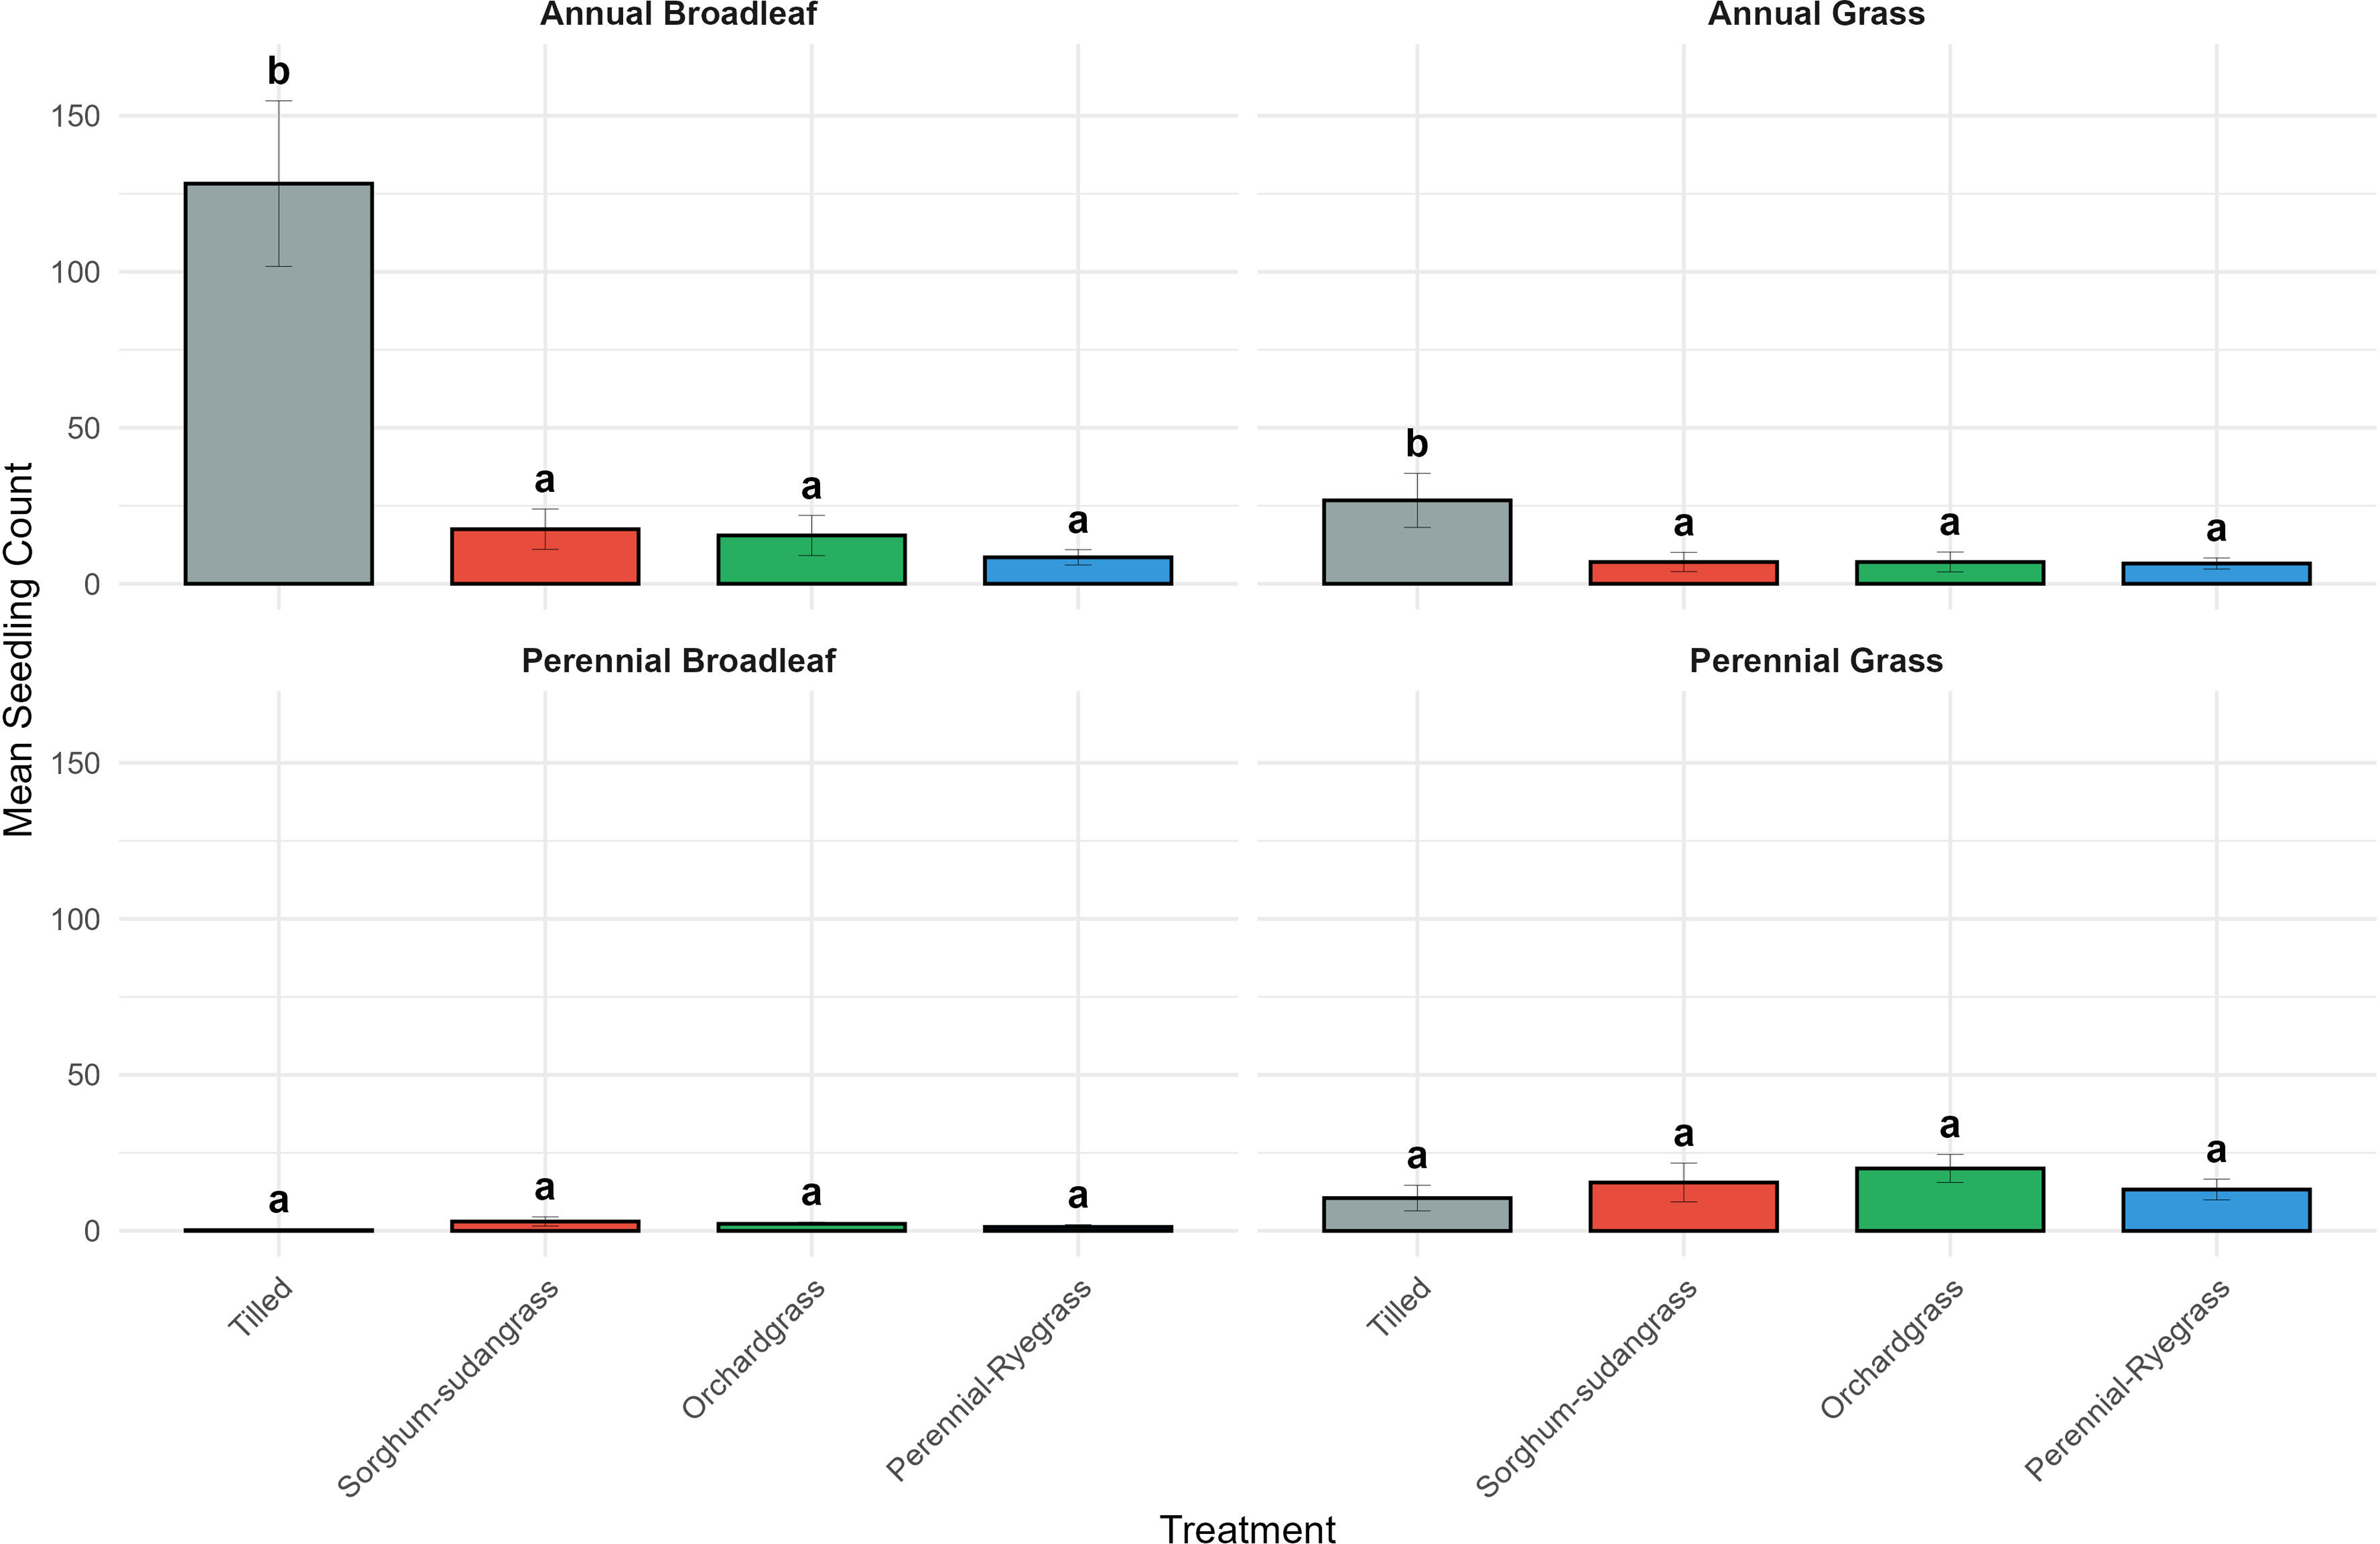
Analysis of seedbank density by functional group confirmed that the overall suppressive effect of cover crops was driven primarily by reductions in the annual broadleaf and annual grass fractions (Figure 2). Annual broadleaf density in the tilled control averaged approximately 125 seedlings, compared with 15 to 18 seedlings across all cover crop treatments, representing a significant reduction exceeding 85% (Figure 2). Similarly, annual grass density was significantly lower under all cover crops relative to the tilled control, with tilled plots averaging approximately 26 seedlings compared with 8 to 10 in cover crop plots. In contrast, neither perennial broadleaf nor perennial grass fractions differed significantly among treatments (Figure 2), indicating that cover cropping had negligible influence on the perennial component of the seedbank within this time frame. The selective suppression of the annual functional groups by cover crops is ecologically consistent, as annual species characteristically rely on high rates of seed production, soil disturbance for germination, and light-rich bare soil microsites for establishment (Benech-Arnold et al. Reference Benech-Arnold, Sánchez, Forcella, Kruk and Ghersa2000; Travlos et al. Reference Travlos, Gazoulis, Kanatas, Tsekoura, Zannopoulos and Papastylianou2020). The continuous canopy closure and absence of tillage in cover crop traffic pathways likely limited these requirements, limiting both annual seed input from actively growing plants and conditions favorable for seed germination.
Mean germinable weed seedbank density by functional group (annual broadleaf, annual grass, perennial broadleaf, and perennial grass) under tilled no-cover control, sorghum-sudangrass–sweet clover, orchardgrass–red clover, and perennial ryegrass–white clover traffic pathway treatments at the Busby Organic Research Farm near Jefferson City, MO. Each panel presents treatment comparisons within a single functional group. Error bars represent 1 standard error of the mean. Within each functional group, bars sharing the same letter are not significantly different at α = 0.05.

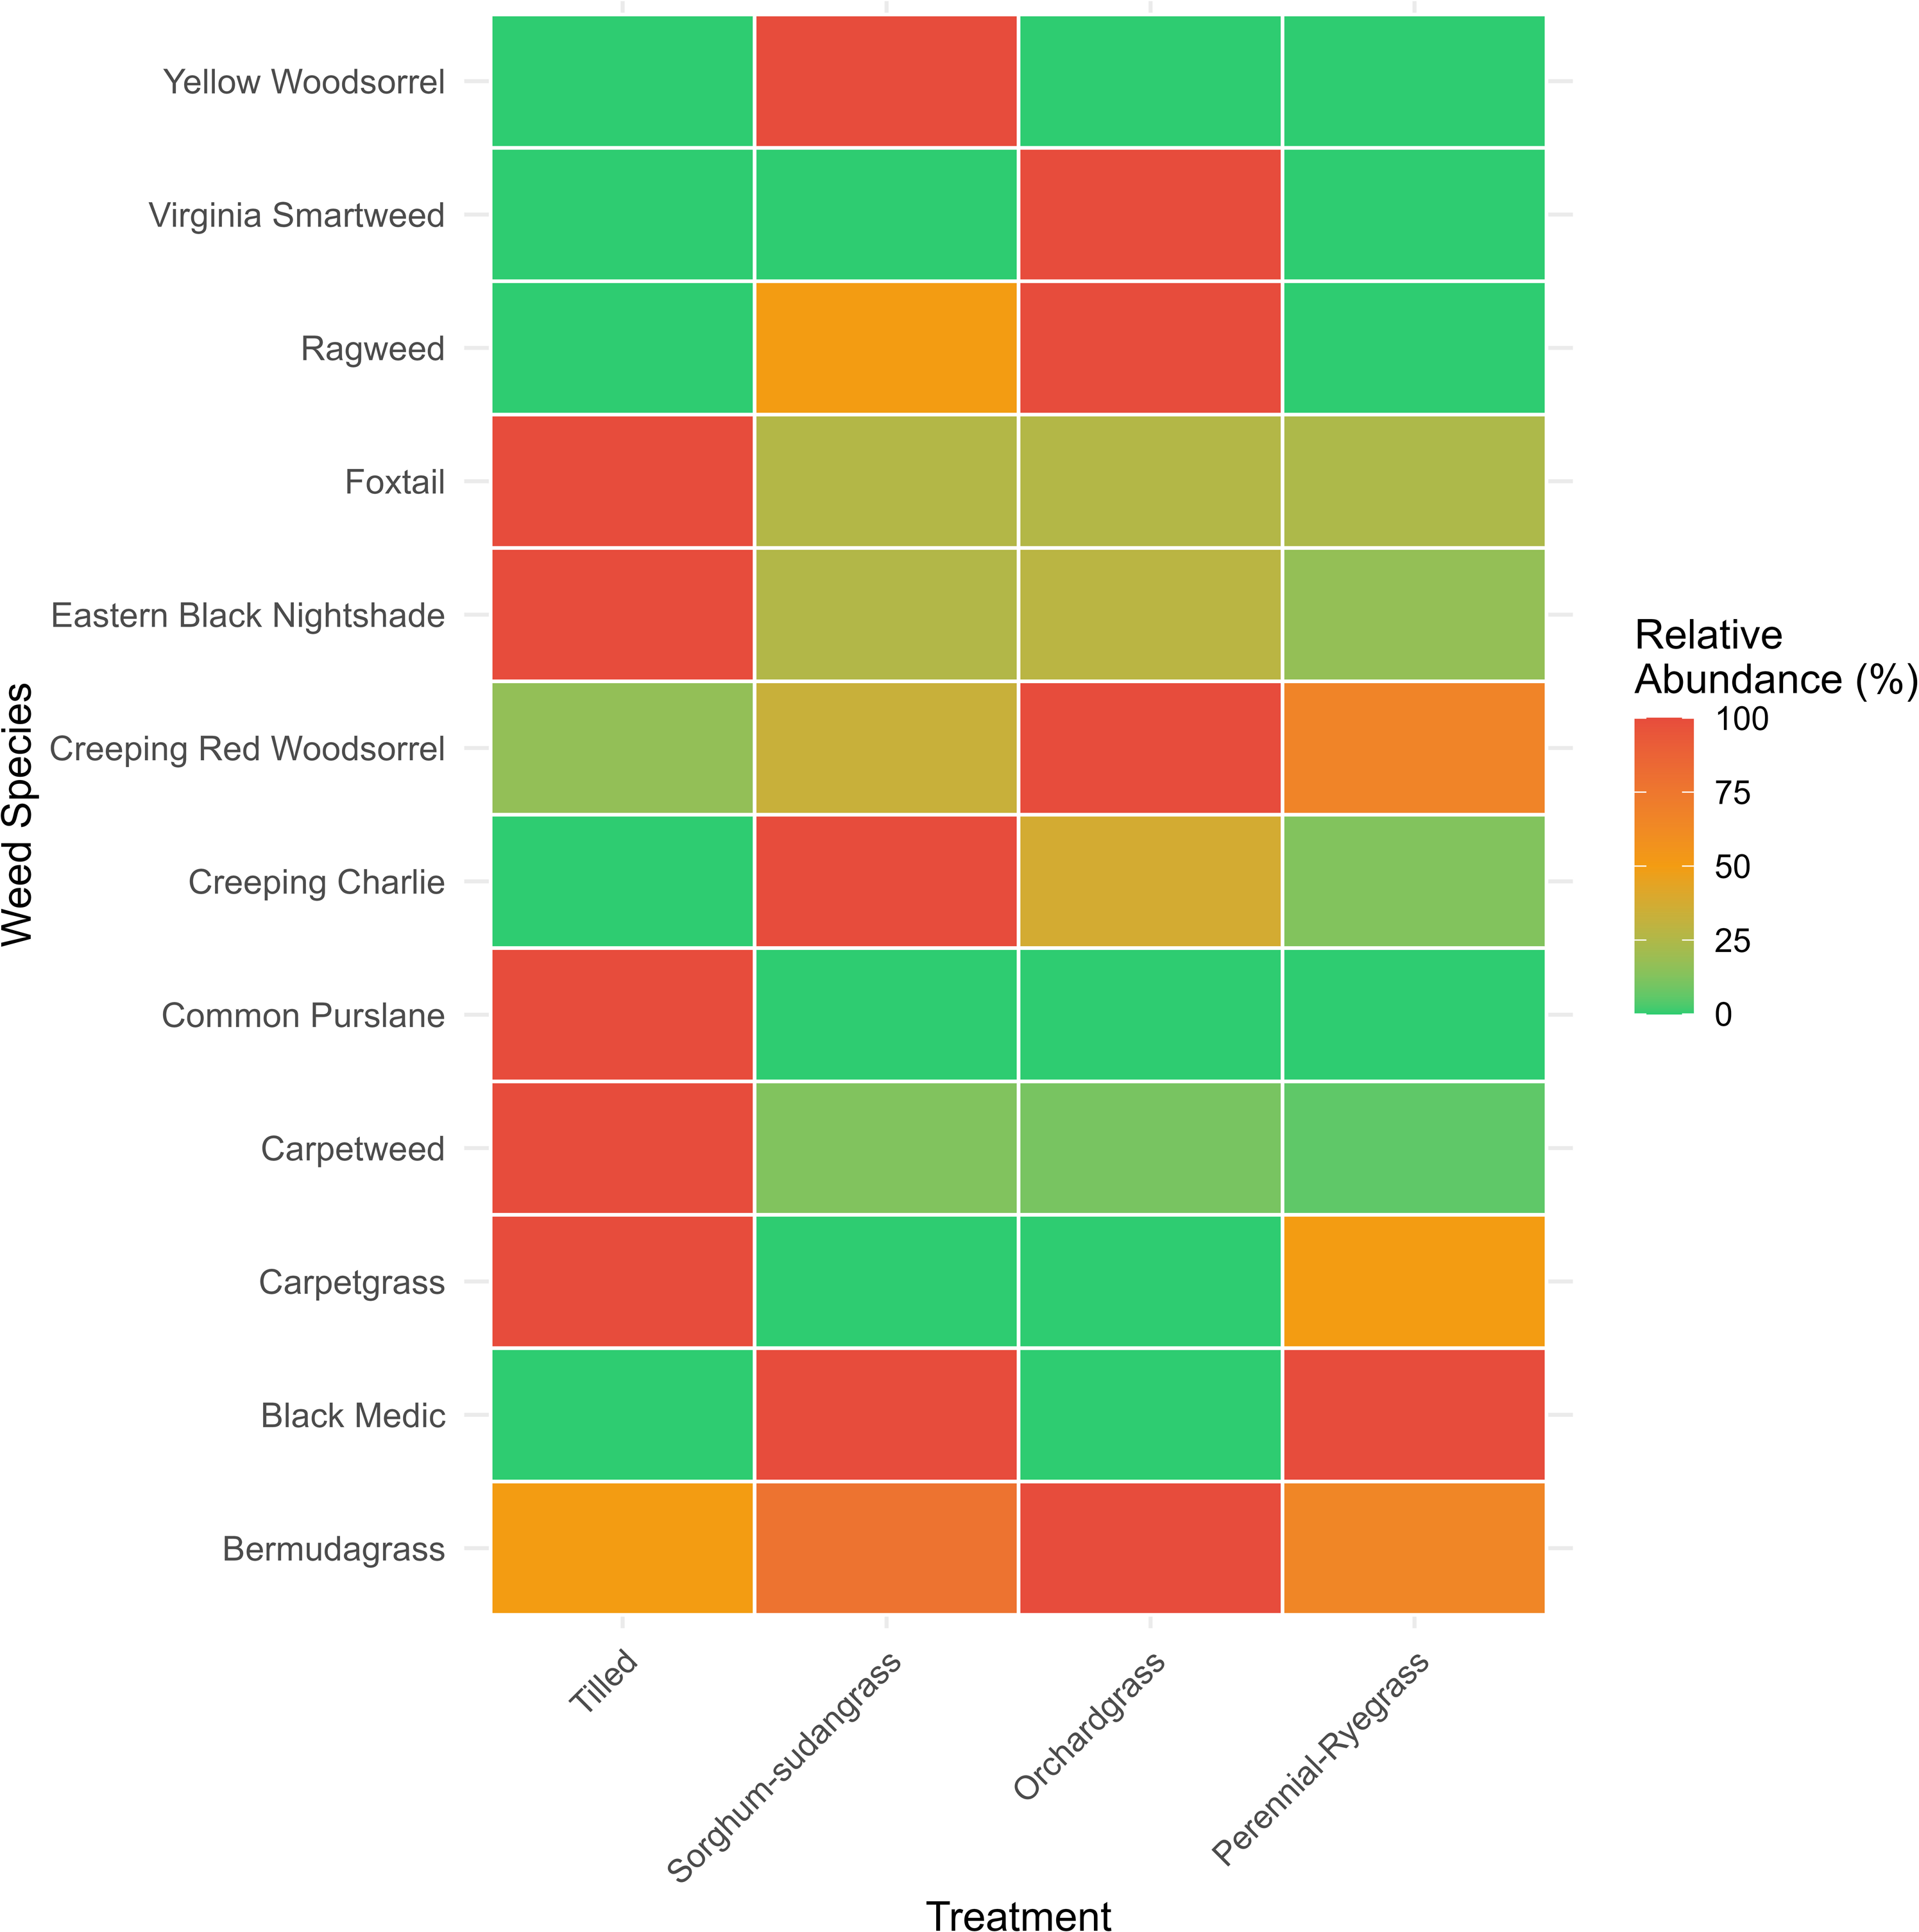
Species-level analysis within functional groups further clarified compositional patterns (Supplementary Figure S4). Carpetweed (Mollugo verticillata L.) was the overwhelmingly dominant annual broadleaf species in the tilled control and was substantially reduced under all cover crop systems. Eastern black nightshade (Solanum ptycanthum Dunal) and Virginia smartweed (Persicaria virginianum L.) also contributed to the annual broadleaf fraction in the tilled control but were largely absent or present only at trace levels under cover crops. Foxtail (Setaria spp.) dominated the annual grass fraction under tilled conditions and was similarly reduced across cover crop treatments, though reductions were less dramatic than for M. verticillata (Figure 3; Supplementary Figure S4). Bermudagrass [Cynodon dactylon (L.) Pers.] was the dominant perennial grass species and was present across all treatments at relatively consistent levels, consistent with the nonsignificant functional group response and its known adaptation to undisturbed or managed grass-dominated environments (Supplementary Figure S4). The relative abundance heatmap (Figure 3) further illustrates that species such as creeping red woodsorrel (Oxalis corniculata L.) and creeping Charlie (Glechoma hederacea L.) showed higher relative abundance in cover crop treatments compared with tilled plots, not because of increased absolute abundance, but probably because the dramatic suppression of M. verticillata and Setaria spp. in cover crop plots allowed these minor species to constitute a larger relative proportion of a much smaller seedbank. This underscores the importance of examining both absolute density and proportional composition when interpreting seedbank data in weed management research (Booth and Swanton Reference Booth and Swanton2002).
Heat map of relative weed species abundance across tilled no-cover control, sorghum-sudangrass–sweet clover, orchardgrass–red clover, and perennial ryegrass–white clover traffic pathway treatments at the Busby Organic Research Farm near Jefferson City, MO. Relative abundance was scaled within each species such that 100% represents the treatment with the highest abundance for that species. Color gradient ranges from green (0%, lowest relative abundance) to red (100%, highest relative abundance).

Figure 3. Long description
A heat map of relative weed species abundance across tilled no-cover control, sorghum-sudangrass-sweet clover, orchardgrass-red clover, and perennial ryegrass-white clover traffic pathway treatments. The heat map is structured as a grid with weed species listed on the vertical axis and treatments on the horizontal axis. The color gradient ranges from green (0%, lowest relative abundance) to red (100%, highest relative abundance). Each cell in the grid represents the relative abundance of a specific weed species under a particular treatment, scaled such that 100% represents the treatment with the highest abundance for that species. Notable trends include varying levels of weed species abundance across different treatments, with some species showing higher relative abundance in specific treatments.
Temporal Dynamics of Weed Emergence
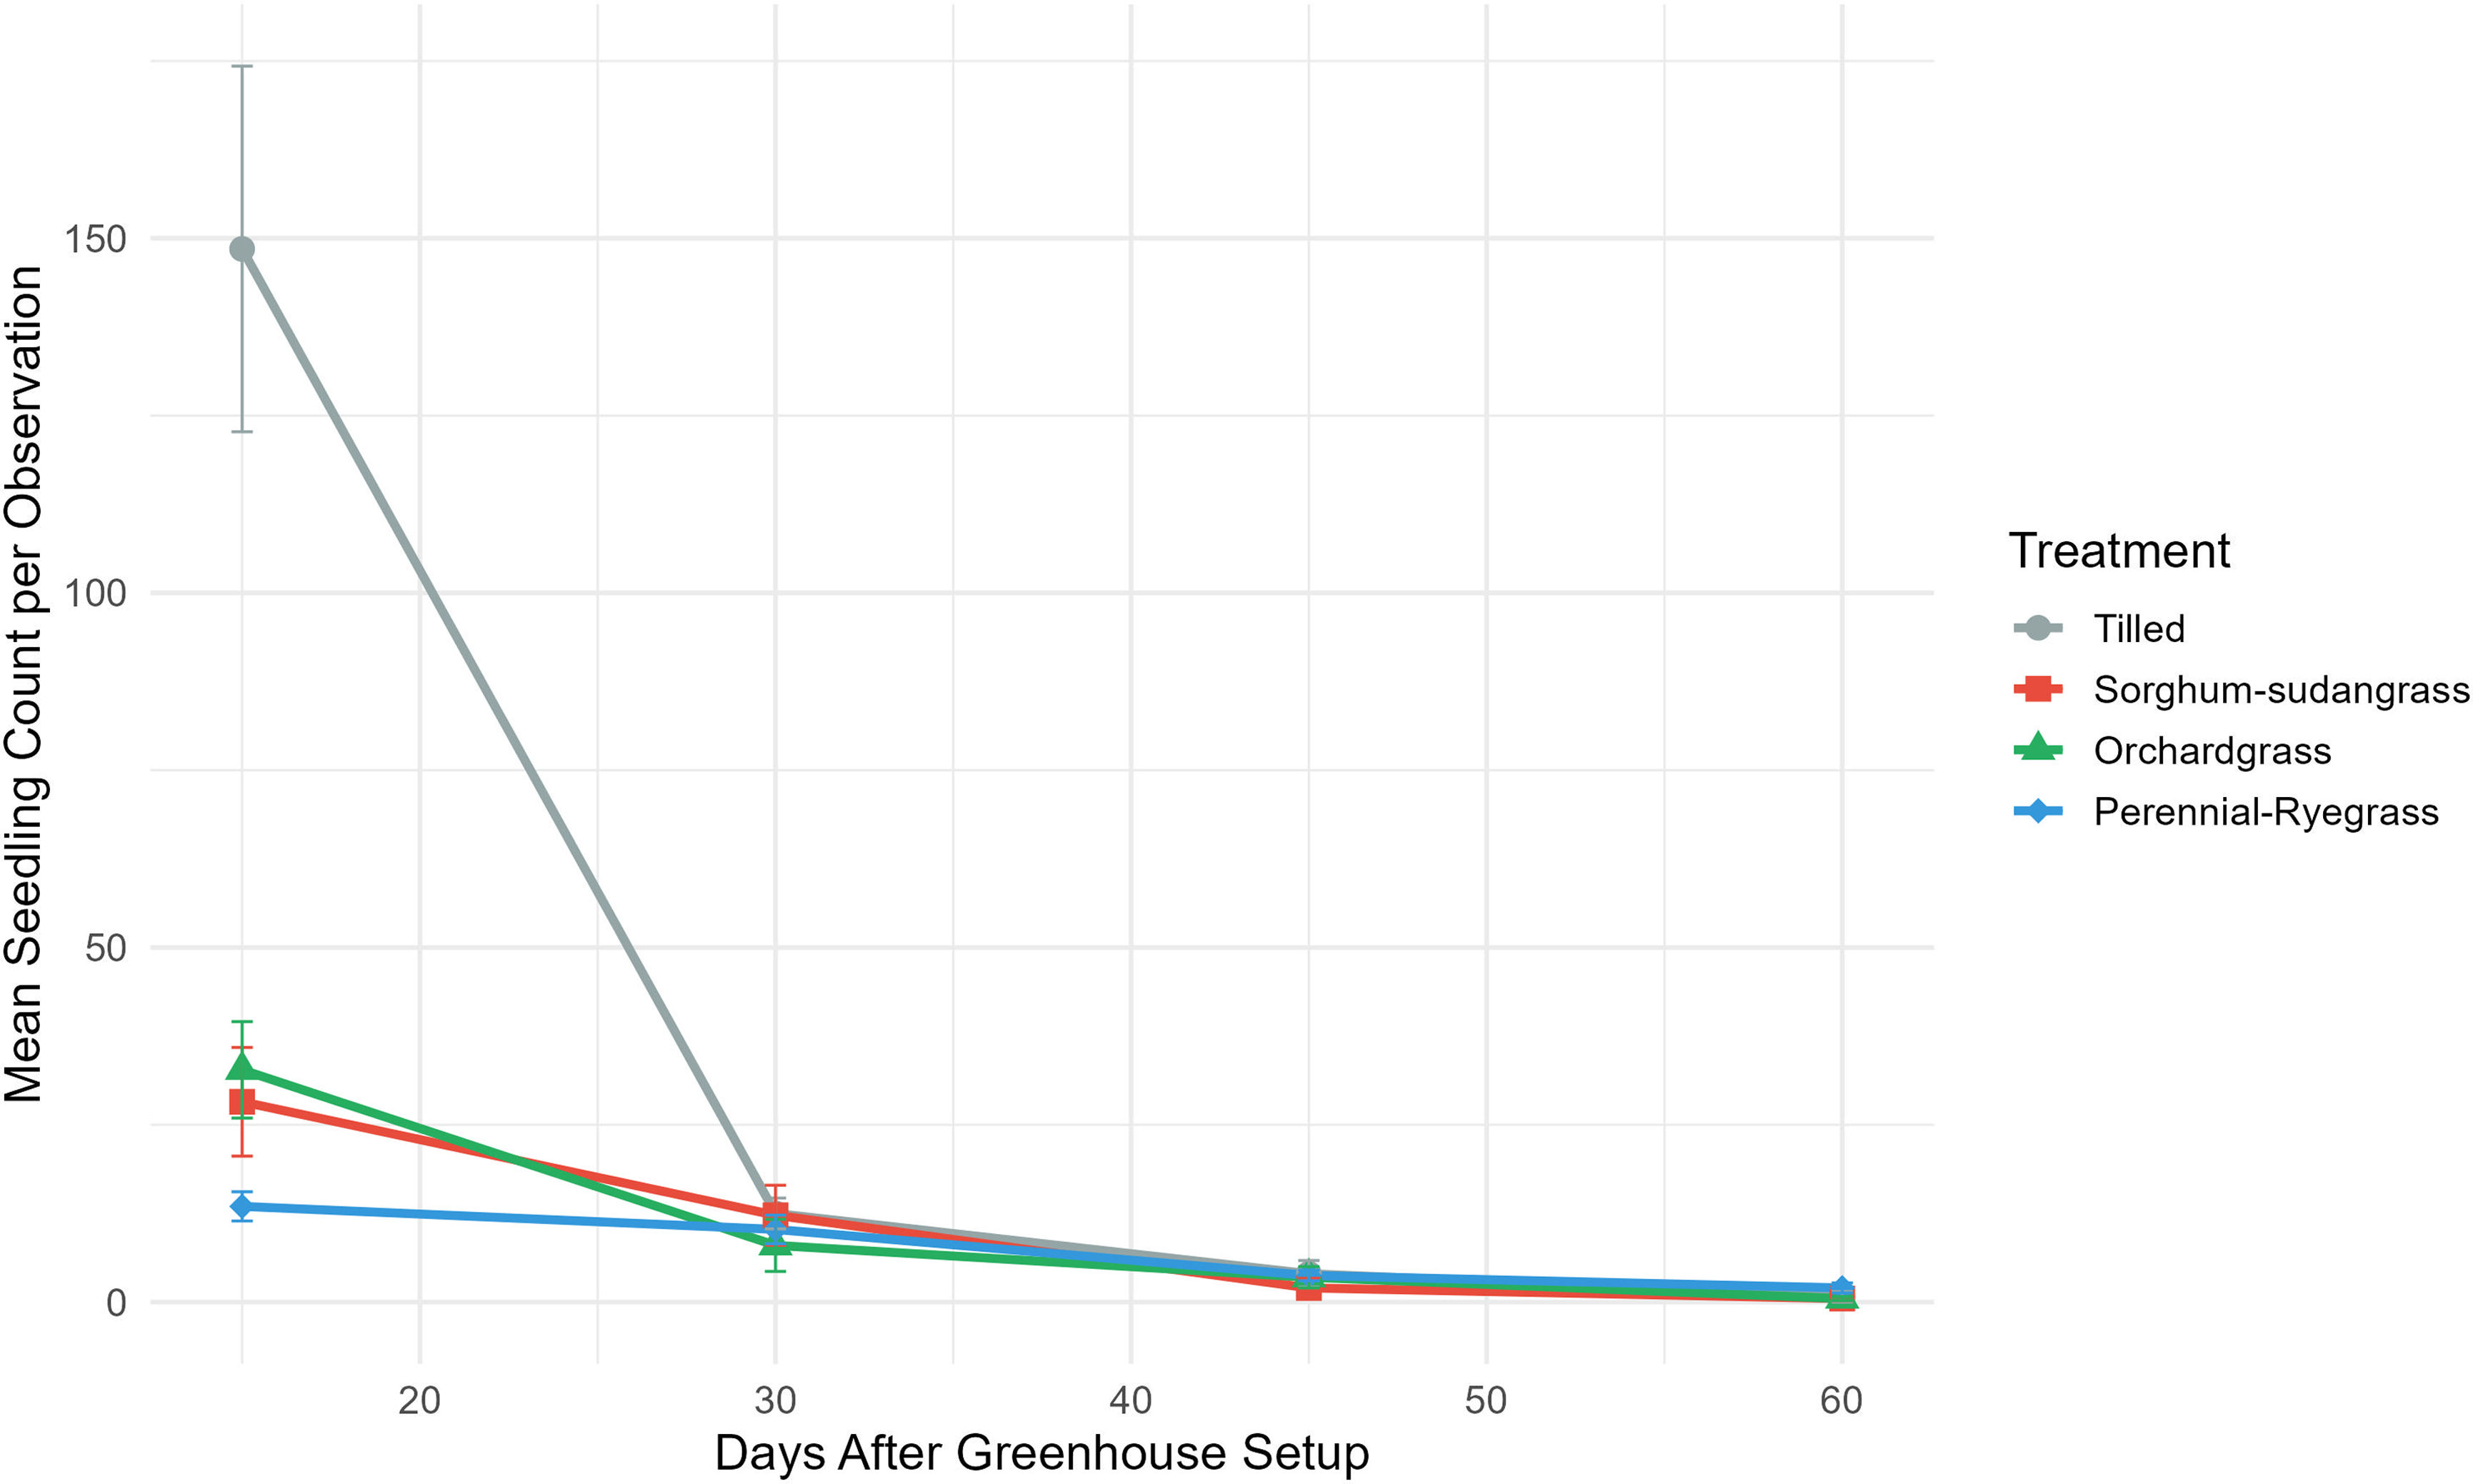
Treatment effects on weed emergence were apparent not only in total seedbank density but also in the temporal pattern of seedling recruitment across the 60-d greenhouse emergence period. Cumulative weed emergence in the tilled control diverged rapidly from all cover crop treatments, beginning at the first observation period, and remained consistently and substantially higher through day 60 (Supplementary Figure S5). By the end of the monitoring period, the tilled control had accumulated a mean cumulative emergence approximately three to four times greater than the sorghum-sudangrass–sweet clover and orchardgrass–red clover treatments, and approximately five to six times greater than perennial ryegrass–white clover, which had the lowest cumulative emergence among all treatments. The emergence rate data highlight a particularly striking difference in early-season seedling flush (Figure 4). By day 15, the tilled control had produced a mean of 148.5 new seedlings per observation period, compared with 13.5, 28.2, and 32.8 for perennial ryegrass–white clover, sorghum-sudangrass–sweet clover, and orchardgrass–red clover, respectively, representing reductions of 78% to 91% in early emergence intensity. By day 30, emergence rates had declined sharply in all treatments, with the tilled control converging toward cover crop treatment levels. Beyond day 30, all treatments exhibited low and comparable emergence rates that diminished toward zero by day 60. This convergence pattern suggests that in the tilled control, a substantial proportion of the weed seedbank consisted of a near-surface, readily germinable fraction that was stimulated by disturbance-related cues, resulting in a rapid early flush that depleted much of the germinable seed pool within the first weeks of favorable conditions (Benech-Arnold et al. Reference Benech-Arnold, Sánchez, Forcella, Kruk and Ghersa2000). In contrast, under cover crop treatments, reduced light penetration, moderated temperature fluctuations, and limited soil disturbance likely constrained activation of this shallow, disturbance-responsive seed fraction, thereby suppressing early recruitment and reducing cumulative emergence (Mirsky et al. Reference Mirsky, Gallandt, Mortensen, Curran and Shumway2010; Travlos et al. Reference Travlos, Gazoulis, Kanatas, Tsekoura, Zannopoulos and Papastylianou2020). It should be noted that the temporal emergence patterns described here reflect the behavior of the readily germinable warm-season seedbank fraction under controlled greenhouse conditions and may not directly replicate field emergence dynamics, which are influenced by soil temperature fluctuations, moisture variability, and species-specific dormancy cycling.
Mean new weed seedling emergence per observation period over a 60-d greenhouse bioassay under tilled no-cover control, sorghum-sudangrass–sweet clover, orchardgrass–red clover, and perennial ryegrass–white clover traffic pathway treatments at the Busby Organic Research Farm near Jefferson City, MO. Values represent new seedlings recorded at each observation period (15, 30, 45, and 60 d after greenhouse setup) and are not cumulative. Error bars represent 1 standard error of the mean.

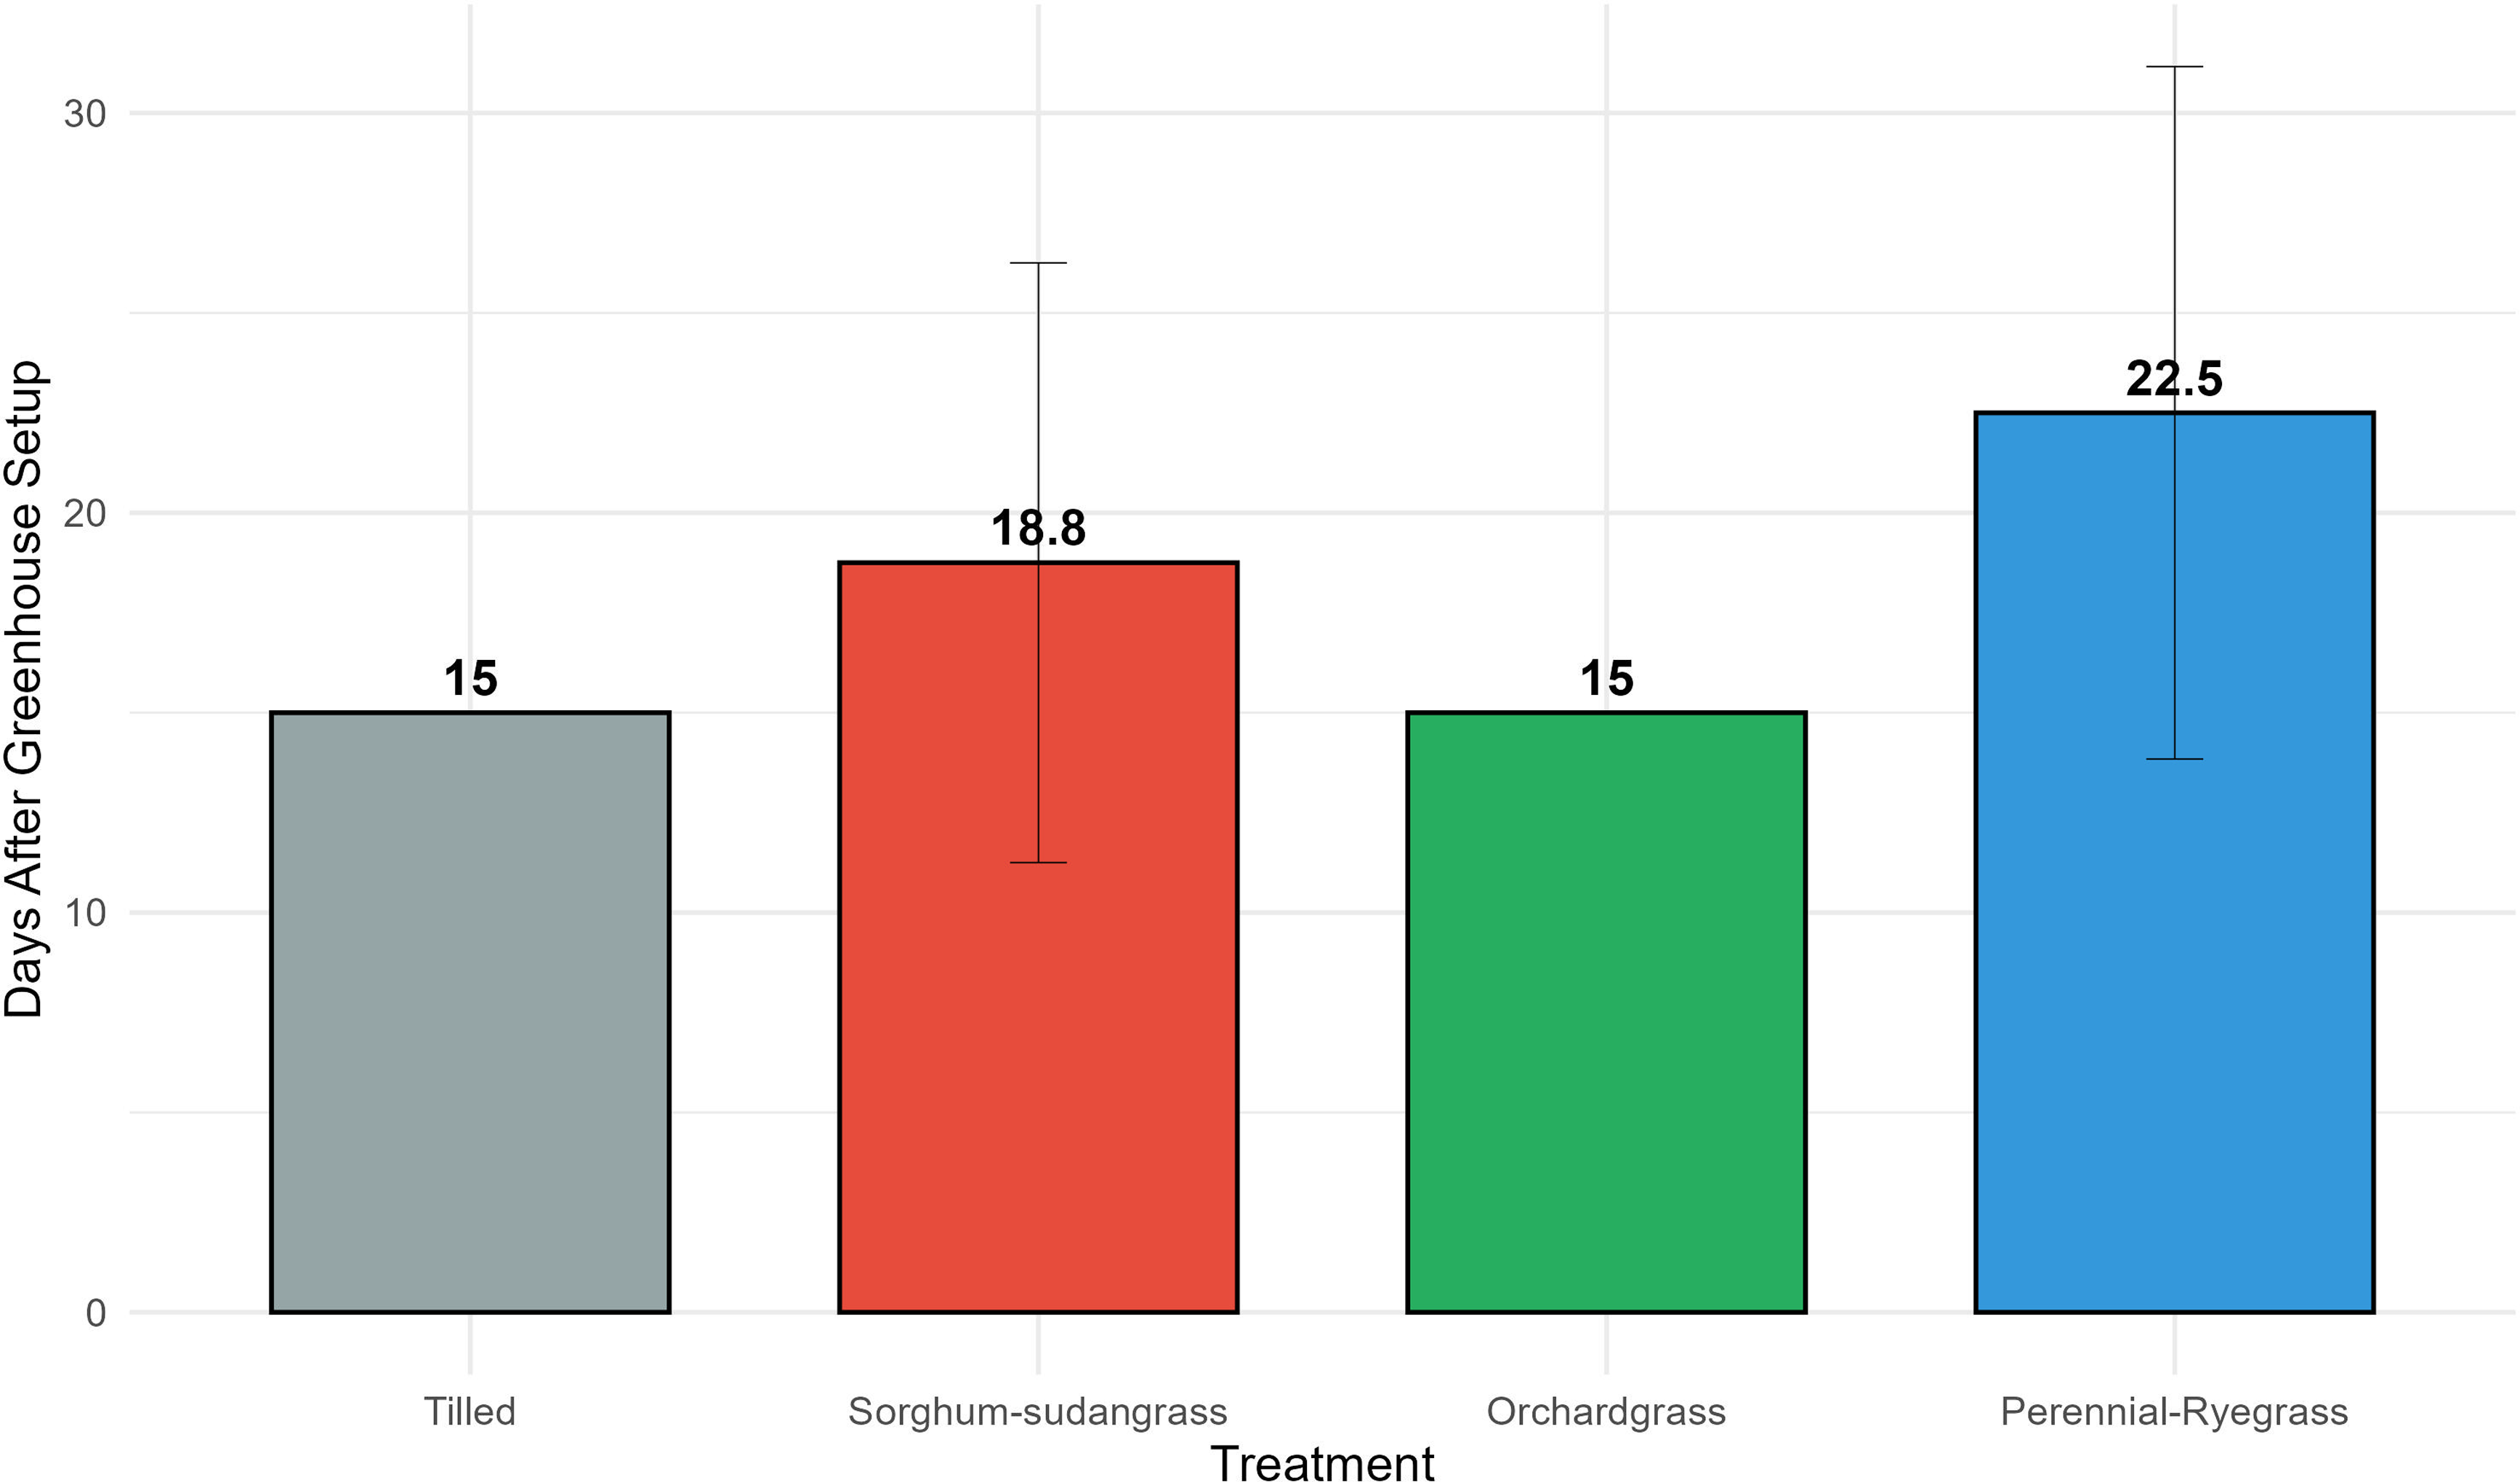
Average peak emergence timing differed among treatments in a manner consistent with the mechanisms of cover crop suppression (Figure 5). The tilled control and orchardgrass–red clover treatment both exhibited peak emergence by day 15, the earliest observation period, indicating immediate and intense recruitment from the available seedbank. Sorghum-sudangrass–sweet clover peaked at around day 19, while perennial ryegrass–white clover exhibited the latest peak by day 22 (Figure 5). The delayed peak emergence under perennial ryegrass–white clover suggests that this treatment reduced the availability of near-surface safe sites for recruitment by dampening germination cues such as light penetration and temperature fluctuations (Gallandt Reference Gallandt2006) and increasing the physical and biological constraints at the soil surface such as persistent cover and litter (Teasdale and Mohler Reference Teasdale and Mohler1993), thereby slowing early recruitment relative to the other treatments (Page et al. Reference Page, Gallagher, Kemanian, Zhang and Fuerst2006). However, given the high variability associated with peak timing under perennial ryegrass–white clover (Figure 5), this interpretation should be treated cautiously and warrants confirmation in future studies examining soil temperature, moisture, and light transmission differences among treatments.
Mean day of peak weed seedling emergence during a 60-d greenhouse bioassay under tilled no-cover control, sorghum-sudangrass–sweet clover, orchardgrass–red clover, and perennial ryegrass–white clover traffic pathway treatments at the Busby Organic Research Farm near Jefferson City, MO. Peak emergence day was defined as the observation period at which the highest number of new seedlings was recorded for a given replicate. Values above bars indicate the treatment mean. Error bars represent 1 SD.

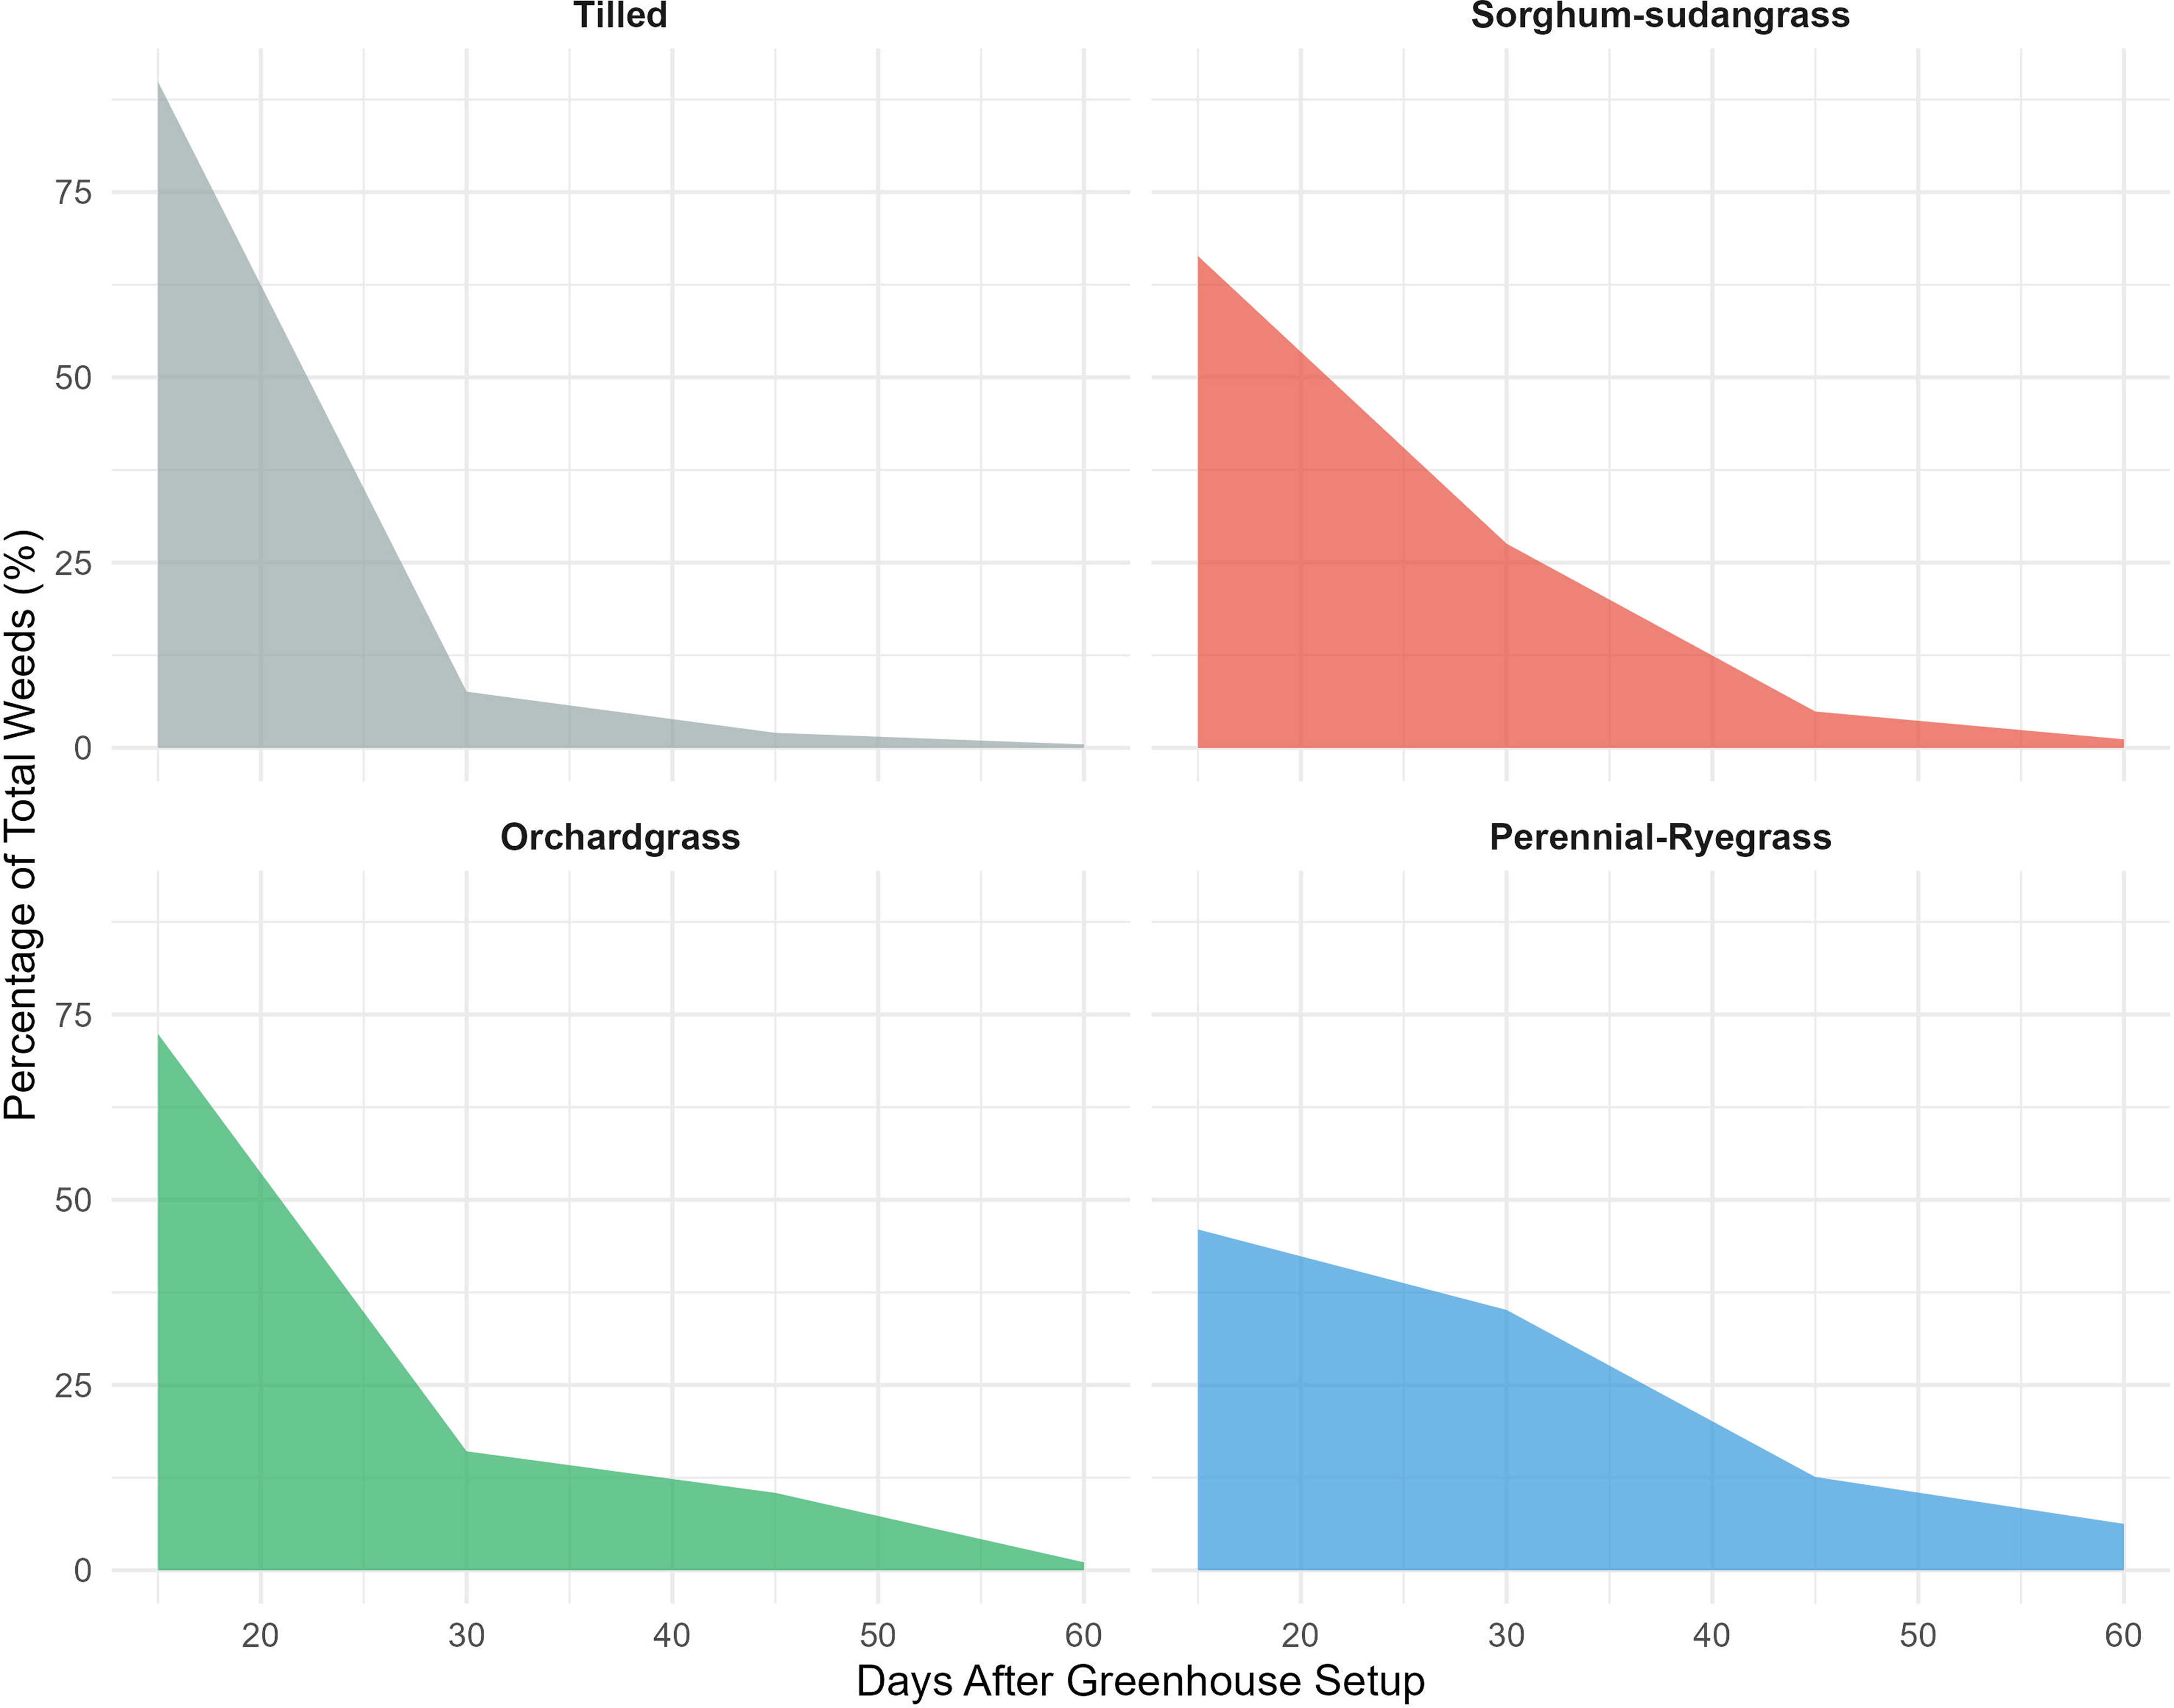
Analysis of the temporal distribution of emergence as a proportion of total seedlings emerging at each observation period further illustrates the concentrated versus distributed nature of weed recruitment under contrasting treatments (Figure 6). In the tilled control, approximately 88% of all seedlings emerged at the first observation period, indicating a highly front-loaded emergence profile. In contrast, sorghum-sudangrass–sweet clover, orchardgrass–red clover, and perennial ryegrass–white clover showed more gradual temporal distributions, with first-period proportional emergence of approximately 65%, 72%, and 46%, respectively (Figure 6). The broadly distributed emergence profile under perennial ryegrass–white clover is agronomically significant—that is, while individual emergence events are small in absolute terms, the spread of emergence over a longer period may complicate timing of mechanical or cultural weed management interventions in integrated organic systems. Conversely, the more concentrated and dramatically suppressed emergence under all cover crop treatments relative to the tilled control affirms the practical value of traffic pathway cover cropping as a viable strategy for managing the summer-annual component of the weed seedbank during organic vegetable transition.
Temporal distribution of weed seedling emergence expressed as the percentage of total seedlings emerging at each observation period (15, 30, 45, and 60 d after greenhouse setup) during a 60-d greenhouse bioassay under tilled no-cover control, sorghum-sudangrass–sweet clover, orchardgrass–red clover, and perennial ryegrass–white clover traffic pathway treatments at the Busby Organic Research Farm near Jefferson City, MO. Each panel represents a single treatment. Shaded areas illustrate the distribution of proportional emergence across the monitoring period.

Implications for Organic Vegetable Production and Future Research
The results of this study collectively demonstrate that establishment of grass–legume cover crop bicultures as living mulches in traffic pathways during transition to certified organic vegetable production substantially reduced the readily germinable warm-season weed seedbank. This suppressive effect appeared to operate primarily through reductions in annual weed species, particularly annual broadleaf taxa, which are widely reported as dominant and problematic components of weed communities in organic vegetable production systems (Mennan et al. Reference Mennan, Jabran, Zandstra and Pala2020; Mohler et al. Reference Mohler, Caldwell, Marschner, Cordeau, Maqsood, Ryan and DiTommaso2018). Suppression of this functional group is consistent with evidence that continuous surface cover and residue-mediated microclimate modification reduce recruitment from the shallow, disturbance-responsive seed fraction that characterizes many annual weeds (Gallandt Reference Gallandt2006; Mirsky et al. Reference Mirsky, Gallandt, Mortensen, Curran and Shumway2010; Teasdale and Mohler Reference Teasdale and Mohler1993). The equivalence among perennial and annual cover crop systems in their effectiveness to suppress weed seedbanks during the 3 yr of transition period is an important practical finding, as it indicates that producers need not restrict their cover crop selection to perennial species to achieve seedbank management benefits. Annual cover crop bicultures that include summer-productive species such as sorghum-sudangrass and white sweet clover may be advantageous in certain management contexts, because they are generally easier to terminate and can be more readily integrated within diversified vegetable rotations. Notably, cover crop biomass data from this site (Karki Reference Karki2024; Table 2) revealed that sorghum-sudangrass–sweet clover produced significantly lower dry biomass (5.02 Mg ha⁻1) than perennial ryegrass–white clover (9.90 Mg ha⁻1) and orchardgrass–red clover (8.96 Mg ha⁻1), yet achieved equivalent weed seedbank suppression. This suggests that biomass quantity alone did not determine suppressive capacity within this system, as weed suppression by cover crop residues may also involve complementary mechanisms such as physical mulch effects and allelopathic interference (Sias et al. Reference Sias, Wolters, Reiter and Flessner2021; Teasdale et al. Reference Teasdale, Brandsaeter, Calegari, Neto, Upadhyaya, Blackshaw, Upadhyaya and Blackshaw2007), or differences in canopy architecture and ground cover continuity may have contributed to suppression independently of total biomass production. In contrast, perennial cover crop mixtures, while potentially less flexible operationally, have been associated with additional soil health improvements at this site (Karki Reference Karki2024). Also, the multiyear nature of perennial cover crops is expected to create a stable environment that is conducive to attracting beneficial insects. Together, these findings support traffic pathway cover cropping as a dually functional management tool that addresses both weed management and soil health objectives simultaneously during organic transition, and they provide empirical evidence to guide cover crop selection decisions for smallholder vegetable producers in Missouri and similar agroecosystems.
This study should be interpreted within several methodological and temporal limitations. The germinable seedbank approach quantifies only the fraction of viable seeds capable of emergence under favorable greenhouse conditions and does not capture dormant or deeply buried seeds that may contribute to future recruitment. Seedbank sampling was conducted at a single time point, representing cumulative treatment effects but not seasonal variation in seed deposition or dormancy cycling. Additionally, greenhouse emergence conditions, while standardized, may not fully replicate field microclimatic variability influencing in situ weed recruitment. Finally, the study encompassed a 3-yr organic transition period, and longer-term evaluations are needed to determine whether observed suppression trends persist, intensify, or shift under extended management horizons. Additionally, the greenhouse bioassay employed a constant warm temperature (28 C ± 5 C) without dormancy-breaking treatments, meaning that the results capture the readily germinable warm-season fraction of the weed seedbank rather than the total viable seedbank. Cool-season species and deeply dormant seeds were likely underrepresented, and results should be interpreted within this methodological scope. Future research should evaluate whether the seedbank-suppression trends documented here are sustained or amplified beyond the 3-yr transition window, and whether differences among cover crop systems emerge over longer production horizons. Likewise, future studies should consider variable temperature germination regimes, stratification treatments, or complementary field-based emergence monitoring to capture a broader spectrum of seedbank diversity and provide a more complete picture of cover crop effects on weed community dynamics across seasons. Additionally, investigation of the mechanisms underlying cover crop-mediated seedbank suppression, including the relative contributions of allelopathy, physical light interception, soil microclimate modification, and microbial seed decay, would strengthen the ecological basis for cover crop recommendations in organic vegetable production systems.
This study demonstrates that living grass–legume cover crop bicultures established in traffic pathways and tolerant of repeated mowing effectively suppressed the readily germinable warm-season weed seedbank during the transition to certified organic vegetable production under Missouri’s edaphic and climatic conditions. All three cover crop treatments investigated in this study (perennial ryegrass–white clover, orchardgrass–red clover, and sorghum-sudangrass–white sweet clover) reduced total seedbank density by 73% to 82% relative to the tilled fallow control after 3 yr of establishment, with no significant differences among cover crop treatments. This equivalence in suppressive capacity between annual and perennial cover crop systems provides producers with flexibility in cover crop selection without compromising weed seedbank management outcomes. The suppressive effect of traffic pathway cover crops operated primarily through the reduction of annual broadleaf and annual grass functional groups, which were the dominant components of the seedbank under the tilled fallow control. Species-level analysis identified M. verticillata and Setaria spp. as the principal species suppressed by cover cropping, while perennial grass and broadleaf components of the seedbank were unaffected by treatment. Weed species richness did not differ among treatments, suggesting that cover crops reduced seed abundance without eliminating species from the community within the time frame of this study.
Temporal emergence analyses further revealed that the tilled fallow control produced an intense and highly concentrated early emergence flush, with approximately 88% of total seedlings emerging within the first 15 d of the greenhouse bioassay. Cover crop treatments substantially dampened this early flush and distributed emergence more evenly across the 60-d monitoring period, with perennial ryegrass–white clover mixture exhibiting the most delayed peak emergence timing. These temporal differences have direct practical implications for the scheduling of mechanical and cultural weed management interventions in organic vegetable production systems. Collectively, these findings support the integration of cover crops into traffic pathways as an effective and scalable weed seedbank management strategy during organic vegetable transition. The approach is particularly well suited to smallholder organic producers in Missouri and similar agroecosystems, where weed pressure is a primary barrier to successful adoption of organic production practices.
Supplementary material
To view supplementary material for this article, please visit https://doi.org/10.1017/wsc.2026.10136
Data availability statement
All data generated or analyzed during this study are included in this article or in the Supplementary Material.
Acknowledgments
The authors thank the Alan T. Busby Research Farm personnel for their help in completing this project. The authors declare that AI tools were used solely for language editing and grammar refinement. All scientific content, data, analyses, and conclusions were generated and verified by the authors.
Funding statement
The study reported here is financially supported by the Organic Transitions Grant (award no. 2021-51106-35674) and Evans-Allen Capacity Grants Program (accession no. 7005914), from the U.S. Department of Agriculture’s National Institute of Food and Agriculture.
Competing interests
The authors declare no competing interests.


 Open access

