I. INTRODUCTION
Nowadays, semiconductor photocatalysis, as an effective approach for destruction of highly toxic molecules and remediation of environmental pollutants, is attracting more and more attention.Reference Sun, Bai, Liu, Jin and Xu1, Reference Hoffmann, Martin, Choi and Bahnemann2 Thanks to its advantages such as low cost, nontoxicity, and high stability, titanium dioxide (TiO2) is one of the most extensively investigated and most widely used semiconductor photocatalyst. However, TiO2 has a wide-band gap, which limits its photoresponse to the visible light and seriously hampers its wide application. To overcome this drawback, many researchers have made great efforts to extend the photoresponse of TiO2-based systems further into the visible light region, which involves cationic doping,Reference Young, Lim, Chiang, Scott and Amal3–Reference Dunnill, Ansari, Kafizas, Perni, Morgan, Wilson and Parkin5 anionic nonmetal doping,Reference Asahi, Morikawa, Ohwaki, Aoki and Taga6–Reference Yin, Ihara, Aita, Komatsu and Sato9 and sensitization by narrow band gap semiconductors.Reference Chong, Suresh, Xia, Al-Salim and Idriss10, Reference Li, Kako and Ye11 As a focus in this respect, N-doped TiO2 is the most promising material with high photoactivity for visible light,Reference Yang, Jiang, Shi, Xiao and Yan12–Reference Randorn and Irvine14 and it is commonly prepared by sintering TiO2 powders directly in flowing ammonia gas at elevated temperatures. For example, Irie et al.Reference Irie, Watanabe and Hashimoto15 prepared TiO2−xNx powders with N concentrations of 0.5, 1.1, and 1.9 at.% by annealing anatase TiO2 powder under NH3 flow at 550, 575, and 600 °C, respectively. Asahi et al.Reference Asahi, Morikawa, Ohwaki, Aoki and Taga6 prepared TiO2−xNx powders containing a total N concentration of about 1 at.% by annealing TiO2 powder in the mixed gas of NH3 and Ar (volume ratio 67%:33%) at 550–600 °C. Another frequently used synthesis route of N-doped TiO2 is wet chemical method, which involves the hydrolysis of Ti- and N-containing precursors and follow-up sintering of the hydrolyzed product at elevated temperatures in air. For example, Ihara et al.Reference Ihara, Miyoshi, Iriyama, Matsumoto and Sugihara16 fabricated visible-active TiO2 photocatalyst with a N concentration of 0.20 at.% by calcinating the hydrolyzed product of Ti(SO4)2 at 400 °C in air. Qiu and BurdaReference Qiu and Burda17 and Zhu et al.Reference Zhu, Qiu, Iancu, Chen, Pan, Wang, Dimitrijevic, Rajh, Meyer, Paranthaman, Stocks, Weitering, Gu, Eres and Zhang18 synthesized N-doped TiO2 and Cr–N codoped TiO2 nanocrystals with a N concentration of 8% by the hydrolysis of titanium (IV) tetra-isopropoxide in the presence of ethylenediamine as the N source and chromium acetylacetonate as the Cr source.
Thanks to the research at-depth on nanotube titanic acid (NTA) and titanate, a novel approach has recently been developed for preparing N-doped TiO2 nanomaterials with titanate nanotubes as the precursors.Reference Feng, Wang, Jin, Zhang, Zhang, Wu and Zhang19–Reference Chang, Tsai, Chiu, Liu, Chao and Lin24 For example, Feng et al.Reference Feng, Wang, Jin, Zhang, Zhang, Wu and Zhang19 prepared N-doped anatase TiO2 by thermal treatment of NTA in a NH3 flow at 400, 500, and 600 °C, respectively. Jiang et al.Reference Jiang, Yang, Luo, Chu, Sun, Shi, Xiao and Edwards20 synthesized N-doped anatase TiO2 nanotubes through a solvothermal treatment of protonated titanate nanotubes in the mixed solution of NH4Cl/ethanol/water and found that only ammonia chloride as nitrogen source could promote the formation of anatase phase, while chloride ion might play a particular key role for the formation of crystalline TiO2 nanotubes and the transition from titanate to TiO2 at low temperature. Using H2Ti3O7 nanobelts as the precursors, Wang et al.Reference Wang, Tafen, Lewis, Hong, Manivannan, Zhi, Li and Wu21 prepared N-doped TiO2 nanobelts by sintering anatase TiO2 nanobelts in a NH3 flow at 525, 550, 575, and 600 °C, respectively. Wang et al.Reference Wang, Feng, Zhang, Yang and Zhang22 prepared three kinds of N-doped TiO2 samples by annealing NTA, raw P25 TiO2, and novel TiO2 (obtained after 2 h heat treatment of NTA at 600 °C in air) in a NH3 flow at 600 °C for 4 h and acquired doped N concentration of about 1 at.%. Ou et al.Reference Ou, Lo and Liao23 prepared N-doped TiO2 by thermally treating titanate nanotubes (NaxH2−xTi3O7) in an Ar/NH3 atmosphere and obtained a maximum N atomic concentration of 3.37%. Moreover, Chang et al.Reference Chang, Tsai, Chiu, Liu, Chao and Lin24 prepared N-doped TiO2 nanotubes by annealing ammonium trititanate nanotubes [(NH4)2Ti3O7] and acquired a maximum N atomic concentration of 3.8% after calcination at 100 °C.
As above-mentioned, there have been numerous studies on the fabrication and catalytic performance of N-doped TiO2. The origin of the visible light activity in N-doped TiO2, unfortunately, still remains unknown and disputable as well, though many researchers have suggested different viewpoints to reveal such an origin in relation to the nature and concentration of N-doped species as well as defects such as oxygen vacancies and Ti3+ ions formed during the doping process. To name a few, Asahi et al.Reference Asahi, Morikawa, Ohwaki, Aoki and Taga6 claimed that doped N substituted O in anatase TiO2 and yielded a narrowing of band gap driven by mixing N 2p states with O 2p states. Irie et al.Reference Irie, Watanabe and Hashimoto15 argued that N atom formed a donor state just above the top of the valence band, resulting in enhanced visible light photoactivity of N-doped TiO2. However, Ihara et al.Reference Ihara, Miyoshi, Iriyama, Matsumoto and Sugihara16 suggested that it was oxygen vacancies caused by N doping that contributed to the visible light activity. Livraghi et al.Reference Livraghi, Paganini, Giamello, Selloni, Valentin and Pacchioni25 found that N-doped TiO2 contained single atom N impurities forming diamagnetic or paramagnetic centers, promoting transition of electrons from the band gap localized (N donor) states to the conduction band or to surface-absorbed electron scavengers, which was responsible for the visible light activity. In addition, Wang et al.Reference Wang, Feng, Zhang, Yang and Zhang22 proposed that the visible light photocatalytic activity of N-doped TiO2 was originated from the N 2p levels near the valence band, and Ti3+ species created during the N-doping process acted as recombination centers for the photoinduced electrons and holes in TiO2.
Bearing those perspectives in mind and noticing that titanate nanotube with a large specific surface area and good ion exchange ability is a promising precursor for preparing N-doped TiO2 nanomaterials with a high doped N concentration,Reference Chang, Tsai, Chiu, Liu, Chao and Lin24, Reference Sun and Li26 we adopt sodium titanate nanotube (STN) as a precursor to prepare N-doped TiO2 nanomaterials. Desired N-doped TiO2 samples are thus obtained by ion exchange of STN with aqueous NH4Cl and follow-up sintering of the ion-exchanged product in air. The formation mechanism of N-doped TiO2 samples obtained at various sintering temperatures is discussed, and their structure is characterized, which, hopefully, is to add to knowledge about the origin of the photocatalytic activity of N-doped TiO2 in the visible light region.
II. EXPERIMENTAL
A. Preparation of STNs
The method reported in literature was adopted to prepare STNs.Reference Yang, Jin, Wang, Li, Zhang, Zhang, Guo and Zhang27 Briefly, a 500-mL polytetrafluoroethylene (PTFE) bottle equipped with a reflux condenser was charged with 300 mL of aqueous solution of 10 M NaOH and heated in an oil bath. Then, 6 g of TiO2 powder was introduced into the PTFE bottle under magnetic stirring. Resultant dispersion was allowed to react at 120 °C for 24 h, followed by cooling to room temperature in air and repeated diluting with distilled water to a pH of 12. Desired STN [Na2Ti2O4(OH)2] powder was obtained after as-diluted dispersion was filtered and dried at 65 °C under vacuum (−0.1 MPa) for 48 h in an oven.
B. Synthesis of N-doped TiO2 nanomaterials
200 mL of aqueous solution of 0.5 M NH4Cl was prepared under 20 min of ultrasonic vibration. Into resultant NH4Cl solution was added 0.24 g of as-dried STN powder. Resultant mixture was ultrasonically vibrated for 30 min to reach homogeneous mixing. After 3 h of ion exchange reaction, the reactant mixture was repeatedly washed with distilled water to remove Cl−. As-washed dispersion was then filtered, and resultant filtered solid was sintered for 3 h in a quartz tube oven at 100, 200, 300, 400, 500, and 600 °C (heating rate: 20 °C/min), respectively, yielding six N-doped TiO2 samples denoted as N–TiO2-1, N–TiO2-2, N–TiO2-3, N–TiO2-4, N–TiO2-5, and N–TiO2-6 (here, numerical suffixes 1, 2, 3, 4, 5, and 6 refer to aforementioned sintering temperatures).
C. Reagents and characterization
P25 TiO2 nanopowder (composed of anatase and rutile phase TiO2 with a mass ratio of 4:1; the particle diameter is about 20–30 nm) was purchased from Degussa Company in Germany. Both analytically pure NaOH and NH4Cl were provided by Tianjin Kemiou Chemical Reagents Factory (Tianjin, China).
The crystal structure of the products was examined with a X’Pert Philips x-ray powder diffractometer (Eindhoven, Netherlands; XRD, Cu Kα radiation, λ = 1.54056 Å, 2θ range 5°–80°, step size 0.02°, accelerating voltage 40 kV, applied current 40 mA). The morphology and size of the precursor and N-doped TiO2 nanomaterials were analyzed with a JEM-2010 transmission electron microscope (TEM; JEOL Corporation, Tokyo, Japan), where the bright-field TEM images, high-resolution transmission electron microscope (HRTEM) images, and selected area electron diffraction (SAED) patterns were recorded at an accelerating voltage of 200 kV. X-ray photoelectron spectroscopic (XPS) data were collected with a Kratos AXIS Ultra photoelectron spectrometer (Manchester, UK; excitation source: monochromatized Al Kα radiation, hν = 1486.6 eV; 15 kV, 10 mA). The binding energy of hydrocarbon (C 1s: 284.8 eV) was used as an internal standard for the correction of binding energy shift. During acquisition of XPS data, the pressure in the analysis chamber was kept at about 5 × 10⁻⁹ Torr. A Nicolet AVATAR360 Fourier transform infrared spectrometer (FTIR; Thermo Scientific, Waltham, MA) was performed to record the FTIR data of the precursor and sintered products, where to-be-tested precursor and sintered products were separately mixed with KBr powder (volume ratio about 1:1) and pressed into pellets. Moreover, N-doped TiO2 nanomaterial calcined at 100 °C was adopted as an example for thermogravimetric analysis (TGA) and differential thermal analysis (DTA), which was conducted with a TGA/SDTA851e Instrument (Mettler Toledo Company, Tiel, Netherlands; heating rate 10 °C/min from room temperature to 1000 °C). The ultraviolet–visible light (UV–vis) diffuse reflectance spectra of the products were obtained with a Hitachi U-4100 UV–vis spectrometer (Tokyo, Japan) equipped with a BaSO4 integrating sphere as the reference. The room temperature photoluminescence (PL) spectra of the products were recorded with a SPEX F-212 spectrometer.
III. RESULTS AND DISCUSSION
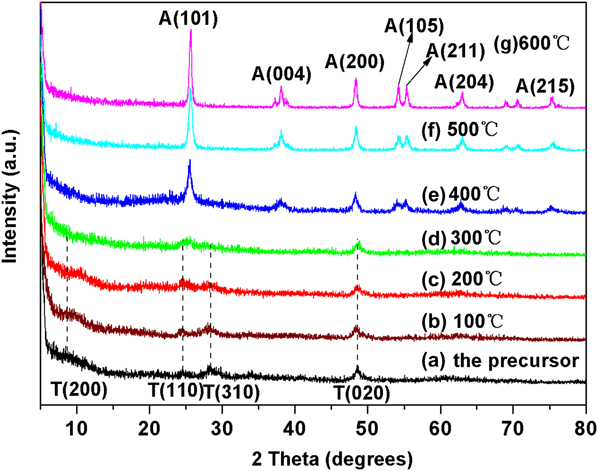
Figure 1 shows the XRD patterns of STN (a) and N-doped TiO2 nanomaterials (b–g). As-obtained STN shows characteristic diffraction peak of orthorhombic system (JCPDS No. 47-0124) at 9.7°, which can be assigned to the (200) plane of Na2Ti2O4(OH)2.Reference Yang, Jin, Wang, Li, Zhang, Zhang, Guo and Zhang27 After ion exchange with aqueous NH4Cl, Na+ ions in Na2Ti2O4(OH)2 are replaced by NH4+ generating (NH4)2Ti2O4(OH)2, but the orthorhombic structure remains intact after (NH4)2Ti2O4(OH)2 is calcinated at 100 and 200 °C. As to sample N–TiO2-3 [obtained after calcination of (NH4)2Ti2O4(OH)2 at 300 °C], the diffraction peak of the (200) crystal plane almost disappears, which indicates that calcination of (NH4)2Ti2O4(OH)2 at 300 °C facilitates conversion from orthorhombic structure to amorphous phase. Besides, N–TiO2-4 consists of anatase TiO2, which implies that calcination of (NH4)2Ti2O4(OH)2 at 400 °C in air is dominated by decomposition and crystallization yielding anatase TiO2. As the calcination temperature further rises to 500 and 600 °C, resultant samples N–TiO2-5 and N–TiO2-6 exhibit stronger diffraction peaks of anatase phase than N–TiO2-4, which indicates that elevating calcination temperature favors to enhance the decomposition of (NH4)2Ti2O4(OH)2 and crystallization of anatase TiO2.
XRD patterns of (a) Na2Ti2O4(OH)2 nanotubes and the ion-exchanged products calcinated at (b) 100 °C, (c) 200 °C, (d) 300 °C, (e) 400 °C, (f) 500 °C, and (g) 600 °C.

Figure 2 presents the TEM images of N–TiO2-1, N–TiO2-3, N–TiO2-4, and N–TiO2-5. Sample N–TiO2-1 retains the tubular morphology of STN [Fig. 2(a)], which indicates that ion exchange with aqueous NH4Cl and follow-up calcination at 100 °C have little effect on the tubular structure of STN. The HRTEM image of the nanotube in Fig. 2(a) clearly displays a multilayered wall structure with an internal diameter of 6 nm and an external diameter of 9 nm. The interlayer spacing of the nanotube is approximately 0.8 nm, close to the distance of the (200) plane of Na2Ti2O4(OH)2, and relevant SAED pattern proves that N–TiO2-1 has polycrystalline structure. After (NH4)2Ti2O4(OH)2 is calcinated at 300 and 400 °C, the nanotubes are broken into many short nanotubes [Figs. 2(b) and 2(c)]. When the calcination temperature reaches 500 °C, the nanotubes are completely broken and converted to nanoparticles [Fig. 2(d)].
TEM images of ion-exchanged products calcinated at (a) 100 °C, (b) 300 °C, (c) 400 °C, and (d) 500 °C. The insets on the left side and right side of (a) are the HRTEM image and SAED pattern.

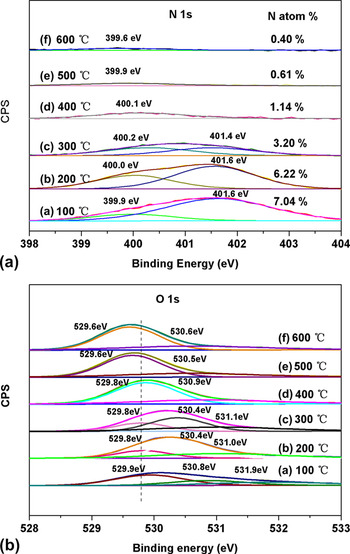
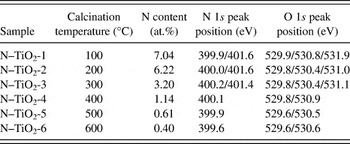
Figure 3 shows the XPS spectra of N 1s and O 1s of various N-doped TiO2 nanomaterials. Relevant XPS data for various N-doped TiO2 samples are summarized in Table I. N-doped TiO2 samples calcinated below 300 °C, including N–TiO2-1, N–TiO2-2, and N–TiO2-3, exhibit two N 1s peaks at 399.9 and 401.6 eV [Fig. 3(A)]. The typical N 1s peak at 396.0 eV, corresponding to substituted atomic N species, is not observed for various N-doped TiO2 samples. The N 1s peak at 401.6 eV is attributed to NH4+ in (NH4)2Ti2O4(OH)2,Reference Bao, Sun, Zhang, Ma and Liu28 which reveals that N species in N-doped TiO2 samples calcinated below 300 °C is assigned as NH4+. The N 1s peak at 400.0 eV may be assigned as molecular N2 chemisorbed on the surface of N-doped TiO2.Reference Wong, Chou and Yang29, Reference Vitiello, Macak, Ghicov, Tsuchiya, Dick and Schmuki30 This supposition, however, is argued by Sato et al.Reference Sato, Nakamura and Abe31 who claim that the N element with a binding energy of 400.0 eV in N-doped TiO2 should be due to the N―O bonding (i.e., Ti―O―N; because at room temperature, molecular N2 cannot be chemisorbed on the surface of metal oxides like TiO2) and by Gole et al.Reference Gole, Stout, Burda, Lou and Chen32 who ascribe the N 1s peak of N-doped TiO2 at 399.7 eV to the Ti―N bond. Such an argument is also claimed by Prokes et al.Reference Prokes, Gole, Chen, Burda and Carlos33 who suggest that the photocatalytic enhancing site in N–TiO2 must be due to the formation of Ti―O―N bonds or titanium metaoxide and by Xiang et al.Reference Xiang, Yu, Wang and Jaroniec34 who suggest that the N 1s peak of N-doped TiO2 around 400 eV is attributed to N atoms at the interstitial sites. Considering the above-mentioned arguments in association with our research, we suppose that the N 1s XPS peak of N-doped TiO2 at 400 eV is assigned to the formation of Ti―O―N bonds. Namely, on the one hand, (NH4)2Ti2O4(OH)2 is decomposed during the calcination process generating NH3 and TiO2 nanoparticles under a high enough calcination temperature. On the other hand, TiO2 nanoparticles decomposed from (NH4)2Ti2O4(OH)2 are nitrided by NH3 forming oxygen vacancies and Ti―O―N bonds via the incorporation of interstitial N atom into the lattice of TiO2. This supposition is also supported by Xiang et al.Reference Xiang, Yu and Jaroniec35 who claim that interstitial N can be readily incorporated into the lattice of TiO2 at a relatively low calcination temperature of 500 °C in air. Noticing that the intensity of the N 1s XPS peak of N-doped TiO2 samples at 401.6 eV gradually decreases with elevating calcination temperature from 100 to 300 °C, and this N 1s peak completely disappears as the calcination temperature reaches 400 °C and above, we can infer that NH4+ ions in (NH4)2Ti2O4(OH)2 are completely decomposed during calcination at 400 °C in air. Besides, the intensity of the N 1s XPS peak of N-doped TiO2 samples at 400 eV also decreases gradually with increasing calcination temperature, which implies that properly adjusting the calcination temperature is significant for acquiring a high enough concentration of dopant N in N-doped TiO2 samples calcinated at different temperatures in air.
High-resolution XPS spectra in the N 1s region (A) and the O 1s region (B) of the products sintered at (a) 100 °C, (b) 200 °C, (c) 300 °C, (d) 400 °C, (e) 500 °C, and (f) 600 °C.

XPS peak position and N content of various N-doped TiO2 samples calcinated at different temperatures.

Moreover, the O 1s XPS spectra of various N-doped TiO2 samples were fitted into asymmetrical peaks with a Gaussian–Lorentz distribution (ratio 80:20) of a Shirley-type baseline. As shown in Fig. 3(B), N-doped samples N–TiO2-1, N–TiO2-2, and N–TiO2-3 show O 1s subpeaks at 529.8, 530.8, and 531.0 eV, which are ascribed to Ti―O, ―OH, and H2O, respectively.Reference Kim, Ansari, Seo, Kim and Shin36 When the calcination temperature is higher than 400 °C, the O 1s peak at 531.0 eV disappears and that at 529.8 eV shifts toward lower binding energy side, which indicates that water physically adsorbed in N-doped TiO2 is completely eliminated in association with incorporation of dopant N into the lattice of TiO2 thereat.
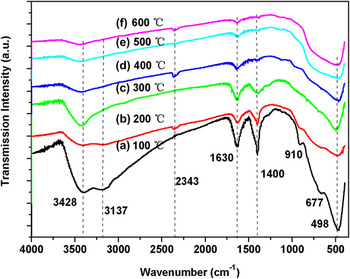
Figure 4 displays the FTIR spectra of N-doped TiO2 samples calcinated at different temperatures. All samples present similar FTIR spectra. Namely, they all show the vibration peaks of Ti―O―Ti stretching modes below 1000 cm−1 and the peak of background CO2 around 2360 cm−1.Reference Chen, Lou, Samia, Burda and Gole37 The broad band at 3428 cm−1 can be ascribed to the ―OH stretching vibration of H2O absorbed on TiO2 surface, and the peak around 1630 cm−1 is attributed to the bending vibrations of ―OH. The band at 1400 cm−1 corresponds to the asymmetric bending modes of NH4+ and that at 3137 cm−1 is ascribed to the N―H stretching mode of NH4+.Reference Jung and Grange38 The above-mentioned FTIR results indicate that the N species in N–TiO2-1, N–TiO2-2, and N–TiO2-3 is associated with NH4+ in (NH4)2Ti2O4(OH)2. Interestingly, as the calcination temperature rises, the characteristic vibration peaks of O―H and NH4+ ion become weak simultaneously, and the vibration peak of N―H almost vanishes when the calcination temperature reaches 400 °C and above, due to complete decomposition of (NH4)2Ti2O4(OH)2 at 400 °C and above, which well conforms to previously discussed XPS data. In addition, samples N–TiO2-1, N–TiO2-2, and N–TiO2-3 show strong absorption bands of the stretching vibration of Ti―O―Ti bonds in (NH4)2Ti2O4(OH)2 within 750–400 cm−1,Reference Wang, Wu and Li39 and these absorption bands for samples N–TiO2-4, N–TiO2-5, and N–TiO2-6 become increasingly broad and weak with elevating calcination temperature from 400 to 600 °C, which also validates the complete decomposition of (NH4)2Ti2O4(OH)2 above 400 °C.
FTIR spectra of N-doped TiO2 calcinated at (a) 100 °C, (b) 200 °C, (c) 300 °C, (d) 400 °C, (e) 500 °C, and (f) 600 °C.

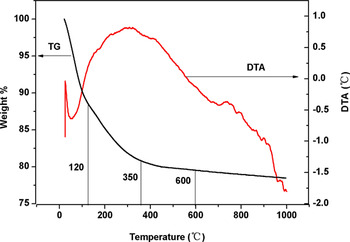
To understand the loss of the species on the surface of N-doped TiO2 nanomaterials under sintering, we detected the weight loss of sample N–TiO2-1 as an example from room temperature to 1000 °C. As shown in Fig. 5, sample N–TiO2-1 is dominated by three stages of weight loss when it is heated from room temperature to 1000 °C in air. Namely, it loses 13% of weight from room temperature to 120 °C, corresponding to the endothermic peak at 65 °C in the DTA curve. This is mostly due to the loss of physically adsorbed or embedded water on the surface of N-doped TiO2 nanomaterials. From 120 to 350 °C, it slowly loses about 9% of weight, which corresponds to slow decomposition of (NH4)2Ti2O4(OH)2 thereat and is in accordance with the above-mentioned FTIR finding. Finally, it loses about 2% of weight more slowly from 350 to 600 °C, which possibly involves the release and loss of NH3 gas molecules (corresponding to a little exothermic peak at 400 °C in DTA curve) as well as the partial reduction of TiO2 by NH3 gas molecules forming oxygen vacancies and promoting nitrogen doping into the TiO2 lattice.
TGA and DTA curves of sample N–TiO2-1 from room temperature to 1000 °C.

According to the above-mentioned FTIR and TGA results, we suppose that the following reactions may be involved during the preparation of N-doped TiO2. Namely, (NH4)2Ti2O4(OH)2 is decomposed and its nanotubular structure is broken to release NH3 gas, and the crystallization of TiO2 is initiated and promoted under NH3 atmosphere, which corresponds to reaction Eqs. (1) and (2). As the calcination temperature rises, N atoms are doped into the TiO2 lattice forming oxygen vacancies, while NH3 gas facilitates nitridation of TiO2 yielding N-doped TiO2, as described in Eq. (3), where  refers to single-electron-trapped oxygen vacancy.



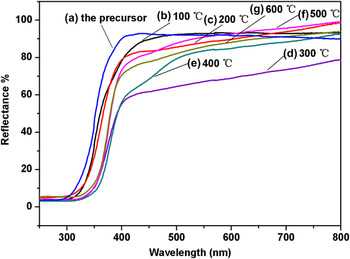
Figure 6 presents the diffuse reflectance UV–vis spectra of the precursor and various N-doped TiO2 samples sintered at different temperatures. N-doped TiO2 samples show a markedly enhanced photoabsorption in visible light region as compared with the precursor. The absorption edge of the samples can be determined from the following equation:

UV–visible reflectance spectra of precursor Na2Ti2O4(OH)2 nanotubes (a) and N-doped TiO2 nanomaterials sintered for 3 h in air at (b) 100 °C, (c) 200 °C, (d) 300 °C, (e) 400 °C, (f) 500 °C, and (g) 600 °C.

where E g is the band gap (eV) and λ (nm) is the optical absorption edge. The precursor shows an absorption edge around 380 nm, corresponding to a band gap of 3.26 eV. N-doped TiO2 samples calcinated at 100 and 200 °C, i.e., N–TiO2-1 and N–TiO2-2, display an absorption edge at 400–420 nm (corresponding to a band gap of 2.95–3.10 eV). Besides, sample N–TiO2-3 shows an apparent absorption in the whole visible region of 400–800 nm. As the calcination temperature rises to 400 °C, resultant sample N–TiO2-4 shows two absorption edges at 400–420 nm (corresponding to a band gap of 2.95–3.10 eV) and 490–530 nm (corresponding to a band gap of 2.34–2.53 eV), respectively. This means that as-synthesized N-doped TiO2 nanomaterials have absorption expanded to the visible light region, which should help to increase the yield of photogenerated electrons and holes thereby improving the sufficient utilization of solar energy.
Pointing to the origin of the visible light activity of N-doped TiO2, Irie et al.Reference Irie, Watanabe and Hashimoto15 suggested that the formation of a narrow N 2p band above the valence band may play a key role. Xiang et al.,Reference Xiang, Yu, Wang and Jaroniec34 based on calculations of first-principle density functional theory (DFT), demonstrated that the interstitial N dopant can induce the local states near the valence band edge and narrow the band gap, resulting in visible light response of N-doped TiO2. Also based on DFT calculation, Valentin et al.Reference Valentin, Pacchioni, Selloni, Livraghi and Giamello40 suggested that nitrogen doping leads to formation of oxygen vacancies thereby promoting the absorption of N-doped TiO2 in visible light region. In our experiment, N-doped TiO2 samples present visible light absorption to some extent as compared with the precursor, and the samples calcinated at 400–600 °C show slightly decreased visible light absorption as compared with sample N–TiO2-3, corresponding to decrease of N concentration and breakage of the tubular structure at elevated calcination temperatures of 400–600 °C.
As reported in literature,Reference Chang, Tsai, Chiu, Liu, Chao and Lin24 the decomposition of ammonium trititanate nanotubes at 300–400 °C results in the formation of N–TiO2 (B) nanotubes and N-anatase nanotubes; resultant N-doped TiO2 nanomaterials show visible light activity in degrading methylene blue, and the origin of their visible light activity is attributed to the formation of active N species (―NH2) and of the hybrid phases of TiO2 (B) and anatase TiO2. The TiO2 (B) phase, however, is not detected by XRD analysis in the present research. Therefore, we suppose that the active N species accounting for the visible light response of N-doped TiO2 should be ascribed to Ti―O―N bonds.Reference Prokes, Gole, Chen, Burda and Carlos33, Reference Chen, Lou, Samia, Burda and Gole37
Seemingly, it may be presumed that the visible light absorption capacity of N-doped TiO2 should be dependent on the concentration of N-dopants. However, as shown in Fig. 6, the visible light absorption capacity of N-doped TiO2 does not vary at the same pace as the concentration of N-dopants. Namely, the visible light absorption capacity of N-doped TiO2 nanomaterials declines with calcination temperature order of 300 > 400 > 600 > 500 > 200 > 100 °C. Usually, the change in the chemical nature of nitrogen dopants and variation in defect density may be responsible for the variation in visible light absorption of N-doped TiO2, and the visible light photocatalytic activities of N–TiO2 samples may vary with varying calcination temperature.Reference Chang, Tsai, Chiu, Liu, Chao and Lin24, Reference Liu, Yu and Wang41, Reference Zhao, Qiu and Burda42 Since an increased visible light region absorption usually corresponds to an improved visible light photocatalytic activity, the visible light photocatalytic activity of various N-doped TiO2 samples can be ranked in a calcination temperature order of 300 > 400 > 600 > 500 > 200 > 100 °C.
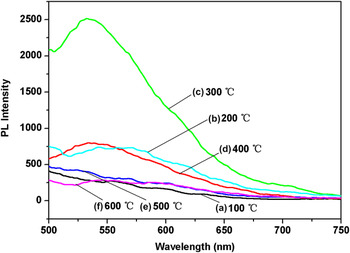
Figure 7 shows the room temperature PL spectra of various N-doped TiO2 nanomaterials excited by 470 nm radiation. Samples N–TiO2-1, N–TiO2-2, and N–TiO2-3 (calcinated at 100, 200, and 300 °C, respectively) all show a broad visible emission band around 530 nm [Figs. 7(a)–7(c)]. Besides, sample N–TiO2-3 exhibits a shoulder peak at 700 nm, which may arise from the scatter of light. According to the DFT calculation, nitrogen doping leads to the formation of oxygen vacancies.Reference Valentin, Pacchioni, Selloni, Livraghi and Giamello40 The oxygen vacancies act as the recombination centers of electrons and holes,Reference Li, Zhang, Jin, Yang, Wang, Yang and Zhang43−Reference Zhang, Jin, Zhang, Guo, Yang, Li, Wang and Zhang45 the emission band in N-doped TiO2 nanomaterials originated from the single-electron-trapped oxygen vacancy ( ) forms a subband within the band gap of the nanotubes,Reference Feng, Wang, Jin, Zhang, Zhang, Wu and Zhang19, Reference Wang, Tafen, Lewis, Hong, Manivannan, Zhi, Li and Wu21 and the concentration of
 tends to decrease with declining calcination temperature, resulting in lowered intensity of PL of N-doped TiO2 calcinated below 300 °C. When the calcination temperature is above 300 °C, more TiO2 is reduced and the concentration of oxygen vacancies increases as well, resulting in enhanced intensity of PL in association with enhanced doping of N atoms into TiO2 lattice. In addition, when the calcination temperature is above 300 °C, the phase transformation from an orthorhombic crystalline system to anatase TiO2 leads to the breakage of the nanotubular structure, and the oxidation of TiO2 by oxygen in air within 400–600 °C causes the decrease of the intensity of PL. As a result, samples N–TiO2-4, N–TiO2-5, and N–TiO2-6 show obviously reduced intensity of PL as compared with sample N–TiO2-3.
Room temperature PL spectra of N-doped TiO2 nanomaterials sintered for 3 h in air at (a) 100 °C, (b) 200 °C, (c) 300 °C, (d) 400 °C, (e) 500 °C, and (f) 600 °C.

IV. CONCLUSIONS
In summary, N-doped TiO2 nanomaterials have been prepared through the ion exchange of STN precursor with aqueous NH4Cl in association with follow-up sintering at different temperatures in air. The structure and optical properties of N-doped TiO2 nanomaterials have been investigated in details, and their formation mechanism has been discussed in relation to enhanced visible light response. It has been found that (NH4)2Ti2O4(OH)2 experiences gradual crystalline structure transformation from an orthorhombic crystalline system to the anatase phase when it is sintered at different temperatures in air, and its nanotubular structure is destructed and transformed to anatase TiO2 nanoparticles at a high enough calcination temperature. Besides, N-doped TiO2 sample obtained at 300 °C possesses the strongest visible light absorption, and those samples obtained at 400 °C and above show declined visible light absorption than N–TiO2-3, due to decrease of the concentration of dopant N thereat. Moreover, sample N–TiO2-3 contains NH4+ as the active N species, and NH4+ is decomposed to form NH3 as the calcination temperature is above 400 °C. Under the reducing action of NH3, N atoms are doped into the TiO2 lattice in the form of interstitial N species, forming Ti―O―N bonds, which accounts for the origin of the visible light absorption of N-doped TiO2 nanomaterials sintered at 400 °C and above. Doped N atom is gradually released at elevated calcination temperatures of 500 and 600 °C, resulting in reduced visible light absorption of samples N–TiO2-5 and N–TiO2-6 as compared with sample N–TiO2-4. In one word, by properly manipulating the reaction condition, it is feasible to prepare N-doped TiO2 nanomaterials with increased dopant N concentration and enhanced visible light activity with STN as the precursor.
ACKNOWLEDGMENTS
The financial supports from the National Natural Science Foundation of China (Grant Nos. 10874040 and 60906056) and the Cultivation Fund of the Key Scientific and Technical Innovation Project of Ministry of Education of China (Grant No. 708062) are highly acknowledged.