

INTRODUCTION
Britain's Jews have historically been associated with the left of British politics, particularly in supporting the Labour party (Alderman Reference Alderman and Crewe1975; Reference Alderman1983; Miller, Schmool, and Lerman Reference Miller, Schmool and Lerman1996; Rich Reference Rich2018; Reference Rich2019). However, the strength of this association has waned over recent decades (Sanders Reference Sanders1991; Miller, Schmool, and Lerman Reference Miller, Schmool and Lerman1996; Kotler-Berkowitz Reference Kotler-Berkowitz2001; Reference Kotler-Berkowitz2002; JPR 2010; Philpot Reference Philpot2017) with emerging evidence showing Jews now being disproportionately likely to support the right-of-center Conservatives (Jewish Chronicle Reference Chronicle2017; Barclay, Sobolewska, and Ford Reference Barclay, Sobolewska and Ford2019). In one sense this suggests that Anglo-Jewry is similar to other major religious groupings in Britain and other Western democracies, in that religious affiliation has a significant influence on political attitudes beyond how it reflects other electoral cleavages. However, it is difficult to reconcile this apparent shift in partisanship with theories of religious belonging, and specifically how religious affiliation is associated with voting behavior. Whereas research has been able to explain the long-term associations that religious communities form with a particular party, they tend to be less well suited to explaining why religious affiliation can maintain its significance when religious voters display volatile preferences.
The likely realignment of British Jews would appear to be an ideal test case for scholars to use when theorizing about distinctive yet volatile political preferences held by religious voters. Yet researchers have been limited by the scarcity of robust data of Jewish voters outside the United States, which has been at best sporadic. Moreover, the above studies which have addressed party choice amongst Jews have tended to be based on cross-sectional data, therefore making reliable inferences about change in political attitudes very difficult. Because of this, not only do we have a less-rich understanding of the political behavior of Jewish voters in the UK generally, but there is also an important knock-on effect of how we are denied an opportunity to investigate a divergent case in the literature of the effect of religious affiliation on voting behavior.
This paper, therefore, makes both empirical and conceptual contributions. Using data from the British Election Study and other representative surveys of Britain's Jewish population, this study firstly adds a much needed longitudinal aspect to the current understanding of the party preferences of British Jews. In this sense, it complements existing evidence by showing Jewish voters to be overwhelmingly supportive of the Conservatives, but also showing that this has been reinforced significantly following the 2015 General Election. Theoretically, the paper argues that the substantial shift in partisan attachments observed amongst British Jews should be understood as rewarding the party (in this case the British Conservative party) which is perceived as most effective in promoting security for Jews given their status as a precarious minority within British society. In this sense, religious belonging continues to influence voting preferences, but the way this mechanism has been traditionally understood is fundamentally different for Jewish voters, as partisan attachments can be much more volatile than the long-term associations found elsewhere in the literature. Rather, perceptions of how well parties can oppose antisemitism should be viewed as a group utility heuristic for Jewish voters, and that the short term increase in support for the Conservatives is in line with their being perceived as taking this issue more seriously than the British Labour party.
THE RELIGIOUS CLEAVAGE AND PARTY COALITIONS
Following a period of being largely overlooked as an important aspect of political science (Fox Reference Fox2001; Reference Wald and WilcoxWald and Wilcox2006; Kettell Reference Kettell2012; Reference Kettell2014), religious affiliation has seen a revival of importance as a predictor of political attitudes and behavior in Western Democracies (Knutsen Reference Knutsen2004; Norris and Inglehart Reference Norris and Inglehart2004; Elff Reference Elff2007; Raymond Reference Raymond2011; Clements Reference Clements2015; Tilley Reference Tilley2015). Given the long term trend of secularization in most Western polities (Wallis and Bruce Reference Wallis, Bruce and S. Bruce1992; Dogan Reference Dogan2001; Reference Dogan2004) research has tended to focus on contrasting the attitudes of the faithful to the secular, particularly regarding the varying denominations of Christianity given their relatively dominant entrenched position in Western Democracies. In this regard, voters belonging to majority religious groups typically support more traditionalist or conservative positions which in turn largely correlate with support for established parties of the right and center-right, be they Christian Democratic or Conservative parties in much of Europe or the Republicans in the United States (Layman Reference Layman1997; Reference Layman2001; Mulligan Reference Mulligan2008; Raymond Reference Raymond2011).
Theories employed to explain the enduring influence of religious affiliation on partisan preferences vary, but can be categorized as mainly falling within two broad perspectives. The first of these is rooted in the social cleavages literature as classically identified by Lipset and Rokkan (Reference Lipset and Rokkan1967). In this regard, groups of religious voters continue to express a preference for parties which have historical associations with their group. The enduring effect of these associations is suggested to be perpetuated over time through a process of parental and group socialization. Thus, the relationships that religious voters form with parties are a natural extension of their religious identity (see e.g., Tilley Reference Tilley2015).
As well as this, more recent literature suggests that the enduring influence of religion has less to do with the continuing effect of traditional social cleavages, and more with how parties are able to court religious voters through appeals to shared values or policy positions. A common ideological outlook, often (but not necessarily) somehow grounded in theological teaching, leads religious voters to become part of parties' electoral coalitions, often explicitly mobilized by using religious cues in a party's campaign (Calfano and Djupe Reference Calfano and Djupe2009; Reference Calfano and Djupe2011; Calfano and Paolino Reference Calfano and Paolino2010). The relative importance of religiosity here is therefore in part contingent on the extent to which parties diverge on moral issues or “value” positions (Evans and De Graaf Reference Evans and De Graaf2013).
Essentially, we can view these competing conceptions of the effect of religious affiliation as grounded in either historical or theological roots. However, although theoretical approaches are able to explain how linkages between parties and their religious supporters can be stable over time, they are less able to explain instances where we observe sharp shifts in these relationships. Clearly, if we understand the effect of religion as a product of historical ties, then it is nonsensical for there to be substantial volatility in party support within an individual religious community. Theologically grounded conceptions appear to be more able to explain partisan shifts in the sense that parties can converge (or alter) their stances on moral positions considered salient to a religious community. However, given that parties' “ownership” of issues (Petrocik Reference Petrocik1996; Green and Jennings Reference Green and Jennings2017) produce long-term reputations which are rarely subject to short-term fluctuations,Footnote 1 we are still left with a theoretical approach which does not lend itself to explaining especially fast changes in public opinion on specifically religious grounds. This is especially the case when parties' approaches to theological or moral issues remain essentially constant. As such, whilst recognizing that the effect of religious belonging has tended to produce stable preferences for a given party in the majority of cases (Tilley Reference Tilley2015), we are nevertheless in need of a better explanation of the influence of religious affiliation when the relationship between parties and religious voters are not stable, and this will be a focus of the rest of this paper.
THE POLITICAL CHOICES OF THE JEWISH DIASPORA
How then, are we to understand those instances which do not fit into either of these frameworks? More specifically, what are we to do when we observe religious voters, who are predominantly associated with supporting one party, start disproportionately supporting a competitor? Examples of such shifts in short periods of time are not common but can be observed more frequently in ethnic and religious minority groups. It is well known that African American voters, now staunchly Democrat, retained affiliations with the Republicans until the GOP's opposition to civil rights legislation in the 1960s (Tate Reference Tate1994). As regards religious minorities, American Muslims were also largely Republican leaning as recently as 2000 until an increased perception of Islamophobia within the party came in tandem with the “War on Terror” (Findley Reference Findley2001; Barreto and Bozonelos Reference Barreto and Bozonelos2009; Chouhoud, Dana, and Barreto Reference Chouhoud, Dana and Barreto2019). Elsewhere, emerging evidence suggests that Jewish voters in Canada have deserted their traditional home of the center-left Liberals, now being associated with the Conservatives, in a very short space of time (Medved Reference Medved2013). Whilst their co-religionists in the United States have remained resolutely supportive of the Democrats (Kotler-Berkowitz Reference Kotler-Berkowitz2005; Sonenshein and Valentino Reference Sonenshein and Valentino2000; Wald Reference Wald2015; Reference Wald2019; Smith and Martinez Reference Smith and Martinez2016) this has not been without large anomalous drops in support coinciding with the candidacy of Jimmy Carter, and the corresponding associations of the Democrats becoming increasingly allied to Evangelical Christianity (Wald Reference Wald2015). Given that the volatility of such examples of political attitudes and behavior are not adequately explained by our existing theories, we must, therefore, look elsewhere for suitable interpretations of the effect of religious affiliation when minority status is also a factor.
In this regard, attempts have been made by scholars to show how minority status is an important motivating factor in the distinctive political behavior of Jewish voters (see Levey Reference Levey1996 for a full review). Amongst the best known of these is the work of Medding (Reference Medding1977) who offers a theory of specifically “Jewish political interests”, and proposes that Jewish voters in all democratic states have tended to support parties which are best placed to oppose external threats to these political interests. Here, Medding identifies a hierarchy of shared priorities belonging to Jewish voters. The most important of these is group survival, followed by the ability to participate fully and freely within society, and then the conditions which permit the free exercise of Jewish religious or communal values and practices. Finally, given Jewish voters have tended to be concentrated within middle-class occupations, shared economic concerns constitute the fourth category. These criteria stress that opposition to antisemitism is highly important to Jewish voters when forming political attachments, but also is sufficiently broad so as to include threats which are not directly antisemitic. In short, Jewish voters are said to reward parties based on the extent to which they oppose threats to Jewish survival, to Jews being treated as full citizens, to being free to live as Jews and then to be able to prosper within this context.
There are numerous merits to such an approach when trying to explain the political behavior of religious minorities and especially Jewish voters. One of these is that the problem of volatility in party support which is not adequately covered by other theoretical perspectives is now accounted for. According to this framework, party attachments are only as durable as how well parties are judged in protecting Jews from antisemitism and other external threats, not simply associations with religious or moral values. As such, short-term changes in parties' positions on issues salient to the interests of a religious group can explain rapid and large-scale shifts in party support in ways not explained elsewhere in the literature.
Another strength is how it provides a common framework whilst explaining the apparently opposing political choices made by Jewish voters in different democratic states (something which historically has been puzzling to scholars seeking to explain the Democratic leanings of American Jews, see Wald Reference Wald2015). In this sense, Medding attributes the liberalism and leftism of U.S. Jews partially as a response to viewing antisemitism as more prevalent on the American right alongside viewing them as the upholders of the social status quo (Medding Reference Medding1977; Levey Reference Levey1996). Conversely, whereas the evidence overwhelmingly points to there being an enduring attachment between American Jews and the left, the same cannot be said for Jewish voters in South Africa (Kotler-Berkowitz Reference Kotler-Berkowitz2002) and Australia (Rubinstein Reference Rubinstein2015) who have opted for parties of the right and center-right, whereas Jewish voters in France have voted for parties of the moderate center (Schnapper, Bordes-Benayoun, and Raphaël Reference Schnapper, Bordes-Benayoun and Raphaël2010). In this regard, whilst it is important to recognize the difficulties involved in employing such a broad theoretical framework (not least in terms of what constitutes a “threat”), the notion that Jewish voters tend to opt for parties based on their opposition to antisemitism or other external threats is sufficiently flexible to explain why Jews in different democratic settings have shown support for parties with such a broad range of ideological positions.
Despite these advantages, researchers are left with cases which require further examination, and Britain's Jews represent one such case. For instance, a consequence of Jewish voters viewing parties through the lens of minority group interest is that there is likely to be a degree of group-cohesion of these preferences at any one time within any particular setting (Kotler-Berkowitz Reference Kotler-Berkowitz2002; Wald Reference Wald2015). Although the above evidence suggests that most of the Jewish diaspora follow this expectation (despite Jews supporting an ideologically diverse range of parties, cohesion amongst Jewish voters within democracies have been strong) evidence from Britain has suggested that, at least until recently, Jews have been better characterized by their division rather than cohesion when it comes to party choice (Kotler-Berkowitz Reference Kotler-Berkowitz2002; JPR 2010). As noted above, emerging evidence indicates that this may be less true for Jewish voters currently (Barclay, Sobolewska, and Ford Reference Barclay, Sobolewska and Ford2019) but academic research which has addressed this longitudinally remains scarce. Moreover, attempts to link political attitudes to factors which are linked specifically to minority status remain under-researched.
THE EXCEPTIONAL CASE OF BRITISH JEWS?
In some ways, the historical understanding of the political preferences of Britain's Jews fits in well with the minority political interests framework outlined above. We know that, for instance, there existed a long-standing association with the left, and particularly the Labour Party (Alderman Reference Alderman and Crewe1975; Reference Alderman1983; Miller, Schmool, and Lerman Reference Miller, Schmool and Lerman1996; Rich Reference Rich2018; Reference Rich2019). Research on this association suggests that it is owed in part to how Labour was perceived as the party being best placed to be champion of group political interests through their record in opposing racial prejudice (and antisemitism) and promoting equal rights for Jews, as well as more steadfast support of the fledgling state of Israel (Alderman Reference Alderman1983). In general terms, this narrative has much in common with the association that most other major ethnic and religious minority groups in Britain share with the Labour party (Heath et al. Reference Heath, Fisher, Sanders and Sobolewska2011; Heath et al. Reference Heath, Fisher, Sanders, Rosenblatt and Sobolewska2013; Sanders et al. Reference Sanders, Heath, Fisher and Sobolewska2014; Martin Reference Martin2019). However, developments over recent decades have suggested that current political preferences of UK Jews do not fit as neatly within such a framework. The work of Lawrence Kotler-Berkowitz (Reference Kotler-Berkowitz2001; Reference Kotler-Berkowitz2002) in particular goes into the most depth in showing Jewish voters to be increasingly divided in their partisan choices, perhaps reflecting an inclination to make partisan calculations on the same criteria as the wider population (Miller, Schmool, and Lerman Reference Miller, Schmool and Lerman1996). Since 2010, studies have inferred that Jewish voters are disproportionately aligned to the Conservatives (Clements and Spencer Reference Clements and Spencer2014; Barclay, Sobolewska, and Ford Reference Barclay, Sobolewska and Ford2019).
This presents both an empirical and theoretical problem. Although studies appear to present a narrative of a religious group who have moved from disproportionately supporting one party to another over a protracted period of time, the absence of longitudinal analysis makes it difficult to be certain about the extent to which this is accurate. This lack of certainty, in turn, means that it becomes more difficult in understanding theoretically how Britain's Jews differ from the wider electorate in their partisan choices. Does the drift away from Labour shows that Jews are less likely to perceive Labour as the champion of group interests? Rather, are patterns of party support actually showing that group interest heuristics, such as that suggested by Medding are in fact not effective in explaining distinctive political behavior of Jewish voters, therefore meaning we need to look elsewhere for theoretical explanations?
Answering this question has proven to be difficult due to there being circumstantial evidence for both of these eventualities. On the one hand, the sociological changes in Anglo-Jewry over recent decades are of the kind which would in other circumstances be associated with being more inclined to support the Conservatives. At the same time, the way in which both parties have changed positions on the issue of security for Jews, both domestically and abroad, makes it plausible that changes in party support have followed this positional change. This is particularly true when looking at the contrasting approaches of the two main parties on Israel and Middle Eastern politics. Notwithstanding the large diversity of attitudes that British Jews hold towards the specific policies of the Israeli government, an overwhelming majority of British Jews still hold the state as central to their Jewish identity (Graham and Boyd Reference Graham and Boyd2010; Miller, Harris, and Shindler Reference Miller, Harris and Shindler2015). Perhaps more importantly, there is the way in which domestic antisemitism has increasingly been associated with opposition to or criticism of the Israeli state. To this end, scholars of antisemitism have outlined in detail how modern manifestations of anti-Jewish sentiment have tended to coalesce around the discourse of Israel, typically using long-standing anti-Jewish or conspiratorial tropes (Taguieff Reference Taguieff2004; Fine and Spencer Reference Fine and Spencer2017; Hirsh Reference Hirsh2017; Bolton and Pitts Reference Bolton and Pitts2018; Lipstadt Reference Lipstadt2019; Rich Reference Rich2019). As such, criticism of Israel which is perceived as excessive, holding it to a higher standard than is the case for other states, or particularly when conflated with antisemitic conspiracy theory could easily be viewed as an external threat to Jewish interests as defined by the framework discussed above. Alongside antisemitic rhetoric, another important point to consider is the fact that hate crimes committed towards Diaspora Jews have been shown to increase following Israeli military engagement (Feinberg Reference Feinberg2019). Given this important contextual factor, it is possible that Jewish voters may view politicians or parties who raise the salience of such conflicts domestically and condemn the role of the Israeli state also undermine the security of Jewish voters in the Diaspora, irrespective of their personal view of Israel and Israeli policy.
In this respect, criticism of Israel through conference motions, boycotts and rhetoric has become increasingly commonplace within the grassroots of the labor movement since the 1980s (Alderman Reference Alderman1983; Hirsh Reference Hirsh2017; Philpot Reference Philpot2017; Rich Reference Rich2018; Reference Rich2019). Conversely, the Tories have spent much of the same period advocating pro-Israeli positions, whilst also promoting Jewish MPs into senior positions within the Party and rhetorically presenting themselves as far more tolerant to British Jews than was the case historically (particularly since the Thatcher Governments, see Philpot Reference Philpot2017).
Alongside this general trend, there has been the particular salience of Labour's approach to the security of Jews post 2015, and the election of Jeremy Corbyn as leader. The Labour leader is well documented in holding a critical view of Israel, but beyond this has been accused of overseeing an antisemitic political culture within the party (Hirsh Reference Hirsh2017; Lipstadt Reference Lipstadt2019; Rich Reference Rich2019). Indeed, individual instances of alleged antisemitism within Labour have become so frequent during Corbyn's tenure as leader that it is impossible to document them all succinctly in this paper, and overwhelmingly trace their roots to a form of anti-Zionist politics which evokes antisemitic tropes in its discourse. Many of these cases relate to antisemitic online posts from grass-roots Labour members, although similar accusations have been levelled at Labour figures of all levels of seniority within Labour, including numerous Parliamentary candidates, sitting MPs, and former Mayor of London, Ken Livingstone. It has also been suggested that Corbyn himself has held antisemitic positions. Moreover, there were questions surrounding Corbyn personally having either shared platforms or having been otherwise associated with individuals and organizations who have espoused antisemitic views. These alleged associations are varied but have included apparent support for Hamas & Hezbollah and links to groups such as Deir Yassin Remembered who have openly published antisemitic material (Rich Reference Rich2018, The Jewish Chronicle August 12th 2015). Given that much of this was on public record prior to his election as leader, it stands that if the political behavior of Jewish voters can be understood as rewarding parties who best prioritize security for British Jews then it would be expected that a sharp switch away from the Labour party could follow Corbyn's election as leader.
What is more, the available survey evidence shows that Britain's Jews believe that antisemitism has become more salient over recent years, both socially and politically. The best example of this comes from the cross-national survey by the European Union Agency for Fundamental Rights (FRA) in 2018 which includes a variety of measures of antisemitism within EU member states. To this end, more than half of British Jews (58%) believe that antisemitism has increased a lot in Great Britain over the last 5 years (FRA 2018).Footnote 2 This number increases to 88% when including all respondents who believe there to be at least some increase in domestic antisemitism within the same period. This in itself does not mark Britain as especially different from other European states, where perceptions of increasing antisemitism are high across the board, but there is a discernible difference when considering the specific manifestations of antisemitism. In this sense, the most common perceived manifestation of antisemitism in Britain is through “political life”, where Britain scores more highly than any of the other countries included in the survey (FRA 2018). Although it does not necessarily follow that these perceptions are a direct consequence of the incidents of antisemitism within Labour or the specific role of Corbyn as leader, they are nevertheless consistent with such a position and provide a sound rationale as to why there may be substantial electoral volatility if the rise in antisemitism is disproportionately seen as found on the political left.
However, as noted above another plausible explanation for British Jews moving away from the Labour party could be simply due to Jewish identity becoming less important than it was when it comes to influencing political preferences. Jews have been viewed as a “model of integration” in the UK when compared to other immigrant-origin groups (Kudenko and Phillips Reference Kudenko and Phillips2009) and therefore, following a passing of time and significant economic progression over recent generations, there is scope for any change in party support to reflect Jewish voters converging their partisan attachments with the broader electorate. In this regard, party support changes through religious affiliation losing its importance, rather than being a determining aspect of political behavior. Indeed, social integration and economic mobility have been cited as a key motivator for initial movement away from Labour (Alderman Reference Alderman1983). To this end, Jews in Britain are older, more self-employed, and likely to be found in the professional classes than the national average (Alderman Reference Alderman1992; Graham, Schmool, and Waterman Reference Graham, Schmool and Waterman2007; Graham Reference Graham2013), all of which are typically predictors of Conservative support. Although Barclay, Sobolewska, and Ford (Reference Barclay, Sobolewska and Ford2019) show that Jewish voters in 2017 were rather demographically homogenous in supporting the Conservatives, this feasibly may be a recent development if disproportionately high levels of Conservative support are also recent.
The remainder of this paper seeks to bring more clarity to both the empirical and theoretical problems outlined above. Firstly, it will bring a much needed longitudinal perspective to how the partisan preferences of Britain's Jews have developed over recent years, particularly covering the period before and during Corbyn's tenure as leader. Further, it will establish the extent to which we can attribute any Conservative partisanship that is observed to how well parties are perceived in accommodating the political interests of the Jewish community as outlined in the above literature.
IMPORTANCE OF MINORITY STATUS AND SECURITY
Taking the above into consideration, the central theoretical contribution that this paper proposes is that the status of Jewish voters as a precarious minority in Britain raises the salience of group security as an important influence on voting. In doing so, it seeks to explain the volatility of Jewish voters which existing theories of the effect of religious affiliation on partisanship cannot. Put differently, religious affiliation still matters in predicting the political choices of Jewish voters as it does with other religious groups in many established democracies. However, the mechanism which underpins this effect is different to existing theories of religious voting which stress long-term social cleavages or parties using “moral” cues when campaigning, and is better understood as a group utility heuristic where parties are rewarded for being perceived as promoting security for Jews.
In many respects, this position has a lot in common with Medding's general theory, but also adds two important developments. The first of these is that it is more focused. A criticism of Medding's approach is that it defines the political interests of Jews so broadly that it can plausibly encompass an enormous range of issues and thereby loses some analytical value (Levey Reference Levey1996). By proposing that Jewish voters judge parties by how well they take the specific issue of security for Jews in the face of antisemitism seriously, this paper argues both that Jewish voters make political choices in line with their interests which are much more clearly defined and are not as open to accusations of being overly vague. The second development is empirical. Previous attempts to test theories of the political behavior of Jews outside the United States have in the main suffered from the lack of availability of good quality data, especially over time. Although data scarcity remains an issue to an extent, this paper is able to test perceptions of parties' performance when it comes to accommodating the political interests of Jews in a way in which it was previously unavailable to scholars. As such, it is able to see how these perceptions may fluctuate over a period where there have been qualitative changes in how parties have behaved regarding their opposition to antisemitism.
HYPOTHESES
The first hypothesis establishes whether there is something distinctive about Jewish political behavior in the UK. In doing so, it tests the notion that the political attitudes of British Jews are indistinguishable from the broader electorate once controlling for their socio-economic profile. The paper, therefore, tests the possibility that there is no discernible effect of religious affiliation upon the voting patterns of British Jews.
H1: Jewish voters support the Conservatives more than the population at large once controlling for demographic characteristics.
The second hypothesis looks at party support longitudinally. Should this paper's theory hold, then it would be expected that there should be a discernible shift away from supporting the Labour party following 2015 and the election of Jeremy Corbyn as party leader.
H2: Support for the Conservatives versus Labour increases amongst Jewish voters following 2015.
The third hypothesis has two components which further link any shift in party support to the Labour leader, and in doing so provides more evidence that partisanship is motivated by judgments of how well parties take the security of Jews seriously. To this end, the expectations would be to see assessments of Corbyn to be less favorable amongst Jews than the wider electorate, and also that Jews perceive Corbyn more negatively than his predecessor, Ed Miliband.
H3i: Jewish voters have less favorable perceptions of Jeremy Corbyn as Labour leader in comparison to the wider electorate
H3ii: Jewish voters have less favorable perceptions of Jeremy Corbyn as Labour leader in comparison to their perceptions of Ed Miliband
The final hypotheses will test the conceptual argument of this paper; that the Jewish voters form political preferences through the lens of group interest, particularly prioritizing the security of Jews given their status as a precarious minority. This will involve testing which party and leader is seen as having the best policy for the Jewish community in the UK as well as the best policy towards Middle Eastern politics. Finally, it will also test if Jews who feel less secure and Jews who pay more attention to Israel are more likely to opt for the Conservatives as the champion of group interest.
H4i: The Conservative Party leader (David Cameron) is perceived as better for the UK Jewish community.
H4ii: The Conservative Party leader (David Cameron) is perceived as having a better approach to the Middle East
H4iii: The Conservatives are perceived as the party with the best approach to the Middle East
H5i: Jews who feel less safe in Britain are more likely to support the Conservatives.
H5ii: Importance of policy towards Israel when voting has a positive association with likelihood of supporting the Conservatives
DATA & MEASUREMENT
Testing these hypotheses will require using more than one dataset. Whilst there are representative surveys of UK Jews which contain political content, these are near exclusively cross-sectional and no individual survey contains the required content to adequately answer each of the above questions. Conversely, nationally representative surveys of political attitudes typically have fairly small numbers of Jewish respondents with no efforts to ensure representativeness of Britain's Jewish community. I will, therefore, use two main sources, outlined below, which will cumulatively be able to test each of the above hypotheses, as well as to provide a longitudinal aspect to the analysis which has hitherto been absent from the study of British Jews.
The only sources of weighted representative samples of British Jews of robust size come from the database of British Jews collated by polling company Survation. The two particular surveys that I used were carried out just before the 2015 General ElectionFootnote 3 (Survation 2015), and just over a year laterFootnote 4 (Survation 2016). Both of these datasets consist of exclusively Jewish respondents and were principally sampled using phone-based data collection, although a small number of online interviews were used to top up the second survey. Both surveys include both practicing and non-practicing Jews within their sample and are weighted to ensure national representativeness in regards to age, sex, and region, which due to the geographical dispersion of Anglo-Jewry was coded into a series of dummy variables for living in London, Manchester or elsewhere.Footnote 5 These datasets have not included variables looking at either social class or income and those parts of my analysis which relate to how the class profile of British Jews impacts on political behavior need to draw upon other datasets. Nevertheless, the greater statistical power and representativeness in terms of other demographic characteristics means that these surveys are the most reliable when making generalizing claims about Anglo-Jewry.
The outcome variables I will use from this dataset to test the above hypotheses are:
If the General Election were tomorrow, and there was a candidate from all political parties standing in your constituency, which party do you think you would vote for?
Which party leader do you think would have the best attitude as Prime Minister to the Jewish community in the UK?
Which party leader do you think would have the best approach as Prime Minister to Israel and the Middle East?
Which party generally do you think has the best policies for Israel & the Middle East?
How important or unimportant are parties' attitudes towards Israel in influencing how you will vote in the general election?
Thinking about your personal safety, how safe or unsafe do you feel as a Jewish person in Britain? (From May 2016)
In conjunction with the above data, this paper also draws upon the British Election Study (BES) online panel (Fieldhouse et al. Reference Fieldhouse, Green, Evans, Mellon, Prosser and de Geus2019), using both Jewish respondents & the full UK sample as a reference. This longitudinal study contains a nationally representative sample of the UK electorate with a sample size of approximately 30,000 respondents per wave, of which between approximately 200 and 300 are Jewish. Data collection for all waves was carried out online by YouGov from February 2014 to June 2017 and has weights available for age, gender, region, and social grade.
The dependent variables we take from the BES address voting intention and leadership approval. Waves 1–6 ask respondents for their assessment of Ed Miliband, whereas waves 7 onwards ask about Jeremy Corbyn. Respondents were asked:
And if there were a UK General Election tomorrow, which party would you vote for?
How much do you like or dislike each of the following party leaders? (0–10 ordinal scale)
VOTING BEHAVIOR
Figure 1 displays the voting intention of Anglo-Jewry using cross-sectional data. There are two characteristics of this data which are immediately obvious. The level of Conservative support in both surveys is very high, both in absolute terms as well as in the difference between themselves and the Labour Party. We, therefore, have evidence supporting the emerging literature showing Anglo-Jewry to be heavily Conservative leaning in recent years. As well as this, there has also been a significant increase in this Conservative support (and a significant drop in Labour support) in the relatively short period of time between the two surveys, a shift which is made all the more notable considering that it has occurred from a very high base. As is discussed at greater length below, it is also noteworthy that between the two surveys was the 2015 General Election and the subsequent election of Jeremy Corbyn.
Voting Intention of British Jews.

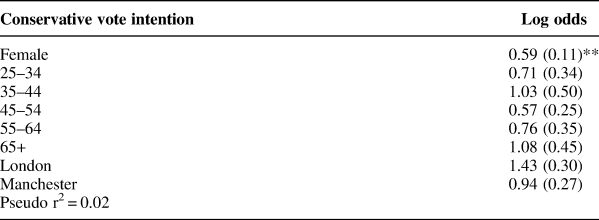
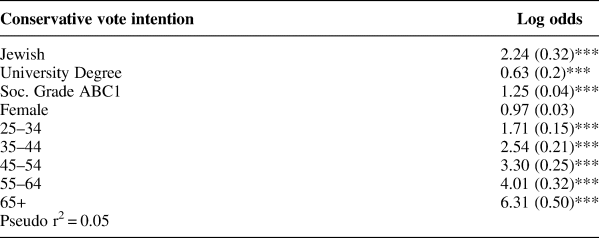
However, as mentioned at the outset, a potential explanation for the scale of this Conservative support could be due to the idiosyncrasies of the demography of British Jews. In particular, the skewed middle-class profile of Anglo-Jewry (Alderman Reference Alderman1992) makes Conservative support seem very plausible. Moreover, we are aware of other demographic skews, notably an older age profile, which is positively correlated with a higher probability of Conservative support in the wider electorate (Tilley and Evans Reference Tilley and Evans2014), and geographic concentration in certain London constituencies (Graham Reference Graham2013) which also could potentially lead us to expect greater support for the Conservatives. To account for this, the below tables show the results of two logistic regression models of Conservative vote intention, with the available demographics as predictors. Table 1 uses the May 2016 cross-sectional survey to account for gender, region, and age group. As discussed above, the BES contains greater demographic information, so Table 2 models Conservative vote intention for the UK electorate using Jewish identity as a predictor and using a wider range of controls, including social class.Footnote 6
Logistic regression of Conservative vote intention amongst British Jews

Note: May 2016 n = 817 (Don't knows, refused, and would not votes removed from the sample) * = significance at p = 0.05, ** = significance at p = 0.01, *** = significance at p = 0.00. Reference categories = Male, 18-24 & Residing outside of London & Manchester
Logistic regression of Conservative vote intention

Note: BES Wave 13 n = 28,129 (Jewish respondents n = 257) (Don't knows, refused, and would not votes removed from the sample) * = significance at p = 0.05, ** = significance at p = 0.01, *** = significance at p = 0.00. Reference categories = Non-Jewish, Non-Degree holders, Soc. Grade C2DE, Male & 18–24
Both models show that Jewish identity is positively associated with supporting the Conservatives having controlled for prominent demographic skews versus the wider electorate. The representative sample of Jewish voters shows no significant effect of age, notable given how the wider UK electorate has become highly stratified by age at recent elections (Harrison Reference Harrison2018). Equally, there is no significant effect for respondents based on region, although female Jewish voters are less likely to vote Conservative than males. Table 2 corroborates the notion that Conservative support is not just due to structural factors; Jewish identity is highly significant in predicting Conservative support accounting for class profile and education. Certainly, the suggestion that increased representation within the middle classes acts as the mechanism through which Jewish voters could become more supportive of a right-leaning party (Newman Reference Newman2015; Miller, Schmool, and Lerman Reference Miller, Schmool and Lerman1996; Graham, Schmool, and Waterman Reference Graham, Schmool and Waterman2007) is not supported by these results.
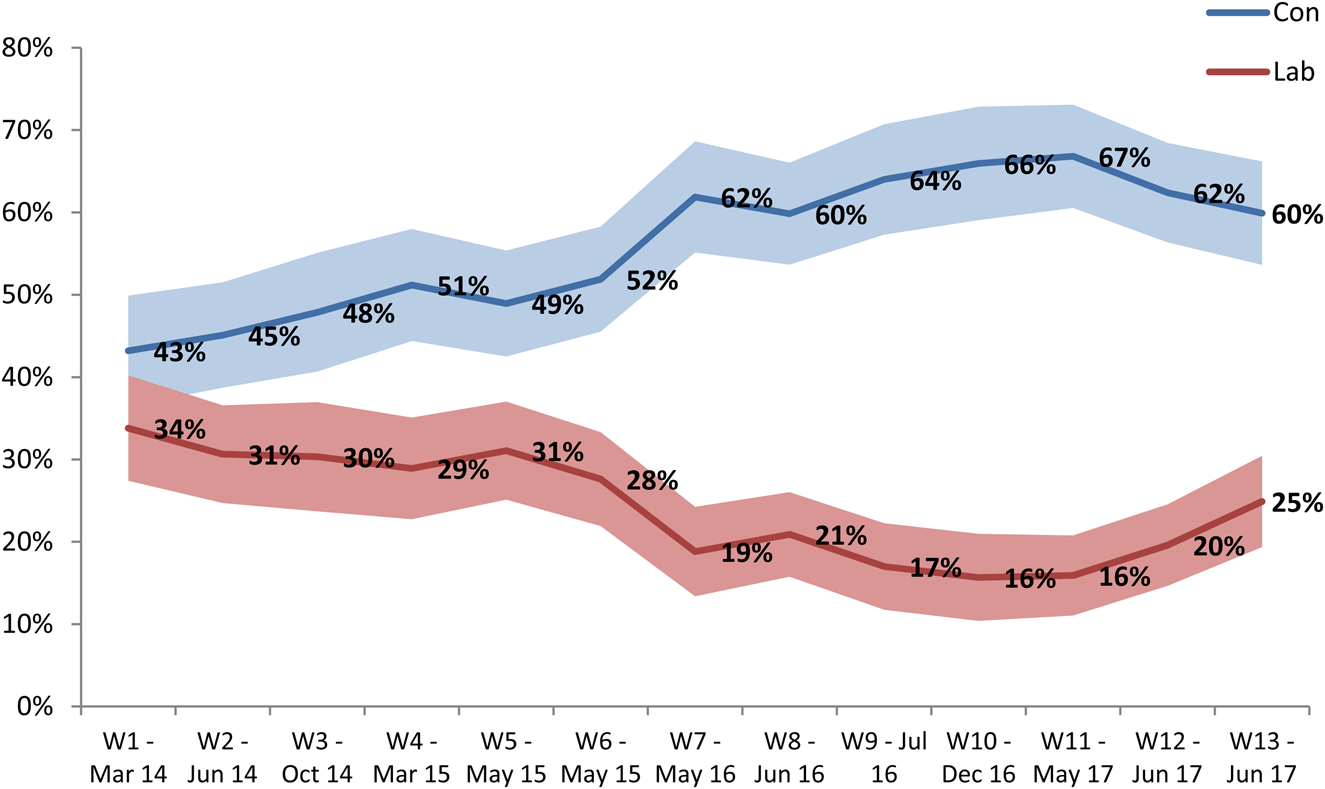
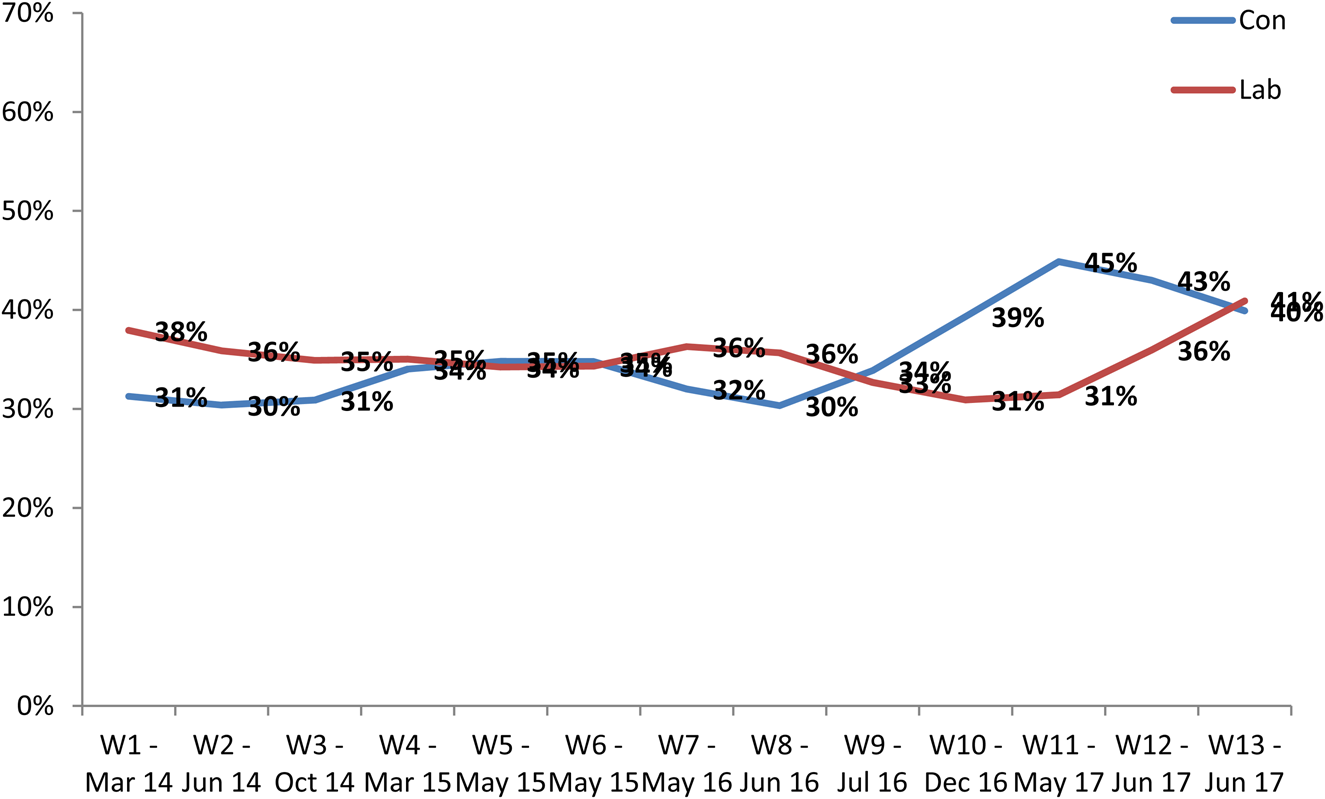
In one sense, this is already sufficient to confirm the first hypothesis. However, the above analyses are predicated on single data points and do not provide any longitudinal insight. Figure 2 uses British Election Study data to show the wave-on-wave development of party choice amongst British Jews. The results largely corroborate what we see in the cross-sectional data in that the Conservatives are ahead of Labour at each data point. However, there is a clear difference in the scale of the Tories lead before and after the 2015 General Election (Wave 6) after which the gap between the two parties sharply increases. Looking at the voting intention of the whole electorate over the same period, the same pattern is not replicated in the wider population as shown in Figure 3, where support for both main parties remains broadly static until much later.
Over Time Voting Intention of British Jews.

Over Time Voting Intention of the British Electorate.

Taken together, these results support research elsewhere that British Jews are Conservative leaning beyond what would be expected given their demographic profile, but they also show that current levels of support for the Conservatives are a recent development. There has clearly been a sharp uplift in alignment with the Tories following 2015 and the election of Jeremy Corbyn as Laboir leader.
LEADERSHIP EFFECTS
Given that the sharp shift in party support occurs when Corbyn becomes leader, and given the importance of party leaders to electoral performance (Clarke et al. Reference Clarke, Sanders, Stewart and Whiteley2004; Green and Jennings Reference Green and Jennings2017) looking at voters' evaluations of leaders over time is a sensible place to start when looking at explanatory factors for changes in party support. Indeed, if the observed shift in voting intention is driven by changing perceptions of which party best accommodates group interests, then the expectation would be worsening assessments of the Labour leader amongst Jews once Corbyn becomes leader for the reasons highlighted at the outset of this paper.
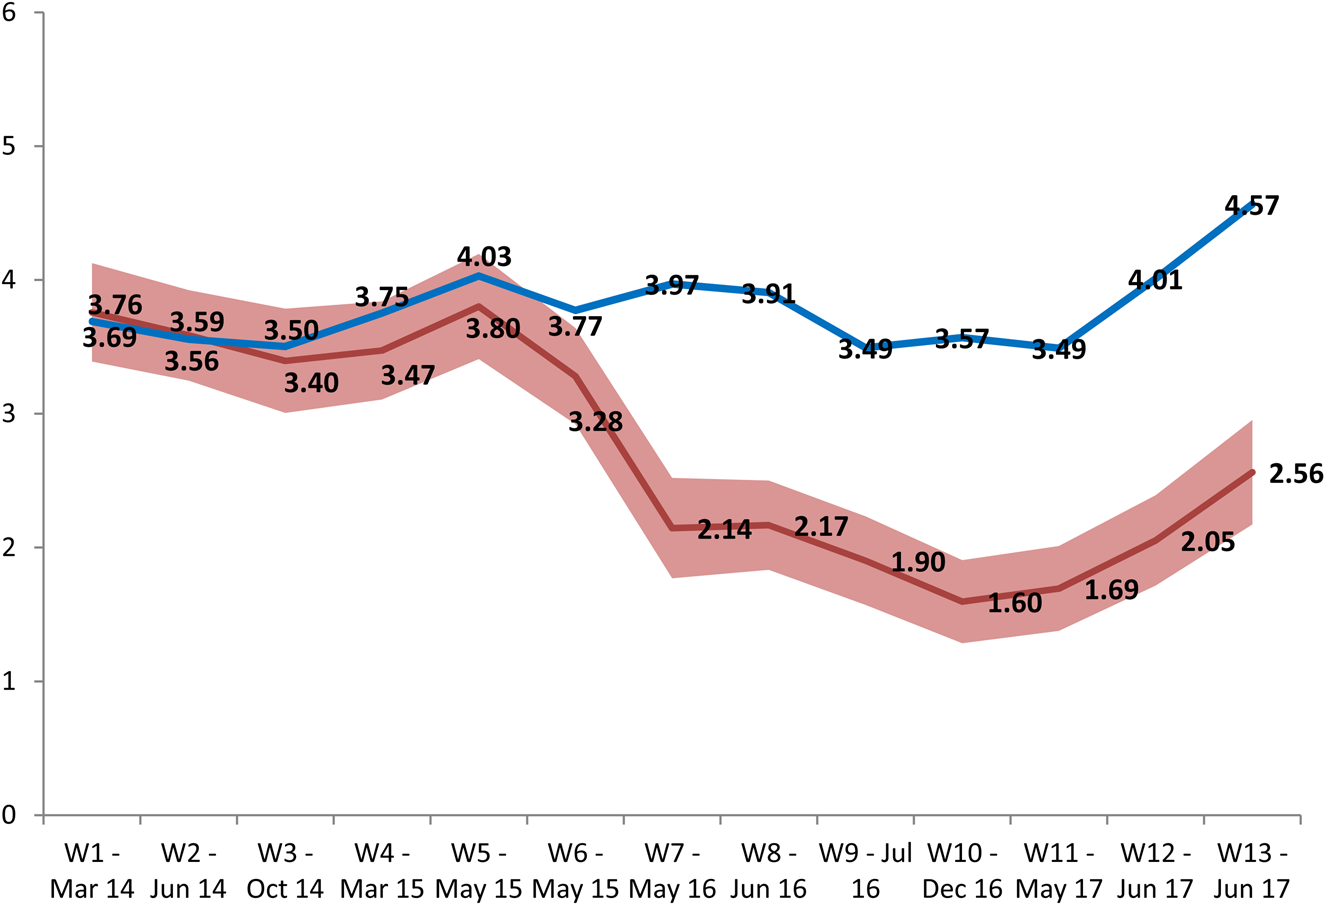
Figure 4 looks at the mean approval of the Labour leader over time during the first 13 waves of the British Election Study for Jewish respondents and the electorate as a whole. Once again, wave 7 (the first with Corbyn as leader) sees a large drop in favorability for the Labour leader amongst Jewish respondents, whereas until this point there was not a statistically significant difference between Jews and the wider electorate.
Mean Approval of Labour Leader (UK Electorate and Jewish Sample).

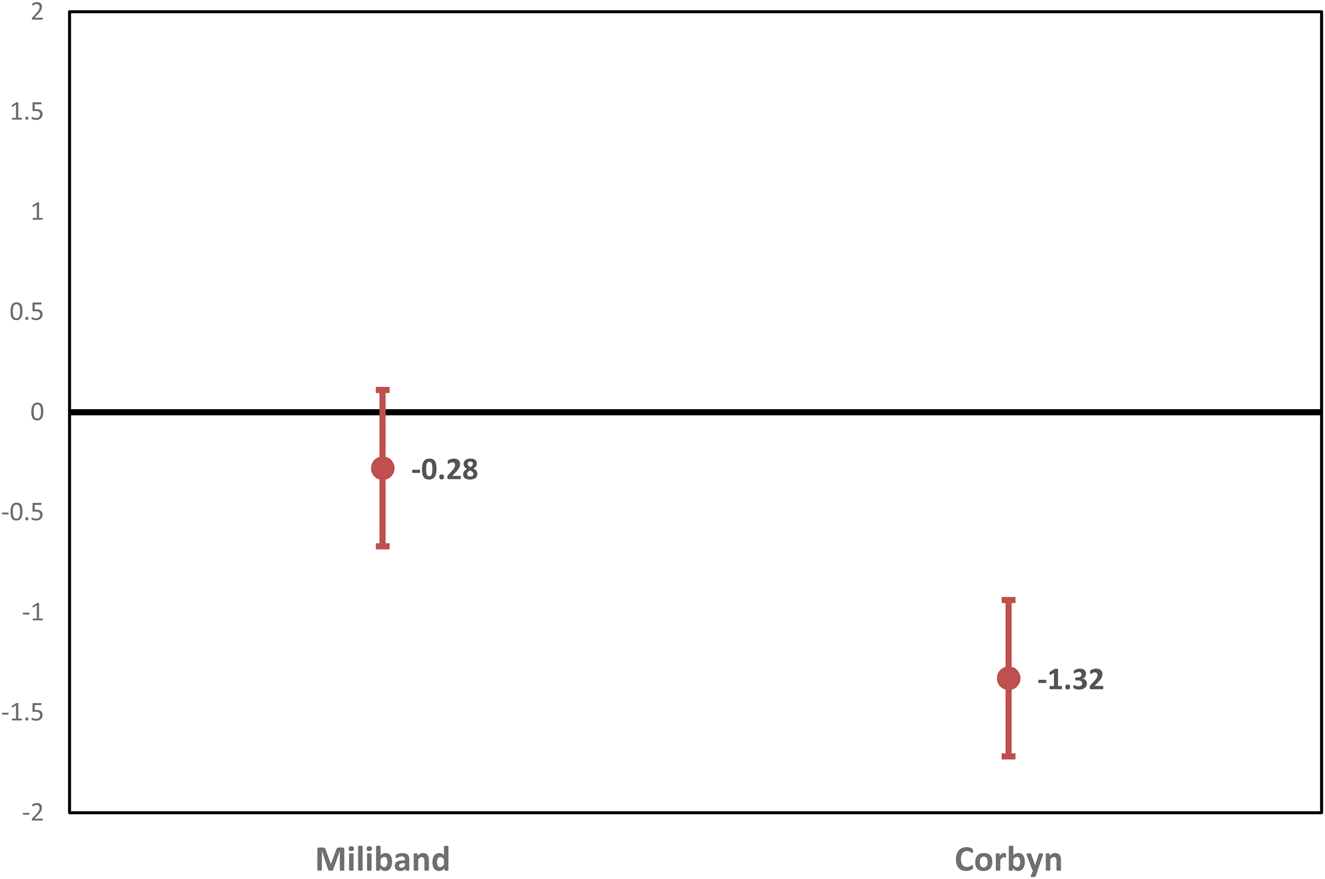
It is important to recognize that the relationship between party support and assessments of its leader is highly endogenous. It is risky to make any causal claim from the above data in isolation; negative perceptions of the leader could be driven by negative perceptions of the party or vice versa. To account for this, Figure 5 shows the coefficients for approval of both Labour leaders included in the BES using Jewish identity as a predictor. Here, we can see that the contrast between the two leaders observed in Figure 4 is borne out. There is no significant effect of Jewish identity in respondents' approval of Ed Miliband, however, Jewish identity produces a strong and highly significant negative effect of approval in the case of Jeremy Corbyn. As such, we have evidence confirming both components of our second hypothesis; Jeremy Corbyn is perceived more negatively than Ed Miliband amongst Jews, and that Jews perceive Corbyn less favorably than the general population.
Effect of Jewish Identity on Labour Leader Assessments.

ARE POLITICAL ATTITUDES DRIVEN BY MINORITY STATUS?
Jewish identity, therefore, is significant in predicting partisan preference, as well as perceptions of the current Labour Leader. These are important empirical contributions, however, the purpose of this paper is to go further conceptually in identifying the mechanism which underpins the effect of Jewish identity on political attitudes. As alluded to at the outset, this specifically relates to testing the viability of a theory of group interest as a driving factor of any distinctive attitudes that we observe. Put another way, can we associate the increased propensity to support the Conservatives with how well the party is perceived in accommodating the concerns specific to the Jewish community?
Developing appropriate measures of this concept is not straightforward. If minority group interest is to be understood as the lens through which politics is viewed differently by Jewish voters, it is difficult for a single survey item to encapsulate a broad notion. To this end, this paper follows the lead of scholars researching ethnicity and electoral politics that have employed measures of “linked fate” to develop an ethnic-based utility heuristic of the political behavior of ethnic minorities (Dawson Reference Dawson1994; Tate Reference Tate1994). In doing so, this analysis uses survey items which could be components in such a heuristic. Firstly, it addresses how well parties and their leader are perceived in their approach to i) the British Jewish community and ii) Israel and the Middle East. Secondly, it tests the relationship of feeling safe as a Jewish person with party support (thereby testing the viability of Medding's theory, which places security at the forefront of the political interests of Diaspora Jews). Lastly, it tests the importance of a party's policy towards Israel with support for the Conservatives, given how modern antisemitism is increasingly associated with employing longstanding conspiratorial tropes about Jews when discussing Israel and Zionism as discussed in the introduction. Cumulatively, these tests represent plausible aspects of a heuristic for how well parties take seriously the issue of Jewish security in the UK.
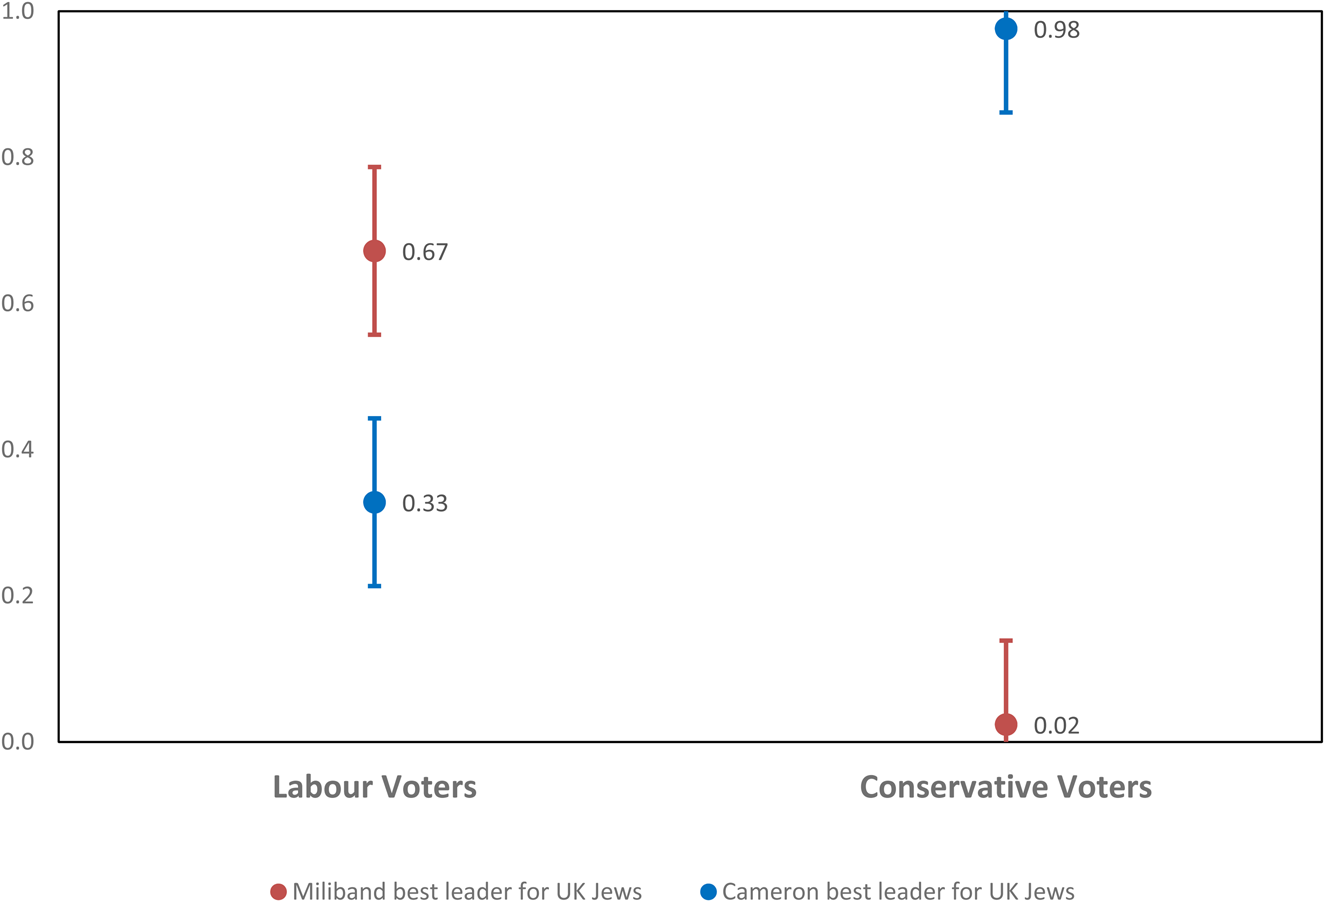
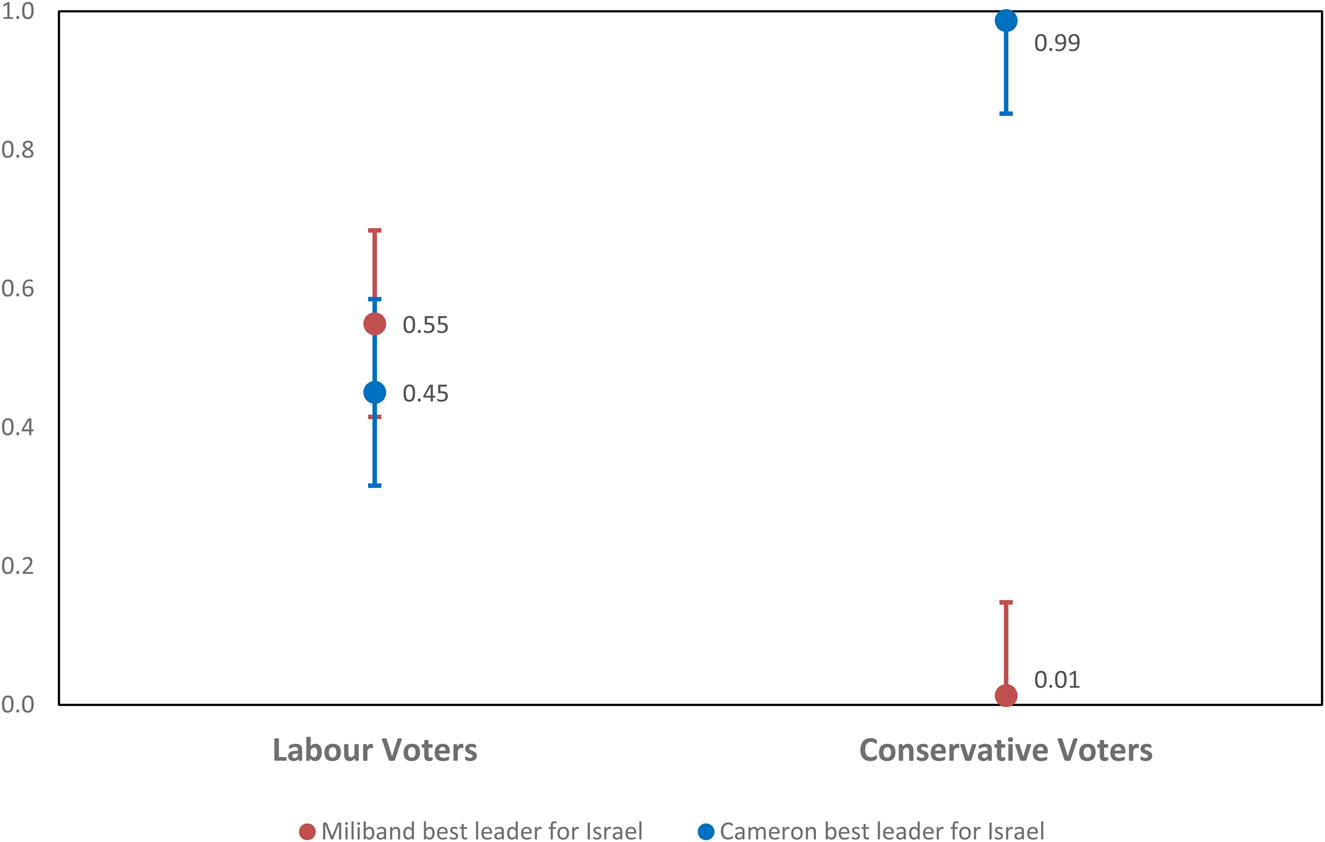
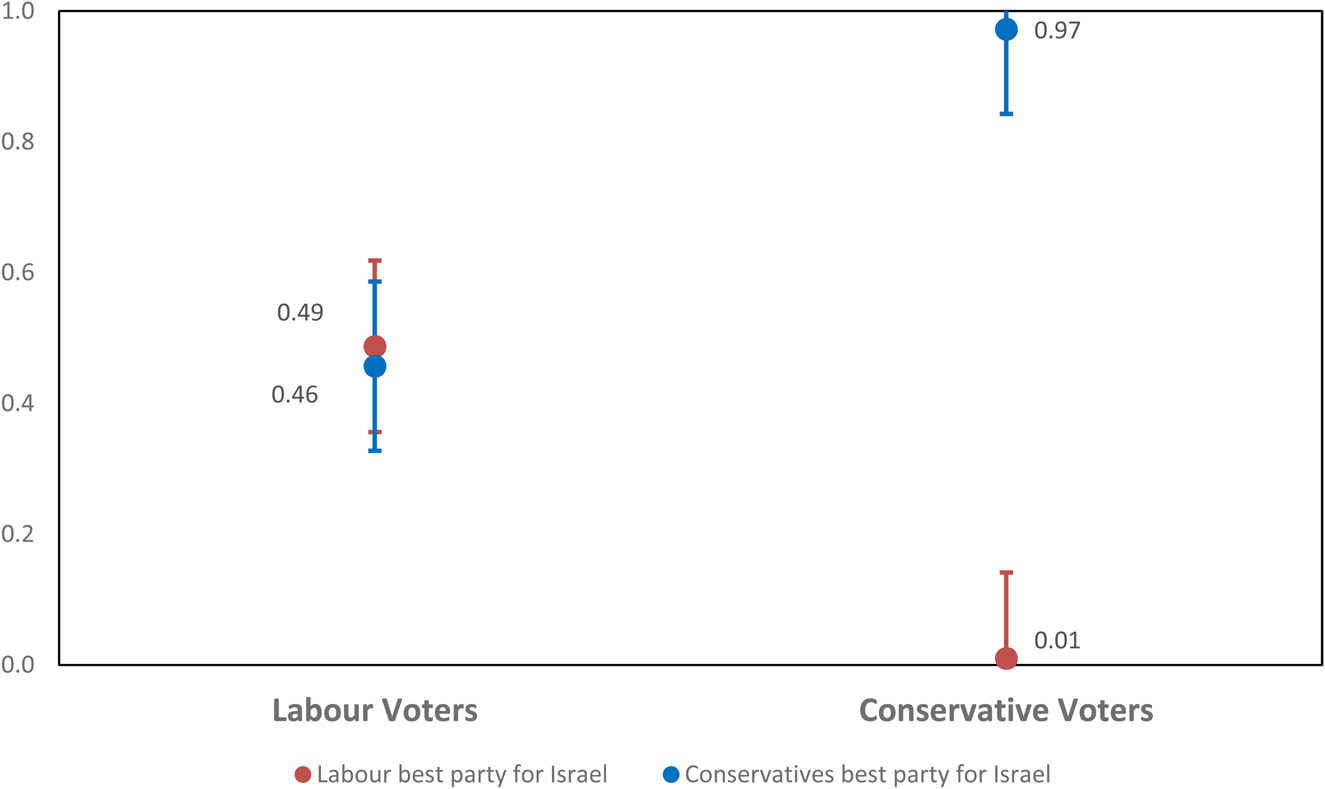
As with leadership evaluations, viewing a party (or its leader) as having the best policy towards Middle Eastern politics, or as having the best approach for the UK Jewish community is highly endogenous with which party a voter is inclined to support more generally. Inferring anything causally from this relationship therefore requires an attempt to disentangle specific perceptions of parties from overall partisan preferences. Figures 6–8 account for this by showing the marginal effects predictions of preferring a party/leader on several different measures by declared vote intention. The results for all of these follow a similar pattern; Conservative supporting Jews en masse view their party and David Cameron as a leader as having the best policy for British Jews (Figure 6) and for Israel and the Middle East (Figures 7 and 8). This is notable as this is not replicated for Labour voters; Labour voters did observe Miliband as having the best approach for UK Jews, but the difference between the two leaders is much less polarized than is the case for Conservative voters. Moreover, there is no significant preference for either Miliband or Labour in terms of their approach to Israel, even amongst respondents who still report a preference for the Labour party. These results, therefore, infer that the Conservative's outperformance of Labour here is real, and not simply a result of an endogenous relationship with party support.
Marginal Effects Predictions of Which Leader is best for British Jews

Marginal Effects Predictions of Which Leader has the best Policy towards Israel.

Marginal Effects Predictions of Which Party has the best Policy towards Israel.

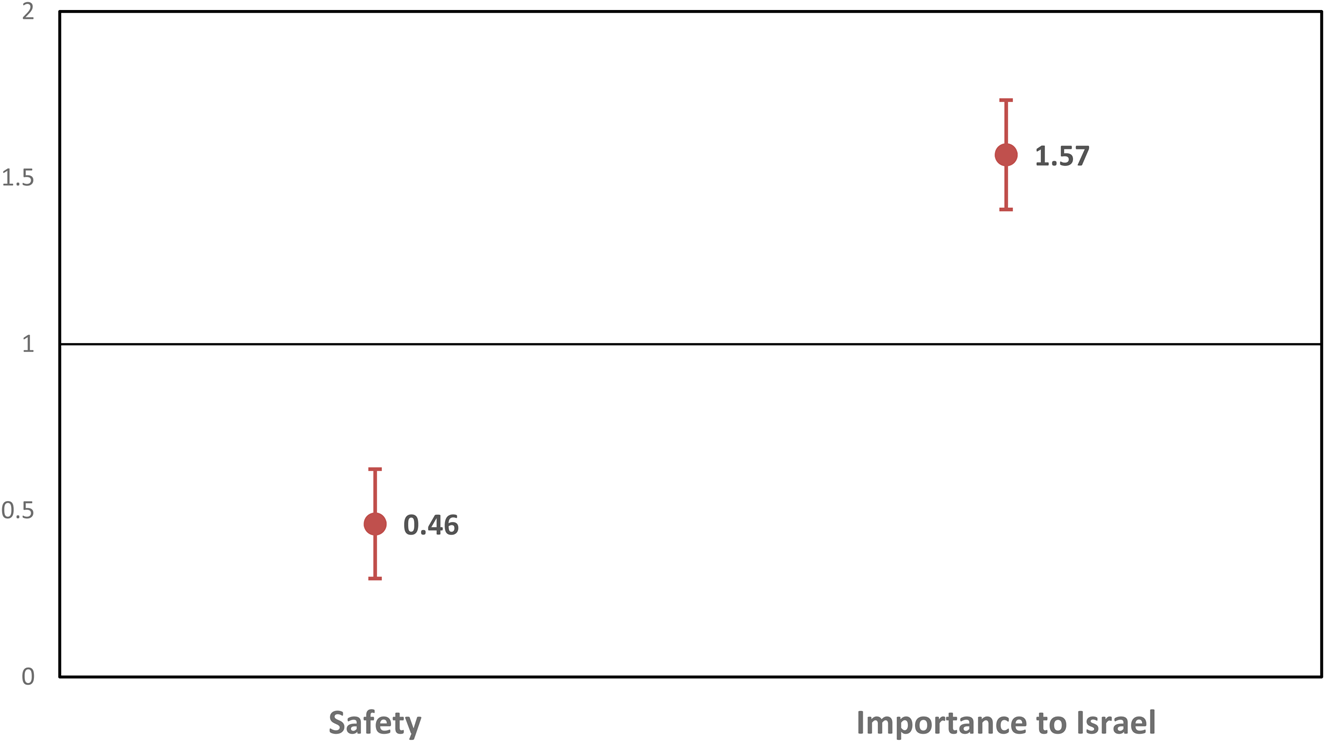
However, it does not necessarily follow that the Tories' stronger perceptions on these measures significantly influence voting behavior. To establish this link, Figure 9 plots the log odds ratios of voting for the Conservatives by two measures which are associated with a theory of minority interest; (i) how safe respondents feel as Jews within Britain and (ii) how important parties' approach to Israel is when it comes to deciding vote choice. In both cases, there are strong and highly significant effects for voting Conservative with both of these predictors. Put another way, the less secure that a respondent feels as Jewish in the UK, and the more importance they attach to a party's position to Israel, the more likely that the Conservatives are to benefit from their vote at election time.
Conservative Vote Intention by Perceptions of Safety and Israel Importance.

CONCLUSION and IMPLICATIONS
This paper makes both empirical and conceptual contributions. Empirically, it supports emerging research showing that Britain's Jews are overwhelmingly supportive of the right-of-center Conservative party. Moreover, the best evidence shows that any advantage that the Conservatives enjoyed prior to the 2015 UK General Election has been significantly exacerbated in the relatively short period since insofar as Jewish voters have moved towards supporting the Tories at a much higher rate than the wider electorate. This apparent move away from Labour is all the more notable given their historical association with the left (similar to the enduring association with their coreligionists in the United States). Notwithstanding the limitations of the available data, this is also the first time that the partisan attachments of Jewish voters have been researched longitudinally at the individual level. In this respect, it is important to reiterate that this longitudinal analysis relies upon small samples of Jewish voters without efforts to ensure representativeness of the wider Jewish community in Britain. Nevertheless, the sharp shift in party support observed over the course of one election cycle is also consistent with a large increase in the estimate of Conservative support in representative cross-sectional surveys. This triangulation of findings (as well as considering that the longitudinal analysis measures individual-level change) presents the most robust evidence to date of how partisan attitudes of Jewish voters have developed and how there has been a substantial change in the short term in contrast to the traditional understanding of the effect of religious affiliation on voting behavior.
The role of the Labour leadership following 2015 in putting off Jewish voters has to be taken into consideration when addressing the marked shift in support for the Tories. The change in leadership marks the point at which preferences show the most volatility and that perceptions of the Labour leader drop most substantially (even amongst Jewish voters still intending to support Labour). Given the allegations of antisemitism within the party during his tenure as leader, the poor evaluations of Corbyn perhaps should be expected. Nevertheless, when addressing the question of volatility when it comes to Jewish voters, it is notable that the initial fall in leadership perceptions predates almost all of the incidents which have since been cited as a part of an institutional problem that the British Labour party has with Jewish voters.
This leads on to the second major purpose of this paper; to try to advance the conceptual understanding of the mechanism which leads Jewish voters in the UK to form attachments to parties. Firstly these results emphatically support findings elsewhere (Barclay, Sobolewska, and Ford Reference Barclay, Sobolewska and Ford2019) that Jewish voters are rather cohesive in their party support and that their political attitudes are not simply reflecting other socio-economic characteristics. However, they also show volatility which existing theories of the effect of religious affiliation on voting (stressing long-term associations with parties) struggle to accommodate. Equally, theories which are based on parties using positions on religious or moral issues to court religious voters also cannot explain the volatility in this case given that these have remained essentially static during the period of the analysis. As such, another mechanism explaining how political attitudes are formed is needed.
To this end, the paper investigates how the status of British Jews as a precarious and historically persecuted minority may be influential in driving party preferences. Put differently, parties which are perceived as having the best approach to issues of specific salience to Britain's Jews, especially the security of the Jewish community, would be anticipated to be rewarded at the ballot box. The results here show that the Tories are conclusively perceived as the better option on having the best approach to the Jewish community at home as well as to Israel and the Middle East. This view is near universal amongst the large majority of Jewish voters who currently support the Conservatives, but it is telling that Labour voters do not view their party or their leader as better on these measures to anywhere near the same extent. Perhaps this suggests that Labour-leaning Jews are less concerned about a parties' approach to issues ostensibly salient to the Jewish community (or at least these measures of such issues) when deciding their vote compared to the majority of Jewish voters who vote Conservative. In any case, the stronger perceptions of the Conservatives on these measures are not simply reflecting more general party preference, and more importantly, predate the large shift in party choice that is observed post 2015.
What is more, these perceptions are related to voting behavior. Two key tenets of the theories of minority group interest, domestic security, and the importance of Israel to modern antisemitism and Jewish identity generally, are both strongly associated with supporting the Conservatives at the 2015 General Election. A limitation of the study is that the data does not allow researchers to address this association longitudinally, particularly so given the substantial change in the voting intention which occurs following this point. Nevertheless, these results present the best evidence to date supporting the notion that any distinctive political attitudes held by Jewish voters are based on the status of Jewish citizens as a precarious minority in the UK.
Regarding wider implications, there is scope to test how well these findings can be generalized outside of Britain. Indeed, Medding's original work was intended to be a general theory explaining the political preferences of Diaspora Jews, not just Jewish voters within Britain. To this end, employing similar measures in other democratic settings, such as Canada where there has been a similar realignment amongst Jewish voters, would test the extent to which the attitudes of UK Jews are generalizable. Equally, other democracies in which Jews are found disproportionately on the left, such as the United States, could be tested to see if the mechanism of arriving at party choice is similar, albeit with perceptions of threats coming from the political right rather than the left as we see in the UK. Furthermore, although the issues raised in this paper are specific to Jewish voters and it is not the intention to suggest that similar mechanisms of vote choice should necessarily apply to other religious minorities, the results nevertheless highlight how there are cases of religious minorities displaying distinctive political attitudes which existing theories of religious affiliation struggle to account for. In doing so, it opens the possibility for future research to investigate other religious groups, which may not fit into the dominant frameworks, and therefore to propose alternative mechanisms of religious voting.
Appendix
Conservative Vote by Region

Conservative Vote by Age Group

Conservative Vote by Age Group

Conservative Vote by Social Grade