Interregional traders preferred to traffic in higher-valued slaves (Pritchett and Freudenberger Reference Pritchett and Freudenberger1992). The basis of our argument is the so-called Alchian and Allen theorem—when a fixed transport cost is applied to two goods of varying quality, the relative price of the higher quality good is lower in the distant market. Because quantity demanded is inversely related to relative price, buyers in distant markets prefer to purchase relatively more of the higher quality good. This theory has a number of important implications regarding the types of slaves sold by traders.Footnote 1 Most importantly, theory suggests that the slaves chosen by traders were not a random sample of the local population and possessed observable characteristics that enhanced their market values.
Because taller slaves commanded higher market prices (Margo and Steckel Reference Margo and Steckel1982), we predict that traders chose taller slaves for shipment to distant markets. The effects of selection on the heights of slaves should be greatest for children because they experienced the largest increase in relative price (Pritchett Reference Pritchett1997, p. 73). Pritchett and Freudenberger (Reference Pritchett and Freudenberger1992) test these propositions by comparing the heights of slaves owned by traders and those owned by others. We limited our analysis to the inward coastwise manifests for New Orleans, a major slave market and the primary destination for slaves shipped within the United States (Steckel and Ziebarth Reference Steckel and Ziebarth2013, p. 803). Presumably other shippers and especially migrating planters were less selective than slave traders and shipped slaves of all types.Footnote 2 We classified a shipper as a slave trader if he sold slaves in New Orleans during the year of shipment. Using this method of identification, we find that interregional slave traders chose taller slaves for shipment to New Orleans and that the effects of selection were greatest for children and adolescents.
Traders accounted for a significant share of the slaves shipped coastwise during the antebellum period. If traders selected taller slaves, then the age/height profiles constructed from coastwise manifests will be bias upwards. Furthermore, the bias may vary across covariates of interest, such as time, space, age, and gender. Distorted age/height profiles would affect our understanding of the anthropometrics of slavery, including such issues as the age of menarche, health conditions (including the infant mortality rate), the cost/benefit analysis of slave diets, and spatial and temporal variation in the net nutritional status of slaves.Footnote 3 Because selection bias may also affect samples drawn from other populations, evidence of selective shipments by slave traders has been met with renewed interest by economic historians (Bodenhorn, Guinnane, and Mroz Reference Bodenhorn, Guinnane and Mroz2013, Reference Bodenhorn, Guinnane and Mroz2014). Sample selection bias may also affect the estimated market prices of slaves. If traders preferred to deal in higher-valued slaves, then the relationship between slave prices and observables may be endogenous (e.g., Kotlikoff Reference Kotlikoff1979, Reference Kotlikoff, Fogel and Engerman1992; Levendis Reference Levendis2007; Choo and Eid Reference Choo and Eid2008). Finally, slaveholders sometimes found it profitable to keep families together (Fogel and Engerman Reference Fogel and Engerman1974; Calomiris and Pritchett Reference Calomiris and Pritchett2009). Selective purchases by traders would pull families apart. By the trader's calculation, only some slaves were eligible for purchase and shipment to the west. Selective purchases by traders threatened the family bonds between those eligible for shipment and those who were not.
In a recent article, Steckel and Ziebarth (Reference Steckel and Ziebarth2016) find that slaves shipped by traders were not taller than those shipped by others and that age/height profiles constructed from coastwise manifests do not exhibit an upward bias. Importantly, these authors use a different method for identifying the manifests of slave traders. In this article, we argue that their identification method is flawed and their empirical estimates are attenuated towards zero. We show that traders chose taller slaves for shipment to New Orleans and as a consequence, the age-height profiles calculated from the coastwise manifests are biased upwards.
IDENTIFYING TRADERS
Our disagreement with Steckel and Ziebarth concerns the classification of manifests belonging to slave traders. The occupations of shippers were not recorded on the manifests and in nearly every case, we infer this information from other sources. Using their methodology for identifying traders, Steckel and Ziebarth find no evidence of traders choosing taller slaves whereas using our methodology, we find such evidence. In the following, we review the different methodologies used by Pritchett and Freudenberger (Reference Pritchett and Freudenberger1992) and Steckel and Ziebarth (Reference Steckel and Ziebarth2016) and discuss possible sources of classification error.
Pritchett and Freudenberger (Reference Pritchett and Freudenberger1992, p. 115) identified slave traders by comparing the names of owners with those of slave sellers listed in the New Orleans Conveyance records.Footnote 4 Those shippers who sold slaves in New Orleans during the year of shipment were classified as slave traders and all other shippers were classified as non-traders. We believe this classification scheme has much in common with accepted definitions of the slave trade.Footnote 5 In particular, we defined slave traders as shippers who traded slaves. We recognize, however, that our classification scheme is imperfect. Some traders may have transshipped slaves through New Orleans without selling any of them. In addition, some first time sellers may have been best classified as migrating planters rather than interregional traders.
Steckel and Ziebarth's classification scheme is more complex and presumably subject to greater measurement error than ours. They identify traders by comparing the surnames of shippers with those of traders as identified by Frederic Bancroft (Reference Bancroft1931) or Michael Tadman (Reference Tadman1989), and with those of slave traders listed in newspaper advertisements. Shippers with surnames and ports of departure that appeared five or more times in their sample were also classified as traders. They surmise that the vast majority of these frequent shippers were traders (Steckel and Ziebarth Reference Steckel and Ziebarth2013, p. 802).
Because comprehensive lists of slave sellers do not exist for other ports, Steckel and Ziebarth do not use our method for classifying manifests. As we will show, their classification scheme is subject to greater measurement error than ours and their empirical results are attenuated towards zero.
COMPARING CLASSIFICATION SCHEMES
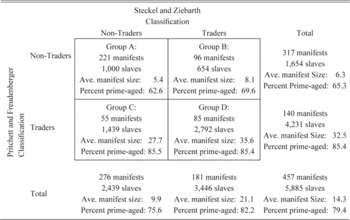
In Table 1, we cross tabulate the sample to illustrate the different classifications of the manifests. Per our request, Steckel and Ziebarth provided us with a list of manifests they attribute to the shipments of slave traders. Because they did not classify some manifests, our working sample is a subset of the original sample and includes the records of 457 manifests and a total of 5,885 slaves. Steckel and Ziebarth identify 181 manifests listing 3,446 slaves as belonging to slave traders. These records comprise 40 percent of the manifests and 59 percent of the slaves in the working sample. Using our classification method, we identified 140 manifests listing 4,231 slaves as belonging to slave traders. We find that 31 percent of manifests and 72 percent of the slaves were shipped by traders. Compared with their classification method, our method assigns fewer manifests and relatively more slaves to the shipments of slave traders.
CROSS TABULATION OF SHIPMENTS AND SLAVES USING DIFFERENT CLASSIFICATION SCHEMES

Note:
Prime-aged slaves are aged 10 to 30 years.
Source:
Inward Coastwise Manifests, New Orleans.
We find meaningful differences in the classifications of these manifests and slaves. Overall, we agree on the ownership of 64 percent of the slaves. Although the classifications are positively correlated, they are not strongly correlated (ρ=0.25). As we will show, the different classification schemes account for the different empirical results reported by Steckel and Ziebarth (Reference Steckel and Ziebarth2016) and ourselves.
Presumably, the number and types of slaves shipped by traders were influenced by a desire for profit. Consider, for example, the average number of slaves per voyage. If marketing and supervisory costs did not rise in proportion to shipment size, traders likely found it profitable to ship larger cargoes. Rather than the shipments of traders, smaller manifests probably reflect the short-term movements of servants with owners or represent the crews of ships (Tadman Reference Tadman1989, p. 61; Margo and Steckel Reference Margo and Steckel1982, p. 520). Indeed, using our classification, the average number of slaves per shipment was 6.3 for non-traders and 32.5 for traders. Using Steckel and Ziebarth's classification, the average shipment was 9.9 slaves for non-traders and 21.1 slaves for traders. For these authors, manifest size “variedly widely for traders and non-traders” (Steckel and Ziebarth Reference Steckel and Ziebarth2013, p. 803). In summary, both sets of authors find that traders shipped more slaves per voyage than did non-traders and the difference in manifest size is larger using our classification method than it is using theirs.
Alchian and Allen's theory implies that traders would select higher-valued slaves for shipment. Because prime-aged slaves commanded higher prices, we predict that traders would select relatively more prime-aged slaves than other shippers. Evidence supporting this prediction is mixed and depends on the method for classifying manifests. The trader's preference for prime-aged slaves (aged 10 to 30 years) is evident using our classification method. Prime-aged slaves comprised 85.4 percent of the slaves shipped by traders and only 65.3 percent of the slaves shipped by non-traders, a statistically significant difference of 20.1 percentage points. For Steckel and Ziebarth, the trader's preference for prime-aged slaves is much less evident. Using their method, prime-aged slaves comprise 82.2 percent of the slaves shipped by traders and 75.6 percent for those shipped by non-traders, a difference of only 6.6 percentage points. The large percentage of prime-aged slaves attributed to non-traders is especially surprising considering the non-selective character of planter migrations (Tadman Reference Tadman1989, p. 235). Consequently, evidence of selective shipments by traders is largely dependent on the choice of classification method.
Different classification schemes result in different descriptive statistics for the manifests of traders and non-traders. We seek to resolve these differences by comparing the subset of manifests where both sets of authors agree to the classification. As seen in Table 1, both set of authors attribute 221 manifests to non-traders (as indicated by group A) and 85 manifests to traders (as indicated by group D). The average number of slaves per shipment was 5.4 for non-traders (group A) and 35.6 for traders (group D). Prime-aged slaves (aged 10 to 30 years) comprise 62.6 percent of the slaves shipped by consensus non-traders (group A) and 85.4 percent of the slaves shipped by consensus traders (group D), a statistically significant difference of 22.8 percentage points. Consequently, for those slaves where both sets of authors agree as to ownership, traders had larger cargoes and preferred to ship prime-aged slaves.
Descriptive statistics presented in Table 1 provide indirect evidence of classification errors made by Steckel and Ziebarth. The difference in our empirical results and ultimately the source of our disagreement regarding the selective character of the slave trade lies in those observations where we disagree about the trading status of the shipper (as represented by groups B and C in Table 1). If Steckel and Ziebarth correctly identified the owners of these slaves, then larger cargoes and relatively more prime-aged slaves should be found in group B (manifests belonging to slave traders) than in group C (manifests belonging to other shippers). In contrast, if we are correct, then we should find the opposite result. Indeed, we find larger cargoes and relatively more prime-aged slaves in group C, who we classified as belonging to slave traders. The average shipment size was 27.7 slaves in group C and only 8.1 slaves in group B, a statistically significant difference of 19.6 slaves. Prime-aged slaves comprise 85.5 percent of the slaves in group C and 69.6 percent of the slaves in group B, a statistically significant difference of nearly 16 percentage points. The fact that larger cargoes and relatively more prime-aged slaves are found in group C than in group B suggests that Steckel and Ziebarth misclassified these manifests.
In our 1992 article, we compared the average heights of slaves shipped by traders with those of slaves shipped by non-traders. We found that the mean heights of slaves shipped by traders were greater for 39 of 44 age/gender categories and that the difference was statistically significant for 23 of these categories (Pritchett and Freudenberger Reference Pritchett and Freudenberger1992, pp. 116–17). Steckel and Ziebarth (Reference Steckel and Ziebarth2016, Tables 3 and 4) also compare the average heights of slaves by age, gender, and trader status. They, however, find no evidence that traders selected taller slaves. For westward shipments, they find that the mean heights of slaves shipped by traders were greater than those of slaves shipped by non-traders for (exactly) half of the age/gender categories (26 to 52) from which they conclude that “there is no important and systematic difference in heights by age for males or females” (Steckel and Ziebarth Reference Steckel and Ziebarth2016, p. 120).
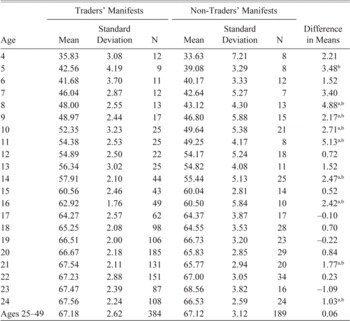
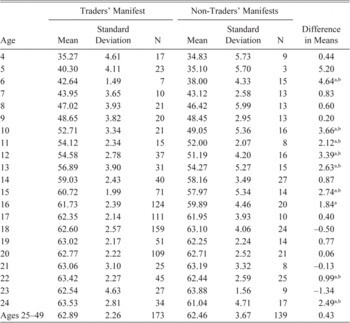
How do we resolve these conflicting empirical results? We again propose a comparison of those manifests where we both agree to the classifications. These manifests (represented by groups A and D in Table 1) record the shipment of 3,792 slaves and represent 64 percent of the observations in our working sample. The comparison of the average height of slaves shipped by consensus traders and by consensus non-traders differs from our previous comparisons. In particular, the precision of our estimates and the statistical power of our t-tests are reduced because of the smaller sample size. As seen in Tables 2 and 3, the qualitative results are quite similar to those found in our earlier article (Pritchett and Freudenberger Reference Pritchett and Freudenberger1992, pp. 116–17). The mean heights of slaves shipped by traders were greater for 38 of 44 age/gender categories. One-sided t-tests indicate that the slaves shipped by traders were significantly taller for 17 of these age/gender categories. Because the height distributions for the two groups may differ, we also estimate nonparametric Wilcoxon-Mann-Whitney tests. These results indicate statistical significance for 17 age/gender categories. For this subset of our working sample, we find strong evidence that the slaves shipped by traders were taller than those shipped by others.
The difference in our empirical results and ultimately, the source of our disagreement with Steckel and Ziebarth, lies in those observations where we disagree about the trading status of the shipper (as indicated by groups B and C in Table 1). We contend that Steckel and Ziebarth misclassified these manifests. In the following, we present examples of classification errors made by these authors.
HEIGHT BY AGE FOR MALE SLAVES EVIDENCE FROM COASTWISE MANIFESTS

a The mean height in inches of the traded slaves is significantly greater than the mean height of the non-traded slaves at the 5 percent level (one-sided t-test).
bThe mean height in inches of the traded slaves is significantly greater than the mean height of the non-traded slaves at the 5 percent level (one-sided Wilcoxon test).
Note:
Sample includes the subset of manifests where both Steckel and Ziebarth (Reference Steckel and Ziebarth2016) and Pritchett and Freudenberger (Reference Pritchett and Freudenberger1992) agree to their ownership (Groups A and D from Table 1).
Source:
Inward Coastwise Manifests, New Orleans.
CLASSIFICATION ERRORS—ERRORS OF OMISSION
Consider those manifests that we attribute to slave traders and Steckel and Ziebarth attribute to non-traders. As indicated by group C in Table 1, the 1,439 slaves in this group comprise approximately 24 percent of our working sample. Because Steckel and Ziebarth lack a comprehensive list of traders, their methodology results in some slave traders being misclassified as non-traders. Neither Bancroft nor Tadman published a complete list of slave traders. In addition, Steckel and Ziebarth did not consult other secondary sources that identified interregional slave traders.Footnote 6 They did not examine all newspapers where traders placed their advertisements.Footnote 7 Finally, not all traders advertised in newspapers. Because these sources omit the names of some traders, this classification scheme is subject to measurement error. In particular, we suspect that some shippers employed as slave traders were misclassified as non-traders.
HEIGHT BY AGE FOR FEMALE SLAVES EVIDENCE FROM COASTWISE MANIFESTS

aThe mean height in inches of the traded slaves is significantly greater than the mean height of the non-traded slaves at the 5 percent level (one-sided t-test).
bThe mean height in inches of the traded slaves is significantly greater than the mean height of the non-traded slaves at the five percent level (one-sided Wilcoxon test).
Note:
Sample includes the subset of manifests where both Steckel and Ziebarth (Reference Steckel and Ziebarth2016) and Pritchett and Freudenberger (Reference Pritchett and Freudenberger1992) agree to their ownership (Groups A and D from Table 1).
Source:
Inward Coastwise Manifests, New Orleans.
John Komlos and Bjorn Alecke (Reference Komlos and Alecke1996, p. 452) criticized our classification scheme because some owners may have sold slaves without the use of an intermediary. In fact traders both purchased slaves in the exporting areas and subsequently resold them in New Orleans. In 1829, the Louisiana legislature passed a law requiring imported slaves to be accompanied by a so-called Certificate of Good Character, attesting that the slave was of good moral character and not in the habit of running away (Freudenberger and Pritchett Reference Freudenberger and Pritchett1991). Because the certificate lists the former owner (and in many cases, the name of the buyer in the exporting area), this document in conjunction with the sales invoice provides information about the purchase by the trader and the subsequent resale in New Orleans. In Table A1, we list 15 traders misclassified as non-traders by Steckel and Ziebarth as indicated by sales information derived from the certificates of good character.Footnote 8 Consider, for example, James Huie, a trader who resided in Salisbury, North Carolina and sold slaves in New Orleans. Huie purchased 80 slaves from 59 different sellers and drove the slaves overland to the port of Mobile, Alabama. For the final leg of the voyage, Huie shipped his slaves via packet steamer to New Orleans. Because Huie purchased slaves in the exporting areas and then resold them in New Orleans, he is an example of a trader who is misclassified as a non-trader by Steckel and Ziebarth.Footnote 9
CLASSIFICATION ERRORS—MATCHING SHIPPERS WITH SLAVE TRADERS
In this section, we consider the non-traders who were misclassified as traders by Steckel and Ziebarth (this group of manifests and slaves is indicated by group B in Table 1). These manifests record the shipment of 654 slaves and represent approximately 11 percent of the working sample. Steckel began this project many years ago when data collection technology was rudimentary and data were transcribed on 80-column punch cards. Because of technology and resource constraints, Steckel dedicated only 12 columns to record the shipper's surname (Steckel and Ziebarth Reference Steckel and Ziebarth2013, p. 802). This data limitation affects the accuracy of the matches and results in the misclassification of manifests.
When an owner traveled with his slaves, the shipper and the slave owner were the same person and the manifest lists only one responsible party. For approximately 18 percent of the manifests, however, the names of both the shipper and the owner are recorded. When faced with the choice of recording the surname of the shipper or that of the owner, Steckel chose to record the shipper's name. For the purposes of this project, this decision was a mistake. Owners hired shippers to transport their slaves. The owner, not the shipper, selected the slaves for shipment. Evidence of selection bias will be found by comparing the names of slave traders with those of owners, not those of shippers. Because they compared the names of shippers with those of traders, Steckel and Ziebarth misclassified those manifests that list both shipper and owner.
When collecting these data, Steckel did not record the first names of shippers. Because of this omission, many of Steckel's matches are simply wrong. Steckel provided us with a list of manifests where the names of shippers were matched with those of traders. As seen in Table A2, most shippers have different first names than those of identified slave traders.Footnote 10 Of 28 possible matches, only three appear to be correct. Two other matches might be correct (because the secondary sources do not list the trader's first name). In other words, at least 80 percent of these manifests are misclassified, based on the matching procedure used by Steckel and Ziebarth. Because Steckel failed to collect pertinent information such as the first names of shippers, Steckel and Ziebarth misclassify the manifests of non-traders.
Steckel and Ziebarth classified shippers who made five or more voyages from the same port as slave traders.Footnote 11 Using this method, some ship captains are misclassified as slave traders. Ship captains made frequent voyages and were occasionally listed as shippers of slaves. For our working sample, we find 24 manifests where the ship captain is also listed as the shipper of slaves. Using evidence of slave sales in New Orleans, only one of these captains can be classified as a slave trader. In contrast, Steckel and Ziebarth attribute 16 of these manifests (or two-thirds) to slave traders. Consider, for example, J. E. Haviland, captain of the packet steamboat Galveston operating between the ports of Galveston and New Orleans. Steckel and Ziebarth incorrectly identify this ship captain as a trader because he made frequent voyages and because he shipped slaves (and not because he sold them).
REGRESSION ANALYSIS
In our 1992 article, we used regression analysis to estimate the effect of selective purchases by traders on the heights of slaves shipped coastwise. Rather than an indicator variable, we used an instrument for trading status to deal with the inconsistencies introduced by classification errors (Pritchett and Freudenberger Reference Pritchett and Freudenberger1992, p. 117). Much of Steckel and Ziebarth's article concerns our construction and use of this instrumental variable. In the following, we discuss their criticisms and show why they are wrong.
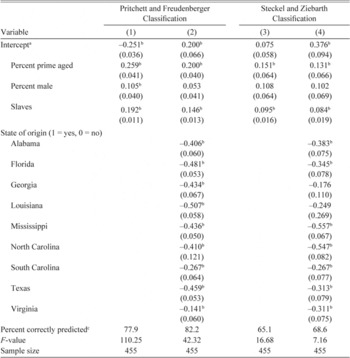
We constructed our instrumental variable from the characteristics of manifests belonging to traders. As shown previously, traders shipped larger cargoes and relatively more prime-aged slaves (aged 10 to 30 years) than other shippers. In addition, Robert W. Fogel and Stanley L. Engerman (Reference Fogel and Engerman1974) find that traders shipped relatively more males than females. Using a linear probability model, we predict the trading status of shippers and present the results in Table 4. Although this particular specification does not predict as well as our earlier model, we avoid the so-called “forbidden regression” problem (Bodenhorn, Guinnane, and Mroz Reference Bodenhorn, Guinnane and Mroz2013, p. 35). For regressions (1) and (2), the dependent variable equals 1 if the shipper is classified as a trader using our method of classification and 0 otherwise. As shown in regression (1), the model works quite well, correctly identifying 78 percent of the manifests as belonging either to traders or non-traders. In addition, the percentage prime-aged slaves, the percentage male, and the logarithm of the number of slaves are positively correlated with the shipper's trading status. All regression coefficients are statistically significant.
OLS REGRESSION OF TRADING STATUS LINEAR PROBABILITY MODEL

bFor regressions (2) and (4), the intercept refers to shipments originating from Baltimore Maryland.
bThe coefficient is statistically significant at the 5 percent level.
cPredicted probabilities compared to the mean of the dependent variable, converted to a binary variable, and then assessed as correct or incorrect.
Note:
Heteroscedasticity consistent standard errors in parentheses. For regressions (1) and (2), the dependent variable equals 1 if shipper is classified as a trader by Pritchett and Freudenberger, 0 otherwise. For regressions (3) and (4), the dependent variable equals 1 if shipper is classified as a trader by Steckel and Ziebarth, 0 otherwise.
Independent variables are defined as follows:
Percent prime aged = Number of slaves aged 11 to 30 years divided by number of slaves listed on manifest.
Percent male = Number of male slaves divided by number of slaves on manifest.
Slaves = Natural logarithm of number of slaves listed on manifest.
State of origin is defined as follows:
Alabama = 1 if port of embarkation was Mobile, 0 otherwise.
Florida = 1 if port of embarkation was Apalachicola, Key West, Pensacola, St. Marks, or Tampa Bay, 0 otherwise.
Georgia = 1 if port of embarkation was Savannah, 0 otherwise.
Louisiana = 1 if port of embarkation was New Orleans, 0 otherwise.
Mississippi = 1 if port of embarkation was Bay St. Louis or Pearlington, 0 otherwise.
North Carolina = 1 if port of embarkation was Wilmington, 0 otherwise.
South Carolina = 1 if port of embarkation was Charleston, 0 otherwise.
Texas = 1 if port of embarkation was Galveston, Port Lavaca, Matagorda, Port Isabel, or Sabine, 0 otherwise.
Virginia = 1 if port of embarkation was Alexandria, Norfolk, Petersburg, or Richmond, 0 otherwise.
Source:
Inward Coastwise Manifests, New Orleans.
Steckel and Ziebarth (p. 125) worry about the possibility of weak instruments and suggest that spatial variation accounts for “much of the relationship between the instruments and our trader variable.” We explore this possibility in regression (2) where we include indicator variables for the state of origin for the shipments. The regression coefficients for individual states are negative indicating that relative to Maryland, shipments from these states were less likely to be owned by traders. The coefficients for the percentage prime-aged slaves and the logarithm of the number of slaves are statistically significant and the F-statistic for joint significance is more than 52 (which is consistent with a highly reliable estimator). The apparent strength of our instruments is a direct consequence of our classification scheme. When we predict the trading status of the shipper using Steckel and Ziebarth's classification scheme, our instruments are much weaker. Perhaps this is not surprising because of measurement error. Consider regression (3) in Table 4, where the dependent variable equals Steckel and Ziebarth's measure of trading status. This regression does not predict as well as regression (1) and correctly identifies ownership for only 65 percent of the manifests. Following Steckel and Ziebarth, we include spatial variables indicating the state of origin in regression (4). For the percentage prime-aged slaves, the percentage male, and the logarithm of the number of slaves, the F-statistic for the test of joint significance is less than 10, which suggests weak instruments. In other words, the instruments do a poor job predicting the trading status of shippers when we use Steckel and Ziebarth's method of classification. The instruments are (very) effective when we use our method of classification. Steckel and Ziebarth worry about weak instruments because they use a weak method to classify the manifests of traders.
Steckel and Ziebarth worry about situations where the instruments directly predict the heights of slaves. “For example, one could easily imagine that shipments that are predominantly male are intended for arduous work and, hence, face strong selection on heights. In this case, we would overestimate the effect of trader status on height per se though a certain type of selection would still be occurring” (p. 120). We agree that other forms of selection bias may be present in this sample and such selection may affect our empirical tests. We differ, however, as to the direction of bias. One could easily imagine situations in which migrating planters would be tempted to leave less valuable slaves behind and replace them with more valuable slaves when they got to their destination. One could also imagine that households with “better” slaves would be more likely to move, as their slaves would be more productive in a new environment. Consequently, planters moving with their slaves could be subject to the logic of the Alchian and Allen theorem (although we suspect that the selection would be less than for traders operating on a strictly commercial basis). Under these circumstances, the tests used in this article would be stacked against finding evidence of sample selection bias.Footnote 12
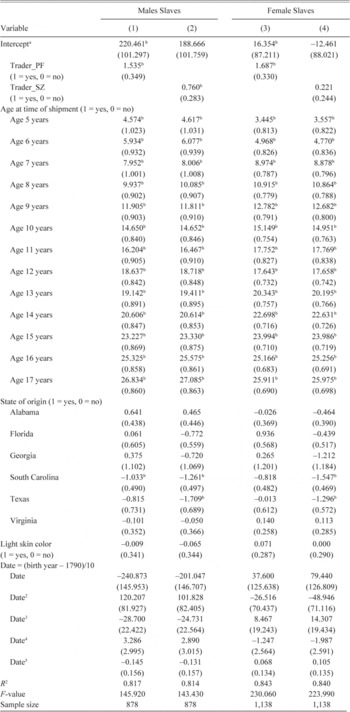
Steckel and Ziebarth (p. 120) “worry about the extent to which the ‘cure’ of instruments is worse than the ‘disease’ of bias due to classification error.” To help quell their worries, we use our original indicator for trading status in the following analysis rather than our instrument.Footnote 13 This specification allows us to compare the different classification methods used by Steckel and Ziebarth and ourselves and to estimate the possible effects of measurement error while controlling for temporal and spatial effects. As with our earlier specification, we find evidence of selective purchases by traders and that the measured effects are large and statistically significant.
Separate regressions are estimated for males and females and presented in Table 5. The dependent variable is the slave's height measured in inches. The growth profile is estimated using covariates indicating the age of the slave in years. We confine our analysis to slaves aged 4 to 17 years because the effects of selection should be greatest among the youngest slaves (see discussion in Pritchett Reference Pritchett1997). Following Steckel and Ziebarth (Reference Steckel and Ziebarth2016, p. 130), we group ports of departure by state of origin to control for spatial differences in the underlying slave populations.Footnote 14 A fifth-order polynomial in date of birth is also included to control for temporal variation in the net nutritional status of the slave population.Footnote 15 Covariates indicating shipment by a slave trader are included in the regression to measure the effects of selection. For comparison, we run separate regressions using different classifications of trading status. Following Steckel and Ziebarth (p. 130), we omit the covariate measuring the interaction of the slave's age and the trading status of the shipper. As we will show, the suggested modifications to our regression specification have little effect on our qualitative results. What does matter is the method for classifying the manifests. Using our method, we find strong evidence of selective purchases by traders. Using Steckel and Ziebarth's method, evidence of selection is much weaker because the regression coefficients are attenuated towards zero.
OLS REGRESSION OF SLAVE HEIGHTS AGES 4–17 YEARS

aFor regressions (1), (2), and (3), the intercept refers to slaves, aged four years, and shipped by a non-trader. For regressions (4), (5), and (6), the intercept refers to dark-skinned males, aged four years, shipped from a port in Maryland by a non-trader.
bThe coefficient is statistically significant at the 5 percent level.
Note:
The dependent variable is the slave's height measured in inches. Trading status of shipper is defined as follows:
Trader_PF = 1 if shipper is classified as a trader by Pritchett and Freudenberger, 0 otherwise.
Trader_SZ = 1 if shipper is classified as a trader by Steckel and Ziebarth, 0 otherwise.
State of origin is defined as follows:
Virginia = 1 if port of embarkation was Alexandria, Norfolk, Petersburg, or Richmond, 0 otherwise.
Florida = 1 if port of embarkation was Apalachicola, Pensacola, St. Marks, or Tampa Bay, 0 otherwise.
South Carolina = 1 if port of embarkation was Charleston, 0 otherwise.
Texas = 1 if port of embarkation was Galveston, Lavaca, Matagorda, or Port Isabel, 0 otherwise.
Alabama = 1 if port of embarkation was Mobile, 0 otherwise.
Georgia = 1 if port of embarkation was Savannah, 0 otherwise.
Source:
Inward Coastwise Manifests, New Orleans.
The coefficient for the variable Trader_PF indicates that the slaves shipped by traders were significantly taller than the slaves shipped by others. Males were on average 1.5 inches taller and females were 1.7 inches taller if shipped by a slave trader. For regressions (2) and (4), the variable Trader_PF is replaced with Trader_SZ (Steckel and Ziebarth's indicator for trading status). For both regressions, the estimated coefficient for Trader_SZ is relatively small. Males were 0.8 inches taller and females were 0.2 inches taller if shipped by a trader. The results using Pritchett and Freudenberger's classification are consistent with traders selecting taller slaves for shipment. Using Steckel and Ziebarth's classification, the regression results are attenuated towards zero.
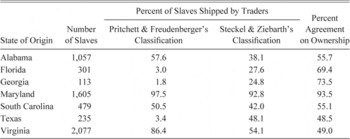
For their regressions, Steckel and Ziebarth include both state of origin and destination fixed effects. They argue that there are strong reasons to prefer their specification to ours. “The inclusions of both sets seem essential to us” (p. 123). The origin fixed effects controls for possible differences in the local slave populations whereas the destination fixed effects controls for possible differences in the uses of these slaves. Because our sample is restricted to shipments destined for New Orleans, we cannot include destination fixed effects in our regressions. (Presumably, all slaves in our sample are influenced by the same destination fixed effect.) We can include origin fixed effects and we do so with caution because of possible measurement error. Specifically, these spatial variables may be correlated with the measurement error of trading status and their inclusions may bias the regression coefficient for the trader variable. In Table 6, we cross tabulate the sample by the slave's state of origin to illustrate this possibility. Using the different classification schemes, we find considerable disagreement regarding the ownership of these slaves. For slaves departing from Maryland, we agree on the ownership of 93.5 percent of these slaves whereas for slaves departing from Texas or Virginia, we agree on the ownership of less than half of the slaves. The difference in classification schemes is especially evident for those slaves shipped from Texas ports. Because the prevailing direction of the interregional slave trade was westward, the eastward shipment of slaves by traders (from Texas to New Orleans) is unusual and a possible indication of measurement error. Using our classification, we find that only 3.4 percent of the Texas slaves are attributed to traders whereas using Steckel and Ziebarth's classification, 48.1 percent are attributed to traders (an implausibly large percentage). This lack of consensus regarding ownership is evidence of systematic variation in measurement error by port of origin. Consequently, including spatial fixed effects may bias estimates of the trader variable, especially when using Steckel and Ziebarth's classification scheme.
RELATIVE NUMBER OF SLAVES SHIPPED BY TRADERS BY CLASSIFICATION SCHEME AND PORT OF ORIGIN

Note:
Percent agreement refers to the percentage of slaves where both Steckel and Ziebarth (Reference Steckel and Ziebarth2016) and Pritchett and Freudenberger (Reference Pritchett and Freudenberger1992) agree to their ownership.
Source:
Inward Coastwise Manifests, New Orleans.
Measurement error may also bias the regression coefficients for the state of origin variables. We believe that Steckel and Ziebarth overestimated the relative number of Texas slaves shipped by traders and that the measurement error for Trader_SZ is positively correlated with the Texas indicator variable. Because traders shipped taller slaves, measurement error will decrease the estimated coefficient for the Texas indicator variable. Consider the regression results presented in Table 5. For regressions (1) and (3) where we use our classification of slave traders, the coefficients for Texas are small and not statistically significant. For regressions (2) and (4) where we used Steckel and Ziebarth's classification, the coefficients for Texas are negative and statistically significant indicating that the slaves departing from this state were unusually short. Because Trader_SZ is measure with error, the regression coefficients for the spatial variables are biased.
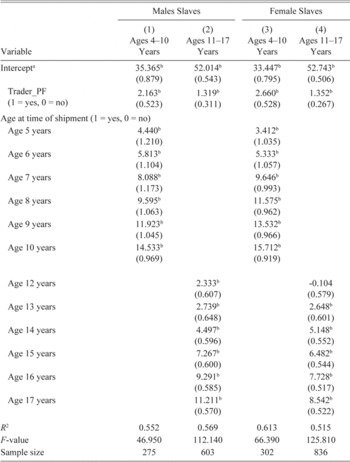
Steckel and Ziebarth (Reference Steckel and Ziebarth2016, p. 126–27) find no evidence of systematic differences in selection for any of the age groups or genders. These results are contrary to the Alchian and Allen theorem which predicts that the effect of selective purchases should be greatest among the youngest slaves. Indeed, only the tallest children would cover the cost of shipment.Footnote 16 The results of separate regressions for boys and girls, aged 4 to 10 years, and for adolescents and teenagers, aged 11 to 17 years, are presented in Table 7. Similar to Table 5, the regression coefficient for Trader_PF is positive and statistically significant. Of particular interest, the effect of selective purchases by traders was greatest for children, aged 4 to 10 years. The regression coefficient for Trader_PF indicates that boys and girls were more than two inches taller if shipped by a trader than by a non-trader. Adolescents and teenagers selected by traders were also taller than comparable slaves although the difference in stature is less evident. Overall, these regression results provide evidence of systematic selection of taller slaves by traders.
OLS REGRESSION OF SLAVE HEIGHTS AGES 4–10 YEARS AND 11–17 YEARS

a For regressions (1) and (3), the intercept refers to slaves, aged four years, shipped by a non-trader. For regressions (2) and (4), the intercept refers to slaves, aged 11 years, shipped by a non-trader.
The coefficient is statistically significant at the 5 percent level.
Note:
The dependent variable is the slave's height measured in inches. Trader_PF = 1 if shipper is classified as a trader by Pritchett and Freudenberger, 0 otherwise.
Source:
Inward Coastwise Manifests, New Orleans.
DISCUSSION
During the antebellum period, the westward migration of slaves took two basic forms: coastwise shipments from eastern ports to the Gulf coast and inland transportation (including coffles, shipments on inland waterways and, for the latter antebellum period, railroads). Because it was largely unrecorded, quantitative estimates of this gross migration have been approximated using net migration statistics derived from decennial census data. In a recent article, Steckel and Ziebarth (Reference Steckel and Ziebarth2013, p. 797) provide an exact headcount of 135,312 slaves shipped coastwise between 1810 and 1860 using the extant collection of coastwise manifests. The authors acknowledge that some manifests may be missing and as a consequence, they provide a lower bound estimate of the westward migration of slaves via coastal shipping. Despite this limitation, the authors make an important contribution by providing a quantitative estimate for these shipments.
Using the records of extant manifests, Steckel and Ziebarth (Reference Steckel and Ziebarth2013, p. 804) estimate the share of coastwise shipments made by slave traders. They estimate that traders accounted for 47.7 percent of all shipments and 53.1 percent of the westward shipments. We contend that their estimates are wrong. Steckel and Ziebarth (Reference Steckel and Ziebarth2013) identify the manifests of slave traders by comparing the surnames of shippers with those of identified traders. Shippers who made frequent voyages from the same port are also classified as traders. As we discussed previously, this method of classification is subject to measurement error. For the sample of New Orleans manifests analyzed in this article, we find that Steckel and Ziebarth attribute 59 percent of the slaves to the shipments of traders. Using our classification, we find that 72 percent of the slaves were shipped by traders (see Table 1). By our calculation, they undercount the shipments of traders by approximately 13 percentage points.Footnote 17
Steckel and Ziebarth did not estimate the slave trade's share of interregional migration. After all, traders transported slaves by both land and sea and estimates of interregional sales require information about both forms of transportation. Planters, for example, may have preferred overland migration whereas traders may have preferred coastwise shipping. Most planters owned draught animals that could pull wagons carrying household belongings, farm implements, and possibly enslaved children and older adults. In contrast, traders may have preferred the convenience and speed of sailing ships for their valuable cargo. Consequently, the trade may have accounted for a large share of the slaves shipped coastwise and a small share of the slaves shipped overland.
CONCLUSIONS
In an earlier article (Pritchett and Freudenberger Reference Pritchett and Freudenberger1992), we estimated trader selectivity by comparing the heights of slaves shipped by traders with those of slaves shipped by others. Although this empirical test is relatively simple, a complicating factor is potential error in classifying manifests belonging to slave traders. Because the manifests do not list the occupations of shippers, we inferred this information from New Orleans sales records. A comparison of the slaves shipped by traders with those shipped by others indicates that traders selected taller slaves. More recently, Steckel and Ziebarth (Reference Steckel and Ziebarth2016) classify manifests by matching the surnames of shippers with those of slave traders as identified in secondary sources and newspaper advertisements. They also identify traders as frequent shippers from specific ports. Using their methodology, they find no evidence that traders shipped taller slaves than others.
In this article, we show that Steckel and Ziebarth misclassified the manifests of slave traders. They failed to consult all newspapers or secondary sources for evidence of slave traders, they recorded the names of shippers rather than those of owners, they did not record the first names of owners resulting in incorrect matches, and they confused ship captains with slave traders. Indeed, they acknowledge that “relative to Pritchett and Freudenberger our approach to identifying traders almost surely has more measurement error” (p. 115). Using their classification method, they find that the bias in height by age due to trader selectivity was negligible. “So what is crucial is how the trader variable is defined. Our method leads to much lower estimates of the degree of selectivity” (p. 132). Because of measurement error, their empirical results are attenuation towards zero. Our results are preferred because we use a better method for classifying manifests.
In our 1992 article, we confined our analysis to a sample of inward coastwise manifests for the port of New Orleans. Because they analyze all extant manifests and more importantly, manifests from other ports, Steckel and Ziebarth did not use our method for classifying manifests. Recall that we matched the names of shippers with those of slave sellers in New Orleans. To the best of our knowledge, comprehensive lists of slave sellers do not exist for the other ports of debarkation. Consequently, Steckel and Ziebarth use an inferior method for identifying the manifests of traders, one that is prone to error. It is because of these errors that their empirical results are attenuated towards zero.