Perfection is a disease of a nation – Beyoncé
University students experience rates of depression and anxiety that are substantially higher than those found in the general population (Eisenberg, Gollust, Golberstein, & Hefner, Reference Eisenberg, Gollust, Golberstein and Hefner2007; Ibrahim, Kelly, Adams, & Glazebrook, Reference Ibrahim, Kelly, Adams and Glazebrook2013). According to the National College Health Assessment from the American College Health Association (ACHA, 2018), most students reported feeling overwhelmed (88.1%), very sad (69.9%), lonely (64.4%), and anxious (64.3%). Likewise, depression and anxiety symptoms are a growing concern in the university population. For instance, in the 2017 Center for Collegiate Mental Health (2017) report, the number of students across the United States presenting at mental health counseling services for depression, anxiety, or both has moderately increased over the last four years. However, the literature is remarkably silent about how and why depression and anxiety symptoms develop among students over time. Thus, in the current research, we examine how depression and anxiety symptoms may co-develop over time among students in their transitional year to university – a key developmental period marked by new environments, peers, academic challenges, and life obstacles.
There are multiple factors that may put a student at greater risk of experiencing these internalizing problems; such factors include, for example, interpersonal problems, academic adjustment difficulty, genetic predisposition, or personality profile (Claridge & Davis, Reference Claridge and Davis2001; Eisenberg et al., Reference Eisenberg, Gollust, Golberstein and Hefner2007). We examined self-critical perfectionism as a factor that may place students at greater risk for developing depression and anxiety symptoms in the transition to university. The need to be perfect and to achieve incredibly high standards has increased significantly over the past three decades (Curran & Hill, Reference Curran and Hill2019). Perfectionism is also a robust predictor of poor mental health outcomes (Frost, Marten, Lahart, & Rosenblate, Reference Frost, Marten, Lahart and Rosenblate1990; Hewitt & Flett, Reference Hewitt and Flett1991), and self-critical perfectionism has been put forth as a risk factor that increases the probability of depression, anxiety, and other mental health problems (Egan, Wade, & Shafran, Reference Egan, Wade and Shafran2011). The current research examines whether self-critical perfectionism affects the trajectories of anxiety and depression over the course of the first year of university.
Temporal patterns of change in depression and anxiety symptoms over time
Mental health problems, especially anxiety and depression, are common in youth, adolescence, and emerging adulthood (Chavira, Stein, Bailey, & Stein, Reference Chavira, Stein, Bailey and Stein2004). However, few studies have explored how anxiety and depressive symptoms may develop in tandem over time (Brady & Kendall, Reference Brady and Kendall1992; Cummings, Caporino, & Kendall, Reference Cummings, Caporino and Kendall2014). There is a multitude of research which has examined the developmental trajectory of anxiety or depressive symptoms across the life span (McPhie & Rawana, Reference McPhie and Rawana2015; Reddy, Rhodes, & Mulhall, Reference Reddy, Rhodes and Mulhall2003; Stice & Bearman, Reference Stice and Bearman2001; Van Oort, Greaves-Lord, Verhulst, Ormel, & Huizink, Reference Van Oort, Greaves-Lord, Verhulst, Ormel and Huizink2009). In these studies, both depressive and anxiety symptoms steadily increase during mid to late adolescence. However, one limitation of this research is that only depression or anxiety is examined in each study. Theory suggests that anxiety and depressive symptoms often co-occur over time (Cummings et al., Reference Cummings, Caporino and Kendall2014) and so research that has examined trajectories of depression or anxiety separately provide a less complete symptom picture. Furthermore, mental health problems do not occur in isolation and the influence of depressive and anxiety symptoms on each other over time may contribute to exacerbating mental health problems. Therefore, it is important to understand how depressive and anxiety symptoms develop concurrently over time.
There has been some research that has examined the trajectories of change in anxiety and depressive symptoms over time concurrently using growth curve models (Bongers, Koot, Van der Ende, & Verhulst, Reference Bongers, Koot, Van der Ende and Verhulst2003; Lutz, Leon, Martinovich, Lyons, & Stiles, Reference Lutz, Leon, Martinovich, Lyons and Stiles2007; Wood et al., Reference Wood, Van Der Mei, Ponsonby, Pittas, Quinn, Dwyer and Taylor2012). Generally, this body of work has found that symptoms of anxiety or depressive symptoms increase in a linear and gradual manner over time (Bongers et al., Reference Bongers, Koot, Van der Ende and Verhulst2003; Lutz et al., Reference Lutz, Leon, Martinovich, Lyons and Stiles2007; Wood et al., Reference Wood, Van Der Mei, Ponsonby, Pittas, Quinn, Dwyer and Taylor2012). A limitation of this research, however, has to do with the analytic approach. More specifically, the growth curve approach assumes that most participants’ trajectories of change conform to the average trajectory in the sample and so ignores the possibility that there are sub-groups of participants with different trajectories of change. This is important because it may not always be tenable to assume that the severity of anxiety and depressive symptoms develop or change, on average, in the same way for everyone. For instance, some people may more rapidly develop severe symptoms over time, whereas other people may experience little or no change in the severity of their symptoms over time, or even improve.
To address the limitation of the growth curve approach, latent class growth and growth mixture models can be used to identify subgroups of people characterized by different trajectories of change in symptoms over time. These analytic approaches are better suited to examine temporal patterns of depression and anxiety unfolding over time because these approaches examine subgroups of participants characterized by different trajectories of change over time. To our knowledge, only one study has examined the concurrent trajectories of anxiety and depressive symptoms from adolescence into emerging adulthood using latent class growth curve (LCGC) analyses. In this study, Olino, Klein, Lewinsohn, Rohde, and Seeley (Reference Olino, Klein, Lewinsohn, Rohde and Seeley2010) followed adolescents (aged 14–18 years) until age 30, and found subgroups of participants that had different trajectories, including a subgroup that had persistent depression, persistent anxiety symptoms, later onset anxiety/increasing depression, increasing depressive disorder, initially high, but decreasing anxiety disorder, and low probability of anxiety and depressive disorders group. Thus, there is some evidence that developmental trajectories of anxiety and depressive symptoms over time may differ between people. The current research aims to add to the literature by examining change in depressive and anxiety symptoms over time among university students in the transition to university – a vulnerable period for the development of mental health problems.
Perfectionism as a predictor of temporal patterns of depressive and anxiety symptoms
Thus far, we have proposed that trajectories of depressive and anxiety symptoms may differ between people. Herein, we propose that differences in the extent to which people have perfectionistic tendencies may help explain differences between trajectories of depressive and anxiety symptoms over time. Perfectionism is conceptualized as a multidimensional trait with more and less maladaptive facets (Dunkley, Zuroff, & Blankstein, Reference Dunkley, Zuroff and Blankstein2003; Frost et al., Reference Frost, Marten, Lahart and Rosenblate1990; Hewitt & Flett, Reference Hewitt and Flett1991). Although there are multiple conceptualizations of perfectionism, in the current research perfectionism was defined by its two higher order factors, personal standards and self-critical perfectionism. Factor analyses of multiple perfectionism measures consistently provide evidence that two distinct factors define perfectionism, and these measures coincide highly with the terms defined by personal standards and self-critical perfectionism (Blankstein & Dunkley, Reference Blankstein, Dunkley, Flett and Hewitt2002; Dunkley, Blankstein, Zuroff, Lecce, & Hui, Reference Dunkley, Blankstein, Zuroff, Lecce and Hui2006; Frost, Heimberg, Holt, Mattia, & Neubauer, Reference Frost, Heimberg, Holt, Mattia and Neubauer1993). Personal standards perfectionism involves striving to achieve the extremely high standards and goals an individual has set for themselves (Blankstein & Dunkley, Reference Blankstein, Dunkley, Flett and Hewitt2002; Frost et al., Reference Frost, Marten, Lahart and Rosenblate1990). Personal standards perfectionism is often used interchangeably with perfectionistic striving (Stoeber & Otto, Reference Stoeber and Otto2006). Generally, personal standards perfectionism has been found to be unrelated to mental health outcomes (Levine, Green-Demers, Werner, & Milyavskaya, Reference Levine, Green-Demers, Werner and Milyavskaya2019; Stoeber & Otto, Reference Stoeber and Otto2006). Self-critical perfectionism also involves striving for excessively high standards, but in addition includes excessive concern over mistakes, fear of failure, and harsh self-evaluation (Dunkley & Blankstein, Reference Dunkley and Blankstein2000). This more maladaptive form of perfectionism is sometimes called perfectionistic concern, evaluative concerns, or socially prescribed perfectionism (Bieling, Israeli, & Antony, Reference Bieling, Israeli and Antony2004).
Perfectionism is a robust predictor of mental health problems (e.g., Levine et al., Reference Levine, Green-Demers, Werner and Milyavskaya2019; Tabri, Werner, Milyavskaya, & Wohl, Reference Tabri, Werner, Milyavskaya and Wohl2018; Vaillancourt & Haltigan, Reference Vaillancourt and Haltigan2018) and is theorized to be an antecedent and maintenance factor of depression and anxiety (Egan et al., Reference Egan, Wade and Shafran2011). However, studies have rarely examined perfectionism in relation to both anxiety and depressive symptoms simultaneously, with most studies examining the influence of perfectionism on depressive and anxiety symptoms separately. For example, people with more (vs. less) self-critical perfectionism have more depressive symptoms over time (Levine, Milyavskaya, & Zuroff, Reference Levine, Milyavskaya and Zuroff2020; McGrath et al., Reference McGrath, Sherry, Stewart, Mushquash, Allen, Nealis and Sherry2012; Vaillancourt & Haltigan, Reference Vaillancourt and Haltigan2018). In addition, in a recent meta-analysis, which exclusively examined the influence of perfectionism on anxiety, greater self-critical perfectionism was associated with increased anxiety over time (Smith, Vidovic, Sherry, Stewart, & Saklofske, Reference Smith, Vidovic, Sherry, Stewart and Saklofske2018). There has been some research which has examined the influence of perfectionism on a collapsed measure of anxiety and depressive symptoms over time, and how perfectionism may influence anxiety and depression in separate models (Dunkley, Blankstein, Halsall, Williams, & Winkworth, Reference Dunkley, Blankstein, Halsall, Williams and Winkworth2000; Mandel, Dunkley, & Moroz, Reference Mandel, Dunkley and Moroz2015). When examining symptoms separately, different patterns emerged for depression and anxiety, such that stress reactivity emerged as a mediator for anxiety, but not depressive symptoms (Mandel et al., Reference Mandel, Dunkley and Moroz2015). Generally, prior research provides evidence for how detrimental perfectionism is for mental health but does not consider how anxiety and depressive symptoms may differ over time for different groups of individuals. The current research fills this gap in the literature by considering how perfectionism may explain differences in the trajectories of anxiety and depressive symptoms among students during their transition to university.
Perfectionism is highly correlated with trait neuroticism (Stricker, Buecker, Schneider, Preckel, & Kandler, Reference Stricker, Buecker, Schneider, Preckel and Kandler2019). Historically, it has been called into question how much self-critical perfectionism can influence depression beyond the effects of neuroticism (Coyne & Whiffen, Reference Coyne and Whiffen1995). Within the context of one's transitional year to university, these highly comorbid traits may both influence one's emotional adjustment to the university setting. Neuroticism is a trait defined generally by an individual's emotional reactivity, tendency to worry, and overall susceptibility to negative affect (Claridge & Davis, Reference Claridge and Davis2001). Akin to perfectionism, trait neuroticism has been identified as a transdiagnostic risk factor for many mental and physical disorders (Lahey, Reference Lahey2009). In twin studies, perfectionism and neuroticism have been found to share common genetic and environmental factors, but approximately half of the variance in each of these traits is unique (Burcaş & Creţu, Reference Burcaş and Creţu2021). Moreover, a meta-analysis across ten longitudinal studies found that self-critical perfectionism remained a unique and significant predictor of depressive symptoms over time even when controlling for neuroticism (Smith et al., Reference Smith, Sherry, Rnic, Saklofske, Enns and Gralnick2016). As such, although there is mounting evidence that self-critical perfectionism is a unique predictor of mental health problems above and beyond neuroticism (Smith, Sherry, Ray, Hewitt, & Flett, Reference Smith, Sherry, Ray, Hewitt and Flett2021; Zuroff, Mongrain, & Santor, Reference Zuroff, Mongrain and Santor2004), it is less known whether the influence of perfectionism on multiple mental health problems can be explained by neuroticism.
Overview of the Present Research
The current research had two aims. The first aim was to examine how depression and anxiety symptoms co-develop over time in the transition to university. To accomplish this, we conducted a secondary analysis of a large sample of students across four time points during their transitional year to university (Levine et al., Reference Levine, Milyavskaya and Zuroff2020). We started data collection in August prior to students starting their first year in university and sent follow-up surveys in November, February, and April. To examine students’ trajectories of depression and anxiety symptoms simultaneously, we used latent class growth analyses (LCGA). As such, we were able to explore how different patterns of change in depressive symptoms over time may be related to different patterns of change in anxiety symptoms over time.
The second aim was to test the hypothesis that students who are higher in self-critical perfectionism would experience greater depressive and anxiety symptoms over time relative to students who are lower on self-critical perfectionism. Support for this hypothesis was examined using LCGA in which the different patterns of change in depression and anxiety were regressed on student self-critical perfectionism scores. We expected that students who are higher in self-critical perfectionism will have consistently high and stable trajectories of depression and anxiety symptoms over time or linear increases in both depression and anxiety symptoms over time compared to students who are lower in self-critical perfectionism.
Lastly, it is important to note that we accounted for the role of personal standards perfectionism in our analyses. Personal standards perfectionism has been shown to be moderately correlated with self-critical perfectionism, depression, and anxiety (Stoeber & Gaudreau, Reference Stoeber and Gaudreau2017). Thus, to rule out the possibility that personal standards perfectionism accounts for our hypothesized effects, we included it as a covariate in the analyses. In addition, including this facet of perfectionism partials out the shared variance between these traits to allow us to understand the specific influence of self-critical perfectionism on mental health problems (Stoeber & Gaudreau, Reference Stoeber and Gaudreau2017). Neuroticism was also used as a covariate in this research. Likewise, it is well known that women experience more depression and anxiety relative to men (for a meta-analysis, see Salk, Hyde, & Abramson, Reference Salk, Hyde and Abramson2017) and so we included participants’ self-identified gender as a covariate in the analyses. All supplementary information pertaining to this study, including preregistration of hypotheses and analytical plans, data, code and full output for all analyses, and all materials can be found on the Open Science Framework (OSF): https://osf.io/nw9fs/.
Method
Participants and procedure
Participants were 658 students (M age = 17.98, SD age = 1.10; 27.7% male, 71.5% female, 0.8% other) entering university for the first time in Fall of 2016. Participants were recruited online through departmental emails, social media (Facebook & Reddit), and through advertisements in the frosh welcome packages to participate in a longitudinal study on the transition to university. Most (85.3%) of students went to the institution at which this research was conducted, 10.5% went to other Canadian universities and 4.3% attended American universities. In addition, 55.8% of students reported living in university dorms, 31.3% reported living at home, and 12.9% reported living off campus either alone or with roommates. At the initial time point, participants were excluded if they completed less than half of the survey. The time points of the study were late August prior to the beginning of university, November, February, and April. At the second time point, participants were 462 students (70.2% retention, M age = 17.97, SD age = 1.15; 26% male, 73.4% female, 0.6% other). At the third time point, participants were 427 students (64.9% retention, M age = 17.97, SD age = 1.16; 24.4% male, 74.8% female, 0.8% other). At the last time point, participants were 358 students (54.4% retention, M age = 17.98, SD age = 1.17; 24.3% male, 75.1% female, 0.6% other).
Prior to taking part in the study, each participant was asked to read over and agree to the informed consent. Afterwards, each participant completed a series of demographic questions, followed by a series of questionnaires including perfectionism, depression, and anxiety.Footnote 1 At each subsequent time point participants completed questionnaires on depressive and anxiety symptoms. At the final time point, participants were debriefed, and they received a ticket for each survey completed that entered them into a draw for a chance to win $100.
Measures
Self-critical perfectionism
A modified combination of the Depressive Experiences Scale – Self-criticism Six-Item Scale (DEQ-SC6), the Frost Multidimensional Perfectionism Scale (Frost-MPS) and the Revised Almost Perfect Scale (Revised-APS) were used to measure the facet of self-critical perfectionism (Blatt, D'Afflitti, & Quinlan, Reference Blatt, D'Afflitti and Quinlan1976; Frost et al., Reference Frost, Marten, Lahart and Rosenblate1990; Slaney, Rice, Mobley, Trippi, & Ashby, Reference Slaney, Rice, Mobley, Trippi and Ashby2001). These scales have been shown to load strongly together on a single factor of self-critical perfectionism and have been used in previous research to measure this construct (Dunkley et al., Reference Dunkley, Blankstein, Zuroff, Lecce and Hui2006). The DEQ-SC6 has six items and participants report how much they agree with a statement on a scale of 1 “strongly disagree” to 7 “strongly agree.” An example item from this scale is “I tend to be very critical of myself.” The Frost-MPS has five items which measure self-criticism and participants report how much they agree with each item on a scale of 1 “strongly disagree” to 5 “strongly agree” (this was later converted to a 7-point scale score by multiplying each term by 1.5 and subtracting 0.5 so we could compute an average score across all the scales). An example item is “If I fail at work/school, I am a failure as a person.” The revised-APS has four items which measure self-criticism and participants report how much they agree with a statement on a scale of 1 “strongly disagree” to 7 “strongly agree.” An example item is “I am hardly ever satisfied with my performance.” A self-critical perfectionism score was computed by taking the mean score across all the items. (α = .89)
Personal standards perfectionism
The Frost-MPS and the Revised-APS measured the facet of personal standards perfectionism (Frost et al., Reference Frost, Marten, Lahart and Rosenblate1990; Slaney et al., Reference Slaney, Rice, Mobley, Trippi and Ashby2001). These scales load highly onto the factor of personal standards perfectionism and have been used in previous research to measure this (Dunkley et al., Reference Dunkley, Blankstein, Zuroff, Lecce and Hui2006). The Frost-MPS has five items which measure perfectionistic striving and participants reported how much they agreed with a statement on a scale of 1 “strongly disagree” to 5 “strongly agree” (this was later converted to a 7-point scale score by multiplying each term by 1.5 and subtracting 0.5). An example item includes “I set higher goals than most people.” The revised-APS has four items which measure perfectionistic striving and participants reported how much they agreed with a statement on a scale of 1 “strongly disagree” to 7 “strongly agree.” An example item includes “I expect the best from myself.” A personal standards perfectionism score was computed by averaging across all of the items (α = .89).
Depressive symptoms
The Center for Epidemiological Studies Depression Scale Revised (CESD-R) was used to measure severity of depressive symptoms (Eaton, Smith, Ybarra, Muntaner, & Tien, Reference Eaton, Smith, Ybarra, Muntaner and Tien2004). The CESD-R has 20 items and participants report how often they have felt a certain way within the past week or so on a scale of 1 “not at all or less than one-day last week” to 5 “nearly every day for two weeks.” Example items are “my appetite was poor” and “nothing made me happy.” At time points 2–4 one item was removed from this scale regarding suicidality at the university ethic's board request (the removed item stated “I wished I were dead”). An average was taken of all the responses to compute a depressive symptoms severity score (αT1 = .93, αT2 = .93, αT3 = .95, αT4 = .95).
Anxiety symptoms
The Brief Symptom Inventory (BSI) was used to measure anxiety (Derogatis & Melisaratos, Reference Derogatis and Melisaratos1983). This scale has concurrent validity with longer and more comprehensive assessments of anxiety symptoms (Derogatis & Melisaratos, Reference Derogatis and Melisaratos1983). The BSI has six items and participants rate how much they have been bothered by each symptom during the past week on a scale of 1 “not at all” to 5 “extremely.” Example items include “nervousness or shakiness inside” and “feeling fearful.” An average was taken of all the responses to compute an anxiety symptoms severity score (αT1 = .90, αT2 = .90, αT3 = .92, αT4 = .92).
Neuroticism
The 44-item Big Five Inventory (BFI) was used to measure the trait neuroticism (John & Srivastava, Reference John and Srivastava1999). The BFI has eight items which measure neuroticism and participants reported how much they agreed with a statement on a scale of 1 “strongly disagree” to 5 “strongly agree” Example items includes “can be tense” and “gets nervous easily.” A neuroticism score was computed by averaging across the items. (α = .83)
Data analytic approach
We preregistered four sets of analyses (see OSF). However, the second, third, and fourth sets of analyses were replaced with a new analysis suggested by one of the reviewers. Results from the original (preregistered) analyses yielded conceptually similar results; the output and write-up of those analyses are on OSF. In all analyses, participants with missing data were included using full information maximum likelihood (FIML). Analyses were conducted using Mplus version 8 (Muthén & Muthén, Reference Muthén and Muthén2015). All code and output can be found on OSF.
First, unconditional latent growth curve (LGC) analyses were carried out to determine the best fitting model of change for depression and anxiety, respectively. The chi-square test of model fit (χ2), comparative fit index (CFI), and root mean square error of approximation (RMSEA) were used to evaluate model fit. An excellent fit would be reflected by a χ2 that is not statistically significant, a CFI close to 1, RMSEA of .05 or less with zero in its 95% confidence interval, and standardized root mean square residual (SRMR) less than .08 (see Kline, Reference Kline2016). However, because the sample size was large, the χ2 test may be overpowered and thus statistically significant when there are only small differences between the model estimates and the data. Thus, the adjudication of model fit was largely based on the results of CFI, RMSEA, and SRMR. A chi-square difference test (Δχ2) was used to evaluate whether a nonlinear (quadratic) model provided a better fit to the data relative to the linear model. If Δχ2 was statistically significant, then subsequent analyses involved specifying and fitting a nonlinear (quadratic) model to the data. However, if Δχ2 was not statistically significant, then all subsequent analyses involved specifying and fitting a linear model to the data.
Second, a latent class growth curve analysis was conducted to examine subgroups of change in depression and anxiety, simultaneously. The Bayesian information criterion (BIC) and the Lo, Mendell, and Rubin (Reference Lo, Mendell and Rubin2001) likelihood ratio test (LMR-LRT) were used initially to determine the number of classes in the data. The best fitting model in terms of BIC was determined using the “elbow” method (Masyn, Reference Masyn and Little2013). The “elbow” method involves testing a series of models with different number of classes. The BIC values are plotted and the model at which decreases in BIC values starts to diminish relative to the addition of more classes is identified. We also considered results from the LMR-LRT. If the LMR-LRT value based on a comparison of two models was statistically significant, then the model with the larger number of classes was favored. However, if the LMR-LRT was not statistically significant, then the BIC values of the two models were compared. We also conducted checks for interpretability and precision of the model results (i.e., having no less than 1% of total count in a class, high entropy close to 1, and classification probabilities close to 1). If these checks were successful, then the bootstrap likelihood ratio test (BLRT) was used to confirm model fit. The BLRT is a relative model test, with a statistically significant value indicating that the k+1 class model fits the data better than k class model.
Third, a conditional LCGC model was conducted to examine whether self-critical perfectionism is associated with class membership indexing different trajectories of change in depression and anxiety. With a well-fitting LCA model, we used the R3STEP approach in Mplus to examine predictors of class membership. In the R3STEP approach, self-critical perfectionism and other covariates were included as predictors of class membership for the final or chosen unconditional LCA model. Of note, in the R3STEP approach, the measurement parameters of the latent classes from the final or chosen unconditional LCA are fixed while also accounting for classification error. With the R3STEP approach, the link between self-criticism and other covariates on the one hand and class membership on the other hand is estimated using a multinomial regression analysis. We report the results of the multinomial regression analysis in which the reference trajectory of change is the low stable trajectory. Results for when a different reference trajectory of change is reported in the supplemental material on OSF.
Results
Preliminary analysis
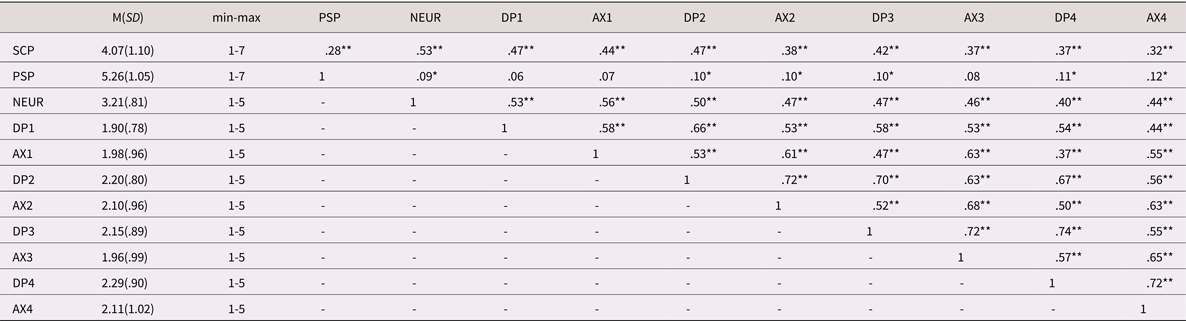
Table 1 summarizes the descriptive statistics for the variables of interest. Anxiety and depressive symptoms were positively correlated across all time points. This relation was large and increased slightly from the first time point to subsequent time points. Self-critical and personal standards perfectionism were positively correlated at Time 1, r(656) = .28, p < .001. Neuroticism was moderately and positively correlated with self-critical perfectionism (r(656) = .53, p < .001). In contrast, neuroticism was positively and weakly correlated with personal standards perfectionism [r(656) = .09, p = .024] at Time 1. Self-critical perfectionism and neuroticism were positively correlated with anxiety and depressive symptoms over the academic year. Personal standards perfectionism was positively correlated with some distress symptoms over the academic year, but these relationships were consistently small (r < .13).Footnote 2
Descriptive statistics for all key variables

Note: SCP = self-critical perfectionism, PSP = personal standards perfectionism, DP = depressive symptoms, AX = anxiety symptoms NEUR = neuroticism.
* = p < .05, **= p < .001
Trajectory of depressive and anxiety symptoms separately
The trajectories of depressive and anxiety symptoms were examined separately to determine whether a linear or quadratic pattern provided a better fit. The linear model of change in depression fit the data in terms of CFI and SRMR, but not RMSEA, χ2 (5) = 30.066, p < .001, CFI = .946, RMSEA = .088 [.059, .117], SRMR = .049. Likewise, the quadratic model provided fit the data in terms of CFI and SRMR, but not RMSEA, χ2 (1) = 26.582, p < .001, CFI = .945, RMSEA = .199[.138, .267], and SRMR = .038. However, the quadratic model did not provide a better fit to the data relative to the linear model, Δχ2 (4) = 7.852, p = .097. As such, the linear model was retained.
The linear model of change in anxiety fit the data in terms of CFI and SRMR, but not RMSEA, χ2 (5) = 20.291, p = .001, CFI = .964, RMSEA = .069[.039, .101], SRMR = .041. Likewise, the quadratic model fit the data in terms of CFI and SRMR, but not RMSEA, χ2 (1) = 17.006, p<.001, CFI = .962, RMSEA = .158[.098, .227], SRMR = .039. However, there were convergence problems with the results of the quadratic model in that the variance of the linear slope factor was negative. Such statistical anomalies often occur when the tested model is mis-specified. As such, the linear model was favored over the quadratic model.
LCGA for depressive and anxiety symptoms simultaneously
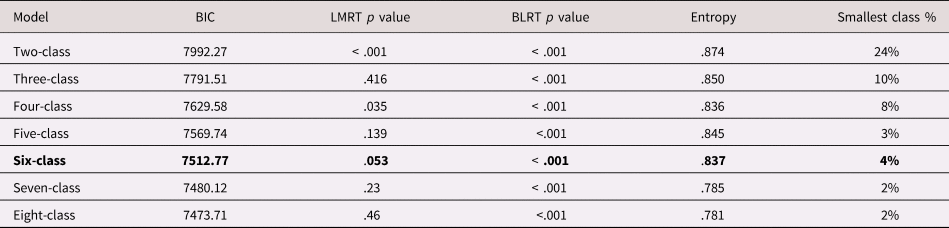
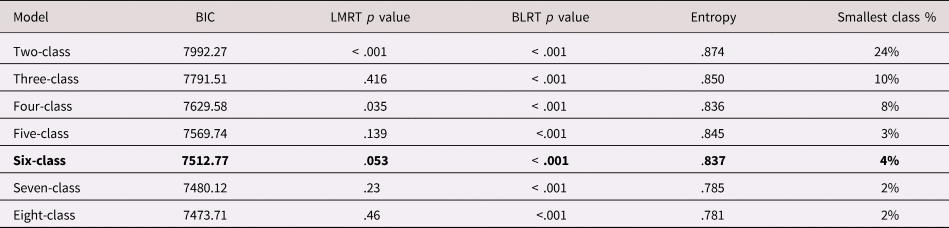
A LCGA was conducted to examine subgroups in the trajectories of depressive and anxiety symptoms simultaneously to determine the most parsimonious combination of classes for anxiety and depressive symptoms. Table 2 summarizes the values for BIC, LMRT, BLRT, entropy, and the size of the smallest class.
A comparison of selection criteria to determine the best number of trajectory classes
BIC = Bayesian information criteria; BLRT = bootstrap likelihood ratio test; LMRT= Lo-Mendell-Rubin test.
Note. The BLRT did not converge for the eight-class model and so should not be trusted.
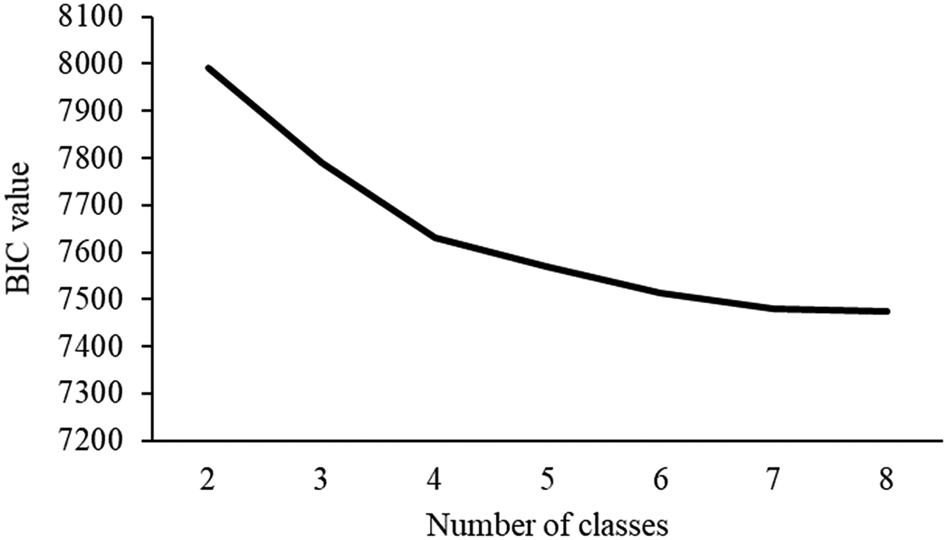
Based on the elbow method (Masyn, Reference Masyn and Little2013), results indicated that the six-class model provided the best fit to the data in terms of BIC (see Figure 1). As well, the seven-class model did not provide a stronger fit to the data compared to the six-class model in terms of LMRT. Likewise, the eight-class model did not provide a stronger fit to the data compared to the seven-class model in terms of LMRT. As well, entropy values for the seven-class and eight-class models were below .800 compared to the six-class model, thereby indicating poorer precision in class membership assignment. As such, the six-class model was considered the best fitting model.
Plot of the Bayesian information criterion values as function of class numbers from the latent class growth curve analyses.

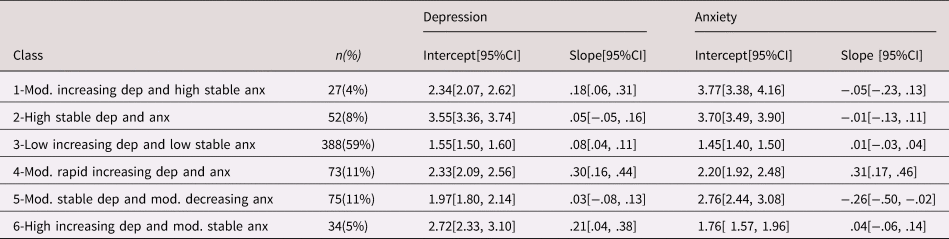
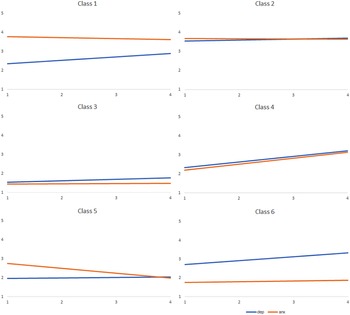
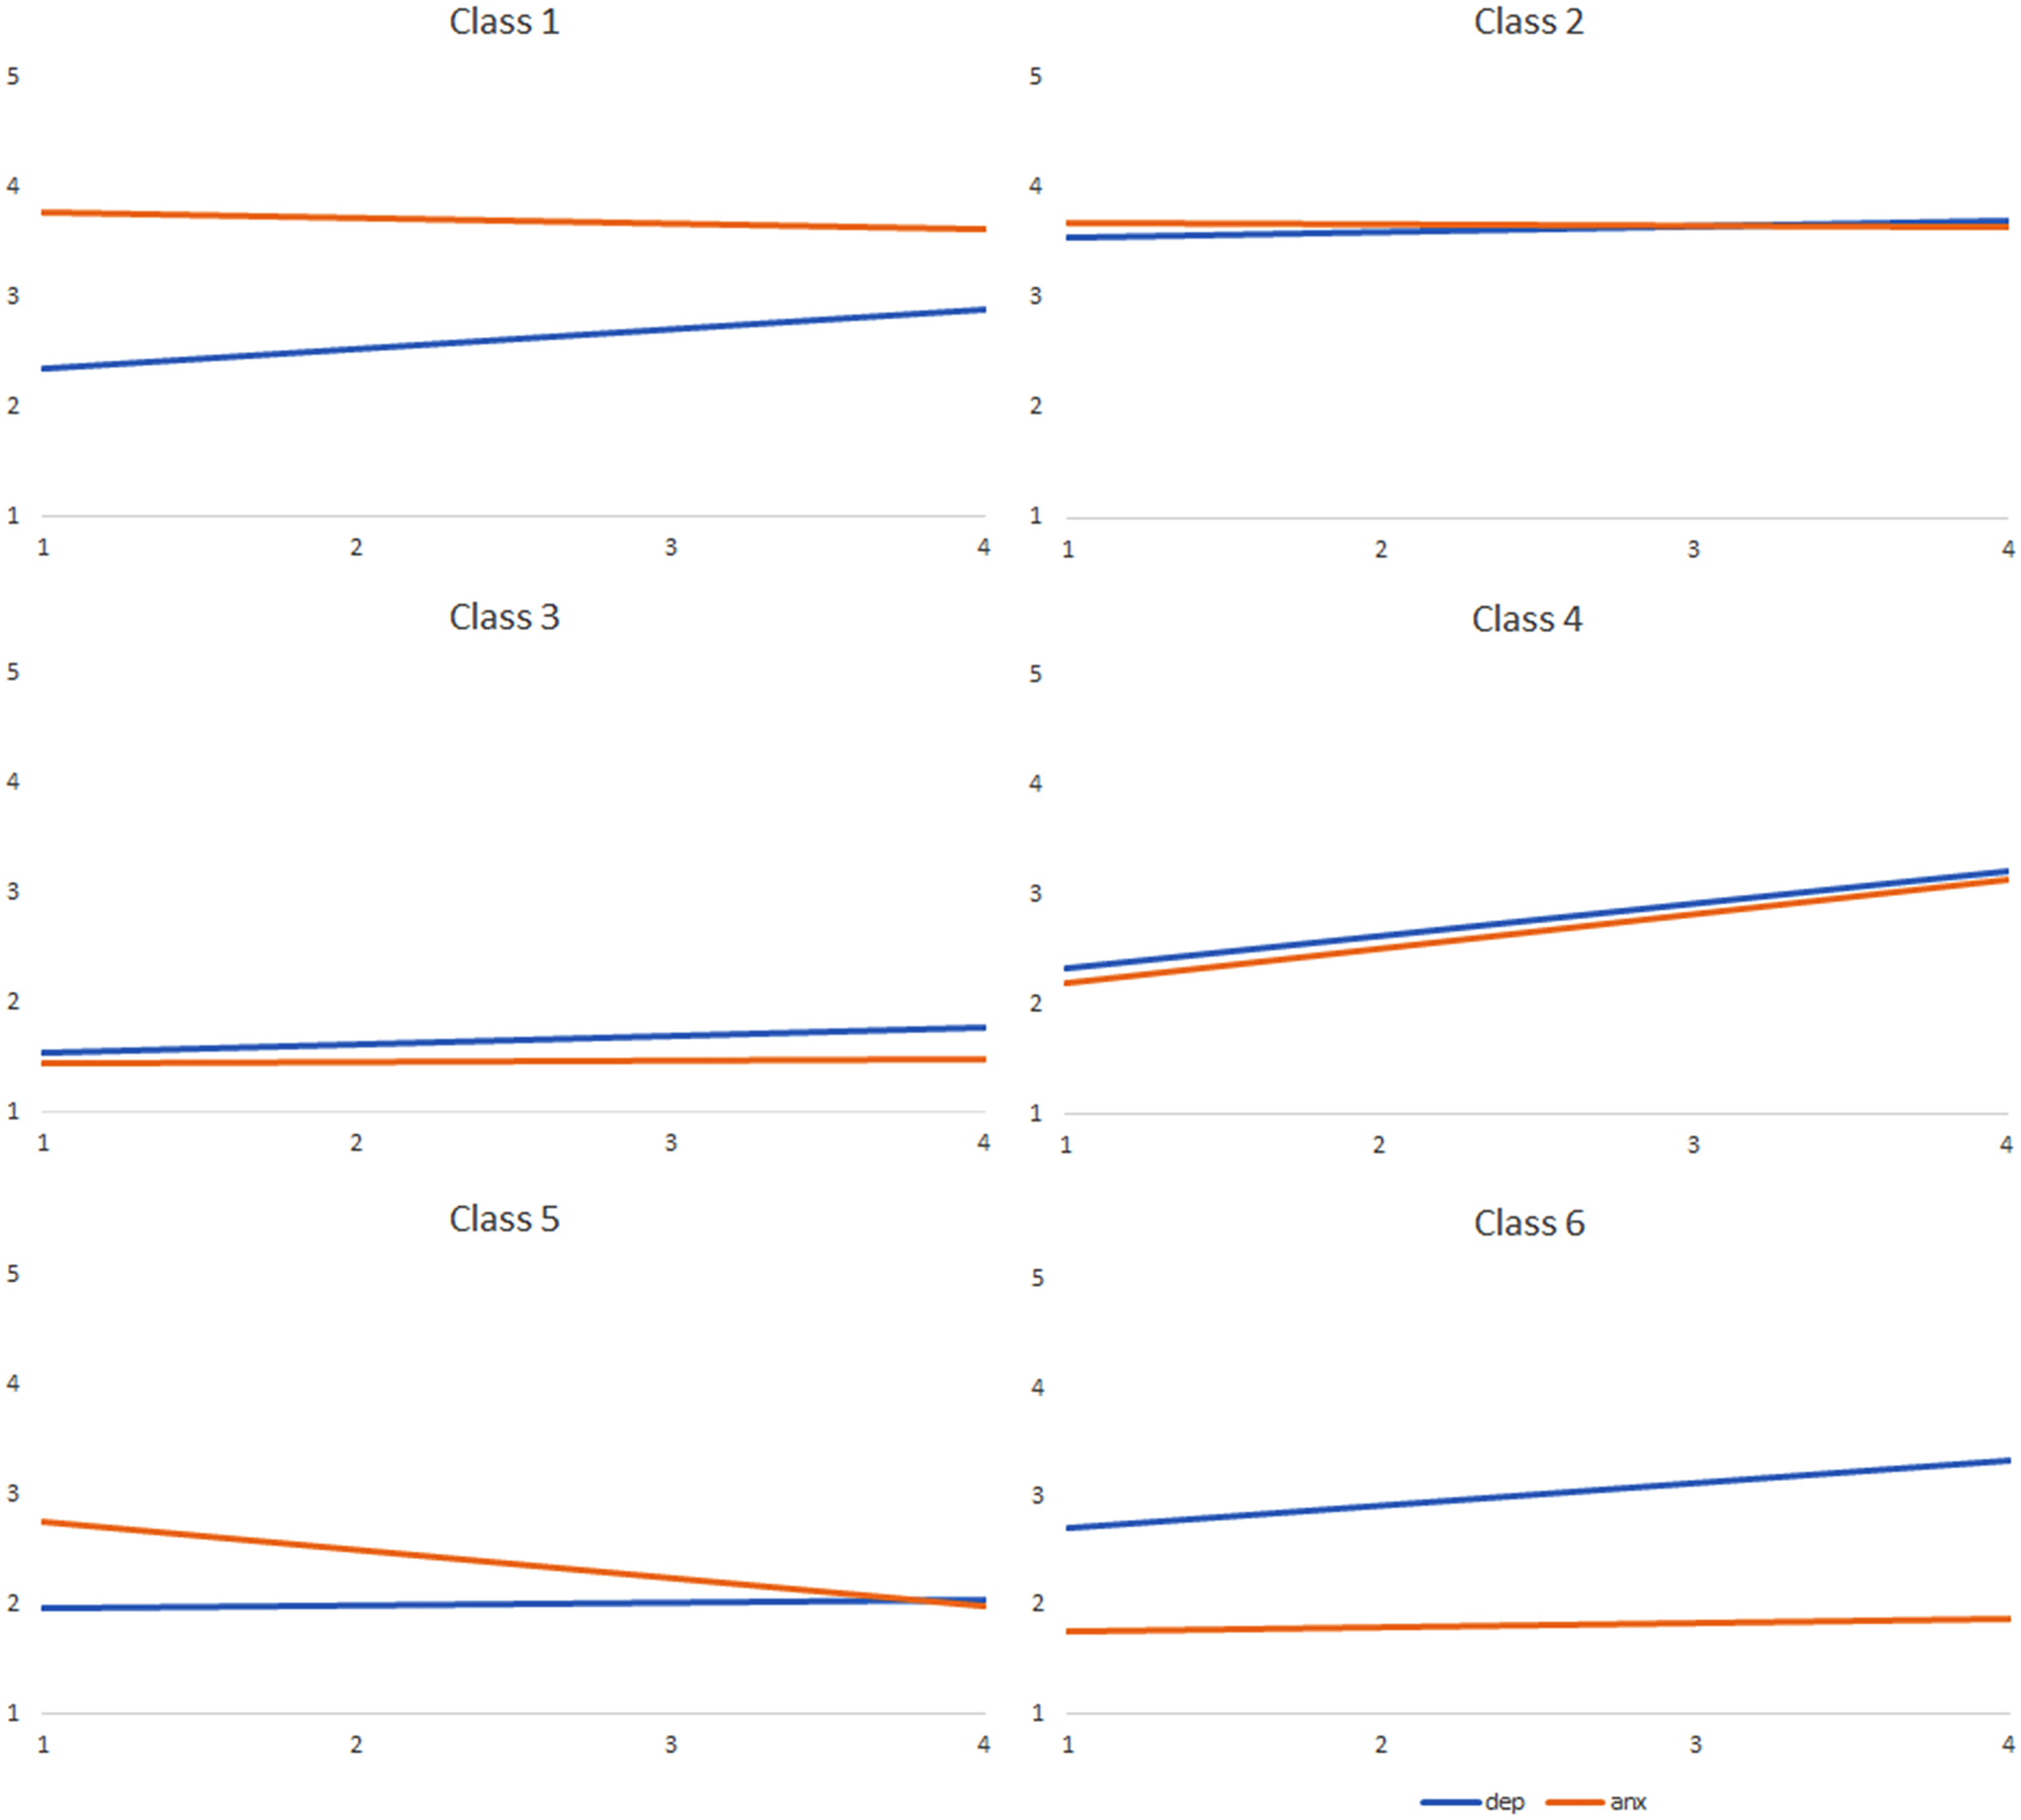
Table 3 summarizes the growth factors (intercept and slope) of anxiety and depressive symptoms in each of the six classes from the LCGA. Note that we used the terms “stable,” “increasing,” and “decreasing” to denote the trajectory of change over the transition to university that students experienced. The terms "high", "moderate" and "low" denote the intercept or students reported symptoms when starting university. The trajectory of change for depressive and anxiety symptoms were not homogeneous. That is, although most students experienced low depression that is increasing and low stable anxiety (59%), the remaining students experienced different combinations of depressive and anxiety symptoms that each increased, decreased, or remained stable (see Table 3). Figure 2 provides a visual representation of the different class models.
A summary table of the latent class growth trajectories descriptive statistics (intercept and slope) for anxiety and depressive symptoms
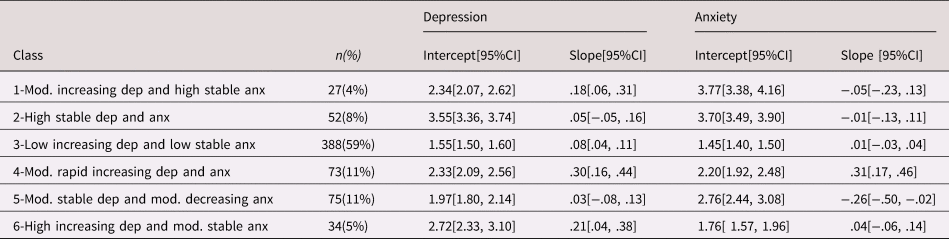
Note. Dep = depressive symptoms; anx = anxiety symptoms. The intercept value corresponds to the observed mean at time 1 (anxiety and depression scales both ranged from 1 to 5).
The graphed trajectory of change for each latent class for anxiety and depressive symptoms. The y-axis denotes symptom severity, and the x-axis denotes the time point. The blue line represents depressive symptoms, and the orange line represents anxiety symptoms.
Perfectionism as a predictor of class membership
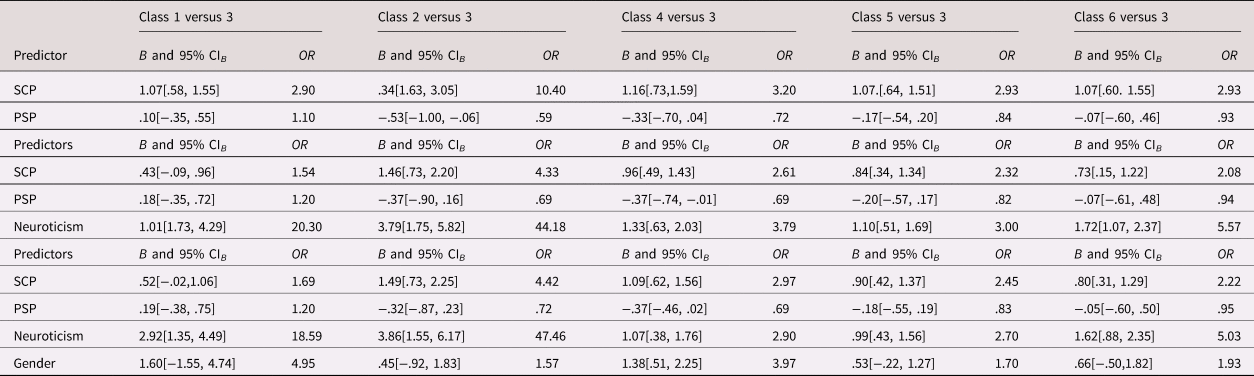
To examine our second research question, self-critical perfectionism and personal standards perfectionism were examined as simultaneous predictors of latent class membership. We then repeated the analysis after also including neuroticism as a predictor. In the multinomial regression analyses, the latent class three (low depression that increases slowly and low stable anxiety) was the reference category. Results with and without including neuroticism and participant gender are summarized in Table 4.
Results of the multinomial regression analyses examining perfectionism variables as predictors of class membership with and without neuroticism in the analyses

Note. Regression coefficients are unstandardized. SCP = self-critical perfectionism, PSP = personal standards perfectionism.
As expected, participants with higher (relative to lower) self-critical perfectionism were more likely to be in the high stable depressive and anxiety symptoms group (Class 2), moderate increasing depressive symptoms and high stable anxiety symptoms group (Class 1), moderate and rapid increasing depressive and anxiety symptoms group (Class 4), moderate stable depressive symptoms and moderate decreasing anxiety symptoms group (Class 5) and the high increasing depressive symptoms and moderate stable anxiety symptoms group (Class 6) as compared to the low increasing depressive and low stable anxiety symptoms group (Class 3). This means that individuals higher in self-critical perfectionism were more likely to experience moderate to severe mental health problems that either were stable or increasing during their first year in university. The magnitude of the effects ranged from moderate to large (see Table 4).
In addition, when neuroticism was included in the analysis, the magnitude of the effects for self-critical perfectionism was attenuated (they became small-to-moderate) but remained statistically significant except for membership in the moderate increasing depressive symptoms and high stable anxiety symptoms (Class 1) versus the low stable anxiety and low increasing depressive symptoms group (Class 3; see Table 4). These results remained virtually the same after also including participants’ gender as a covariate in the analysis. In sum, participants with higher (relative to lower) self-critical perfectionism were more likely to be in Classes 2, 4, 5, and 6 compared to the low stable anxiety and low increasing depression group (Class 3). Again, individuals higher in self-critical perfectionism were more likely to be in moderate or high stable and increasing mental health trajectories during their first year in university.
Discussion
The first aim of the current research was to examine how anxiety and depressive symptoms co-develop during the transition to university. Results indicated heterogeneity in the trajectories of depression and anxiety symptoms that students experienced during the transition to university. Close to 60% of students in the current research experienced trajectories of low stable anxiety and low increasing depressive symptoms over the school year. This means that the other 40% experienced depression and anxiety symptoms prior to entering university, during the transition to university, or both. These findings suggest that there is substantial variation between students in terms of how they experience depression and anxiety symptoms, and that examining trajectories of mental health can help further our understanding of how mental health problems develop during the transitional year to university.
Trajectories of depressive and anxiety symptoms
Previous research has found evidence that mental health symptoms become more severe over the school year, but few studies have examined how mental health differs across individuals over time (McPhie & Rawana, Reference McPhie and Rawana2015; Reddy et al., Reference Reddy, Rhodes and Mulhall2003; Stice & Bearman, Reference Stice and Bearman2001). Many participants in the current research experienced increasing depressive and anxiety symptoms over the school year. In addition, the current research adds to the literature by showing that the development of mental health symptoms is not homogenous across individuals over time (i.e., individuals experience mental health symptoms differently over time). There were six combinations of depressive and anxiety symptom trajectories that students experienced over the academic year. These different trajectories highlight the heterogeneous nature of symptom development in emerging adulthood. For example, there were students that belonged to a high stable symptom trajectory class, others that belonged to the moderate and increasing symptom class, but also students who experienced higher anxiety and moderate depression, or higher depression and more moderate anxiety. In addition, one latent class included students who began university with moderate anxiety that decreased coupled with low to moderate depressive symptoms. To our knowledge, only one study has previously examined anxiety and depressive symptom trajectories simultaneously. Olino et al. (Reference Olino, Klein, Lewinsohn, Rohde and Seeley2010) found multiple anxiety and depressive symptom trajectories to exist, as well as different combinations of these symptoms. Similarly, we found that not all participants in the current research experienced mental health problems in a similar manner; by averaging across individuals, nuance is lost in understanding how they experience symptoms over time. The current research found that different symptom trajectories exist, and that these symptoms are highly comorbid. Thus, the current research provides additional rationale for exploring differences in how individuals’ mental health symptoms may change over time as well as factors that help explain these differences.
Although anxiety and depression often co-occur and predict one another over time (for a review and meta-analysis, see Jacobson & Newman, Reference Jacobson and Newman2017), little is known about how they travel together over time. The current research suggests that the longitudinal relation between anxiety and depression is not one-to-one whereby increasing anxiety is coupled with increasing depression. For example, in the current research, one participant who experienced moderate increasing depressive symptoms, might experience moderate stable anxiety symptoms, and conversely another participant experiencing moderate increasing depressive symptoms might report moderate increasing anxiety symptoms. Thus far, research has often examined anxiety and depression either separately (Bongers et al., Reference Bongers, Koot, Van der Ende and Verhulst2003; Lutz et al., Reference Lutz, Leon, Martinovich, Lyons and Stiles2007; Wood et al., Reference Wood, Van Der Mei, Ponsonby, Pittas, Quinn, Dwyer and Taylor2012) or as predictors of one another (Jacobson & Newman, Reference Jacobson and Newman2017). The current research adds to the literature by examining intraindividual change over time in anxiety and depression and how they coincide as well as interindividual factors that may explain different and unique combinations of change in depression and anxiety over time.
Understanding the prevalence and course of mental health problems is a first step to determining how best to support young adults transitioning into university. Baseline mental health symptoms were one factor which could be used to predict the course of mental health symptoms during the school year, and universities may benefit by offering targeted interventions to those at greatest risk of experiencing worsening mental health. In addition, one of the trajectories identified in this research was a group of students who had moderate anxiety symptoms at the start of the year that decreased over time. It may be that those individuals possess some resilience factors that could be further studied and used to promote wellness in early intervention programs. Early intervention programs have been shown to be effective at reducing the likelihood of more severe mental health outcomes (Kitchener & Jorm, Reference Kitchener and Jorm2008). The current research provided a more comprehensive analysis of trends in mental health symptom severity during the transition to university which is hopefully a primary step for better understanding how to help those suffering during this challenging transitional period.
For depressive symptoms, the symptom trajectories identified suggest that during the transition to university, depressive symptoms either increased or remained stable if already elevated. Reports of depressive symptoms among university students are higher than in the adult population and higher than that of their peers who do not attend university, indicating that the university environment might be especially distressing (Chen et al., Reference Chen, Wang, Qiu, Yang, Qiao, Yang and Liang2013; Wells, Klerman, & Deykin, Reference Wells, Klerman and Deykin1987). The environmental risk factors, lack of social support, or academic problems may interact with several biological (e.g., genetic) or psychological factors (e.g., personality) to proliferate the development of mental health problems in students.
Role of self-critical perfectionism
The second aim of the current research was to examine whether individual differences in self-critical perfectionism help explain differences in trajectories of depression and anxiety. Students higher in self-critical perfectionism reported having more severe anxiety and depression symptoms prior to entering university that increased or remained stable over time compared to students lower in self-critical perfectionism. These results suggest that self-critical perfectionism is a transdiagnostic risk factor for various mental health outcomes, including depression and anxiety (Egan et al., Reference Egan, Wade and Shafran2011). There is a plethora of research which has found self-critical perfectionism to be associated with stress, anxiety, depression, and other mental health problems (e.g., Levine et al., Reference Levine, Milyavskaya and Zuroff2020; Smith et al., Reference Smith, Vidovic, Sherry, Stewart and Saklofske2018; Tabri et al., Reference Tabri, Werner, Milyavskaya and Wohl2018). In addition, our study suggests that perfectionism is a risk factor for high stable and moderate increasing anxiety and depression symptom trajectories, but also, for less severe symptom trajectories (i.e., moderate stable or low increasing symptom groups). More research is needed to better understand how perfectionism influences the development of mental health problems, and what other factors interact with perfectionism to predict more severe symptom trajectories. Within the context of one's transitional year to university environmental factors (i.e., one's living situation, academic experience) or other psychosocial factors (i.e., new friendship, familial support) may interact with how self-critically perfectionistic a student is to predict their vulnerability to psychological distress in this transition. The findings complement prior research by implicating self-critical perfectionism as a transdiagnostic risk factor, but also provides further nuance into how perfectionism can contribute to both moderate and severe psychological distress.
Personal standards perfectionism was included in the analyses as a covariate because it has been found to be moderately correlated with self-critical perfectionism and mental health problems (Stoeber & Gaudreau, Reference Stoeber and Gaudreau2017). We observed that personal standards perfectionism did not generally predict class assignment, except that individuals higher (relative to lower) in personal standards perfectionism were less likely to belong to the high stable anxiety and depressive symptom classes as compared to the low symptom classes. Although these results suggest that personal standards perfectionism may not be harmful, we want to underscore that personal standards perfectionism is likely not adaptive or neutral, as it has been implicated in the development of psychopathology, most notably eating disorders (Bardone-Cone et al., Reference Bardone-Cone, Wonderlich, Frost, Bulik, Mitchell, Uppala and Simonich2007; Sassaroli et al., Reference Sassaroli, Lauro, Ruggiero, Mauri, Vinai and Frost2008; for a recent meta-analysis, see Dahlenburg, Gleaves, & Hutchinson, Reference Dahlenburg, Gleaves and Hutchinson2019). Generally, personal standards perfectionism may show less robust associations with psychopathology, which become null when examining it in addition to self-critical perfectionism. A similar relation was observed in the current research wherein personal standards perfectionism was positively correlated with anxiety and depressive symptoms over time (see Table 1). That said, further research is needed to better understand the nuanced relation between personal standards perfectionism, achievement, and psychological distress.
This research also examined the influence of perfectionism on mental health when controlling for neuroticism. Students higher in neuroticism were more likely to experience high and moderate stable and increasing anxiety and depressive symptoms over their first year in university, and these associations had large effect sizes. The association between self-critical perfectionism and mental health problems was still statistically significant, but the effect size was attenuated. This suggests that self-critical perfectionism was a unique predictor of mental health problems when considering neuroticism, but that neuroticism explains some of the variance in the relation between self-critical perfectionism and depressive and anxiety symptoms. In the perfectionism literature, neuroticism is not always ruled out as a potential confounding factor, and the current research suggests that it is critical to consider perfectionism within the context of this highly comorbid personality trait. Self-critical perfectionism and neuroticism have been found to share common genetic etiology, as well as similar environmental factors that can contribute to the development of these traits (Burcaş & Creţu, Reference Burcaş and Creţu2021). However, these traits can have unique consequences, and the current research provides further support for this, and furthers our understanding of how these traits uniquely contribute to mental health problems.
In addition, the results remain virtually unchanged after statistically controlling for participants’ self-identified gender in the analyses. Women often report more symptoms of anxiety and depression (Salk et al., Reference Salk, Hyde and Abramson2017) and the influence of self-critical perfectionism on mental health still held when accounting for participants’ gender. These results indicate that the influence of self-critical perfectionism on mental health is above and beyond that of gender differences in mental health. As such, it is possible that self-critical perfectionism is a vulnerability factor for both men and women. However, there were a limited number of men in the current research and so future research should replicate the results in a sample that includes about an equal number of men and women participants.
Mental health problems among university students have become increasingly prevalent over the past few decades (ACHA, 2018). The current research suggests that self-critical perfectionism is a risk factor for experiencing more severe mental health problems during the transition to university. Perhaps, by focusing on interventions to reduce self-critical perfectionism in emerging adulthood, some of the associated mental health problems may also be reduced. Both personal standards and self-critical perfectionism are moderately correlated, but consistently related to unique outcomes (Stoeber, Reference Stoeber2018; Stoeber & Otto, Reference Stoeber and Otto2006). Moving forward it is important to consider how the facets of this trait differ to determine how to effectively intervene on self-critical perfectionism. For instance, individuals higher in self-critical perfectionism strive for exceedingly high standards and engage in multiple cognitive biases such as concerns over mistakes, doubts about actions, self-criticism, fear of failure, as well as ruminative and rigid thought patterns (Dunkley et al., Reference Dunkley, Blankstein, Halsall, Williams and Winkworth2000; Egan, Piek, Dyck, & Rees, Reference Egan, Piek, Dyck and Rees2007; Flett, Madorsky, Hewitt, & Heisel, Reference Flett, Madorsky, Hewitt and Heisel2002; Levine & Milyavskaya, Reference Levine and Milyavskaya2018; Levine, Werner, Capaldi, & Milyavskaya, Reference Levine, Werner, Capaldi and Milyavskaya2017). It is possible that these cognitive biases are primarily responsible for the negative influence of self-critical perfectionism on mental health and so addressing them may be key to prevent or alleviate the negative consequences of self-critical perfectionism.
Limitations and future directions
There are several limitations to consider in the current research. One limitation is that there were too few male participants to meaningfully examine gender differences. However, results were virtually the same when analyses were run while statistically controlling for gender (see OSF). Men and women often experience mental health differently and future research examining trajectories of change of male and female students separately may help to further understand gender differences in symptom development during emerging adulthood (Kessler, Reference Kessler2003). Another limitation of the current research is whether the results generalize beyond students transitioning to university. The developmental period examined in this research is specific, but this is also a strength because the transition to university is a particularly vulnerable time for mental health problems (Beiter et al., Reference Beiter, Nash, McCrady, Rhoades, Linscomb, Clarahan and Sammut2015; Kitzrow, Reference Kitzrow2003). Research with this population is important for helping students better acclimatize to the transition into emerging adulthood. Future research can follow incoming students over longer periods, to see whether these patterns persist beyond the first year of university, as well as with participants who are not attending university to examine whether our findings are specific to those who go to university or applicable to emerging adulthood more broadly.
An additional limitation of the current longitudinal research was attrition. To address missing data in our analyses, we examined whether variables in the substantive model were associated with missingness and we found no systematic association (see OSF for supplementary analyses). We also used full information maximum likelihood to incorporate participants with missing data into the analyses, which has been shown to increase statistical power and reduce bias in the estimates (Enders, Reference Enders2010). As such, we are confident that the results are both valid and reliable. In the future, greater incentives could be introduced to improve study retention for longitudinal research.
Further, a possible limitation concerns the measurement of perfectionism. There are numerous perfectionism measures, and this research used three different measures to capture self-critical and personal standards perfectionism. These measures are commonly used in combination in similar research (Dunkley et al., Reference Dunkley, Blankstein, Zuroff, Lecce and Hui2006; Stoeber, Reference Stoeber2018). Using a measure with every perfectionism scale would be more comprehensive. In the current research we did not include the self-oriented perfectionism subscale from the Hewitt multidimensional perfectionism scale (HMPS) (Hewitt & Flett, Reference Hewitt and Flett1991). However, the high standards subscale of the Frost-MPS loads highly onto the self-oriented subscale of the HMPS, which suggests that measuring this trait with either subscale captures our conceptualization of personal standards perfectionism (Bieling et al., Reference Bieling, Israeli and Antony2004). In addition, personal standards perfectionism was only used as a covariate to determine the effects of self-critical perfectionism more clearly on mental health. Furthermore, Jung and Wickrama (Reference Jung and Wickrama2008) recommended that there should be no less than 1% of the total sample size in a given class for chosen LCA solution. None of the six classes in the final chosen solution had less than 1% of the total sample size (see Table 3), but we want to mention that two of the size classes had relatively smaller sample sizes and so we want to caution readers with interpreting results for these two classes. That said, it would be important for future research to try and replicate the results of the LCA.
Conclusion
The current research shows how depressive and anxiety symptoms co-develop and co-occur during the transition to university, while also providing an explanation for who may be at risk of experiencing poor mental health during this developmental period. In the transitional year to university, we found that most students experience low depression that increases and low anxiety that remain low throughout the year. However, a substantial number of students experienced different trajectories of anxiety and depressive symptoms, with students high (vs. low) in self-critical perfectionism being more likely to experience greater anxiety and depressive symptoms during the transition to university. The results suggest that the relation between anxiety and depression may not be always one-to-one and that individual differences in self-critical perfectionism may help explain their co-occurrence.
Funding Statement
This project was supported by a Young Researchers Grant awarded to M. Milyavskaya from the Ontario Mental Health Foundation and by Social Sciences and Humanities Research Council of Canada/Canada Graduate Scholarships–Master's funding to S. L. Levine.
Conflicts of Interest
None.