The contamination of water resources by toxic chemicals, especially heavy metals, is a serious problem. The main sources of these non-degradable metal ions are industrial activities such as mining, ore processing and metal plating (Sanchez et al., Reference Sanchez, Ayuso and De Blas1999; Entezari & Soltani, Reference Entezari and Soltani2008). Among heavy metals, copper has special industrial significance due to its extensive use (Aber et al., Reference Aber, Ayoubi-Feiz and Salari2013). Therefore, it is important to remove copper ions from wastewaters before they are discharged into water resources. Numerous methods have been studied to remove copper ions from polluted waters. Sorption is regarded as a promising technology due to its advantages of easy operation, low cost and convenience (Stojakovic et al., Reference Stojakovic, Milenkovic, Daneu and Rajic2011). In recent years, many studies have been carried out on the ability to adsorb Cu2+ ions of natural sorbents such as palygorskite and vermiculite (Bourliva et al., Reference Bourliva, Sikalidis, Papadopoulou, Betsiou, Michailidis, Sikalidis and Filippidis2018), montmorillonite and palygorskite (Lin et al., Reference Lin, Zhou and Yin2017), biomass ash (Xu et al., Reference Xu, Cui, Zheng, Liang, Xing, Yao, Chen and Zhou2018), volcanic tuff (Radaideh et al., Reference Radaideh, Barjenbruch, Patzer and Shatnawi2017), flax fibres (Abbar et al., Reference Abbar, Alem, Marcotte, Pantet, Ahfir, Bizet and Duriatti2017), natural zeolite (Katsimicha et al., Reference Katsimicha, Pentari, Pantelaki and Komnitsas2017), natural sepiolite (Dönmez et al., Reference Dönmez, Camcı, Akbal and Yağan2015) and kaolin and zeolitic tuff (Al-Makhadmeh & Batiha, Reference Al-Makhadmeh and Batiha2016). Improving the sorption rates and capacities of natural sorbents has become one of the main topics of current research. It has been established that the reduction of the particle size of natural sorbents to nano-dimensions leads to a greater number of available active sites, shorter diffusion path lengths and lower mass transfer resistance between the solution phase and the sorbent surface (Pourtaheri & Nezamzadeh-Ejhieh, Reference Pourtaheri and Nezamzadeh-Ejhieh2015). Furthermore, ultrasonic waves may improve the rate and efficiency of the sorption process. Ultrasonic waves lead to an alternating adiabatic compression and rarefaction cycle of the liquid media that decreases the thickness of the liquid film attached to the solid phase and mass transfer resistances (Entezari & Soltani, Reference Entezari and Soltani2008; Pang & Abdullah, Reference Pang and Abdullah2013).
The classical ‘one-factor-at-a-time’ method has been used commonly to investigate and optimize the effects of various significant independent variables on the process. This method involves changing one variable at a time while making all other variables constant to study the effect of the variable on the response (Wu et al., Reference Wu, Zhang, Oturan, Wang, Chen and Oturan2012). The one-factor-at-a-time method is time consuming and fails to consider any possible interactions between the independent variables in a multivariable system (Adamczyk et al., Reference Adamczyk, Horny, Tricoteaux, Jouan and Zadam2008). These problems might be overcome by using experimental design methodologies. Among them, response surface methodology (RSM) is the most economical and convenient method utilized in many fields. The main idea behind RSM is using statistical and mathematical techniques to develop and optimize processes (Song et al., Reference Song, Branford-White, Nie and Zhu2011).
The main objectives of this work were to reduce the size of natural clinoptilolite particles to the nanoscale and to use them in ultrasonic-assisted sorption of Cu2+ ions from contaminated solution, as well as to investigate the effect of clinoptilolite nanostructure (CNS) dosage, pH, sonication time and temperature as independent variables on ultrasonic-assisted sorption and to optimize the process.
Materials and methods
Materials
Natural clinoptilolite with an average grain size of 125 μm were obtained from Afarazand Co., Iran. Copper nitrate thrihydrate (Cu(NO3)2·3H2O), nitric acid (HNO3), sodium nitrate (NaNO3) and sodium hydroxide (NaOH) were obtained from Merck. Distilled water was used throughout the study.
Preparation of CNS
The natural clinoptilolite was treated by mechanical ball milling to prepare the appropriate nanostructure. Accordingly, the natural clinoptilolite powder with a size distribution of <125 μm was milled in a high-energy planetary ball mill (MLP, Sanat Eeram Mehr Alborz, Iran) at a rotational speed of 600 rpm. The ratio of the bullet weight to the clinoptilolite powder weight was 4 and the grinding time was 6 h. The CNS obtained was washed with distilled water and dried in a vacuum oven at 80°C.
Characterization techniques
The morphology and the size of the sample particles were analysed using a ZEISS EVO-18 scanning electron microscope (SEM). The IR spectra of the particles were collected with a Perkin Elmer Fourier-transform infrared spectrometer using the KBr disc method. The specific surface areas and total pore volumes of the natural clinoptilolite and CNS samples were estimated using the Brunauer–Emmett–Teller (BET) method with a Belsorp-Mini surface analyser (Japan) by N2 adsorption/desorption at 77 K. The sample phases were identified by X-ray diffraction (XRD; Philips X'Pert).
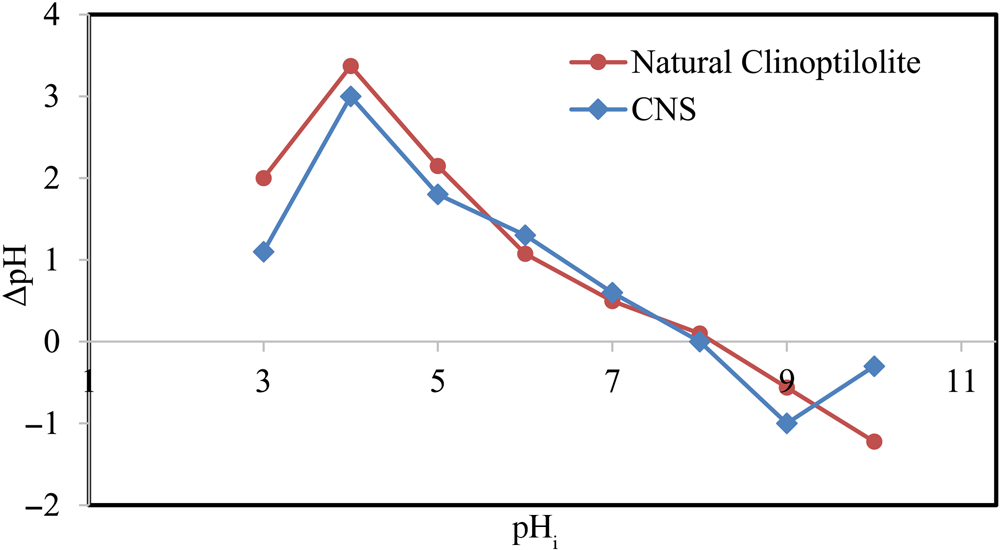
The pH at the point of zero charge (pHpzc) of the natural clinoptilolite and the CNS samples was determined according to the salt addition method. Accordingly, a series of 40 mL 0.01 M NaNO3 solutions were prepared and transferred to Erlenmeyer flasks. The pH values of the solutions were adjusted from 1 to 10 by adding dilute HNO3 or NaOH solutions. Approximately 0.6 g of sample was added to each solution, and the suspensions obtained were stirred for 72 h. The final pH of each solution was measured. The differences between the initial and final pH values (∆pH) were plotted against the related initial pH values (pHi). The pHpzc was the pH at which ∆pH was equal to zero.
Batch ultrasonic-assisted sorption experiments
Ultrasonic-assisted sorption experiments were conducted in a 100 mL glass reactor. Ultrasonication of the glass reactor was carried out in an ultrasonic bath (Parsonic 7500s, Pars Nahand Engineering Co., Iran) at a frequency of 28 kHz and a power of 100 W. A total of 50 mL of 10 mg L−1 Cu2+ solutions was used during the ultrasonic-assisted sorption processes. A predetermined amount of the CNS was added to the reactor and mixed with the Cu2+ solution. The pH of the suspension was adjusted from 2 to 6 by addition of NaOH and HNO3. The experiments were performed at various temperatures. After conducting the experiments and before carrying out the analyses, the samples were filtered using a 0.22 μm membrane to separate the CNS. A Varian SpecterAA-20 Atomic Absorption Spectrometer (Palo Alto, CA, USA) equipped with a Cu hollow cathode lamp was used for the determination of Cu2+ concentration.
Experimental design
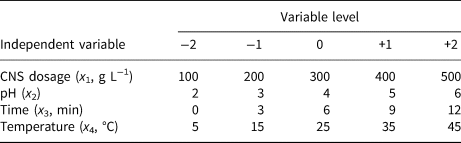
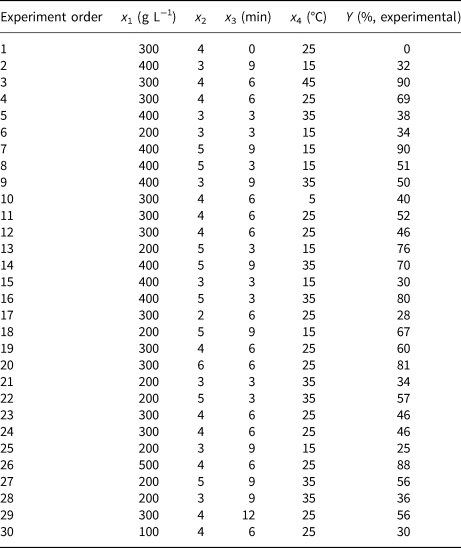
For the experimental setup design, a central composite design (CCD) matrix of the RSM was applied to investigate the effect of CNS dosage (x 1, g L−1), pH (x 2), sonication time (x 3, min) and sonication temperature (x 4, °C), as independent variables, on the removal efficiency of Cu2+ (10 mg L−1), as the dependent variable, using Design Expert 8.0 software. The four independent variables and their levels in coded and actual values are listed in Table 1. Furthermore, the total number of 31 experimental runs with six centre points are shown in Table 2. In developing the regression equation, the relationship between the coded values and the actual values is described by equation 1:
 $$X_i = \displaystyle{{\lpar {x_i-x_0} \rpar } \over {\Delta x}}$$
where X i is a coded value of the independent variable, x i is the actual value of the independent variable, x 0 is the actual value of the independent variable at the centre point level and Δx is the step change value between the centre point level and high level (+1).
Actual and coded levels of the variables used for the ultrasonic-assisted sorption process by CCD.

Experimental design and the results of the CCD.

The Cu2+ removal efficiency data from CCD-proposed experimental runs were analysed by multiple regressions to fit the following second-order polynomial model (equation 2):
 $$Y = {\rm \beta} _0 + \sum\limits_{i = 1}^k {{\rm \beta} _iX_i} + \sum\limits_{i = 1}^k {{\rm \beta} _{ii}X_i^2 + \sum\limits_{i = 1}^{k-1} {\sum\limits_{\,j = 2}^k {{\rm \beta} _{ij}X_i}}} X_j + {\rm \varepsilon} $$
where Y is the Cu2+ removal efficiency as the dependent variable; β0, βi, βii and βij are the constant, linear, squared and interaction coefficients of the model, respectively; X i, X 2i and X iXj are the linear, quadratic and interaction terms of model, respectively; i/j must be considered in the interaction term (X iXj); k is the number of factors studied and ε is the error. Statistical analysis was used to evaluate the fit quality of the experimental results to the polynomial model.
Sorption isotherm
The sorption isotherm was obtained at room temperature and a pH of 6. A total of 30 mg of sorbent was placed in a conical flask containing 50 mL of Cu2+ aqueous solutions of initial concentrations varying from 50 to 500 mg L−1. After sorption for 2 days, the equilibrium concentrations of Cu2+ in the solutions were determined. The concentrations sorbed were calculated according to equation 3 (Sheydaei & Aber, Reference Sheydaei and Aber2013):
 $$q_{\rm e} = \lpar {C_0-C_{\rm e}} \rpar V/M$$
where q e (mg g−1) is the amount of Cu2+ sorbed on the mass of the sorbent, C 0 (mg L−1) is the initial Cu2+ solution concentration and C e (mg L−1) is the equilibrium Cu2+ solution concentration. M and V are the weight of the sorbent (g) and volume of the solution (L), respectively.
In addition, two isotherm equations (Freundlich and Langmuir) were adopted in this work to study the sorption capacities of the natural clinoptilolite and CNS. The Freundlich isotherm is represented by equation 4 (Wang et al., Reference Wang, Ma, He, Pei and He2015):
 $${\rm log}q_{\rm e} = {\rm log}K_{\rm f} + \lpar {1/n} \rpar {\rm log}C_{\rm e}$$
where 1/n is the slope showing the variation of the sorption with concentration and K f is the intercept showing the sorption capacity of the sorbent.
The Langmuir equation is expressed by equation 5 (Mustafai et al., Reference Mustafai, Balouch, Abdullah, Jalbani, Bhanger, Jagirani, Kumar and Tunio2018):
 $${{C_{\rm e}} \big/ {q_{\rm e}}} = {{C_{\rm e}} \big/ {Q_{\rm max}}} + {1 \big/ {bQ_{\rm max}}}$$
where Q max (mg g−1) and b (L mg−1) are constants related to the sorption capacity and energy of sorption, respectively.
Results and discussion
Characterization of the CNS
The SEM images of the natural clinoptilolite and CNS samples are shown in Fig. 1a,b. Comparison of the SEM images of the clinoptilolite particles before and after ball milling showed the development of nanometre-sized particles due to the mechanical process. Manual Microstructure The Distance Measurement software (version 2.0, Nahamin Pardazan Asia Co., Iran) was used to determine the size distribution of the clinoptilolite treated by ball milling. The mode of the CNS particle size was 80–90 nm (Fig. 1c), suggesting the nanostructured nature of the clinoptilolite. Figure 1d shows the energy-dispersive X-ray spectra of the nanostructure produced. The elemental composition (wt.%) was O (46.37), Na (2.65), Al (6.64), Si (39.30) and K (5.05).
SEM images of (a) the natural clinoptilolite particles and (b) CNS, (c) size distribution and (d) energy-dispersive X-ray spectra of the CNS produced.

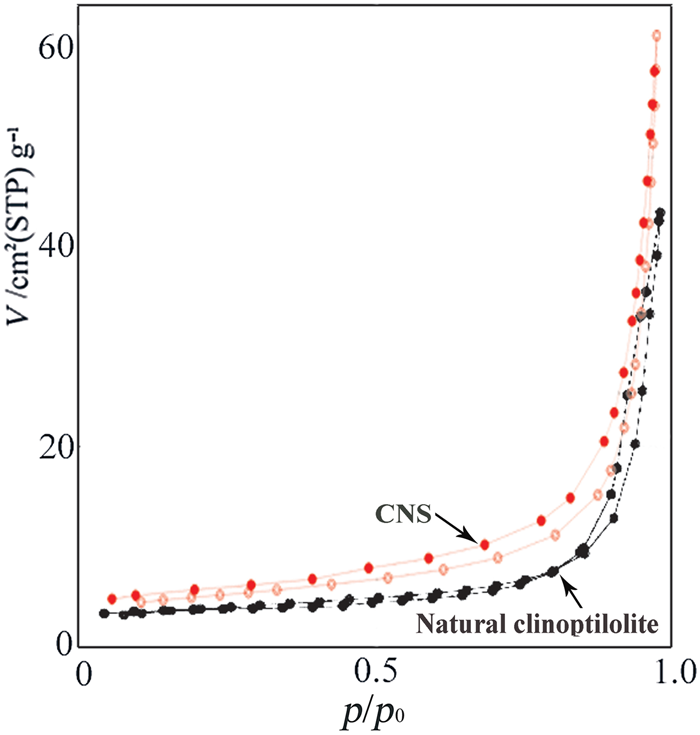
The N2 adsorption/desorption isotherm was used to characterize the pore structure of the natural clinoptilolite and CNS. Based on the International Union of Pure and Applied Chemistry (IUPAC) classification, the adsorption/desorption isotherm for both samples is of type IV, along with a hysteresis loop at high partial pressure associated with capillary condensation, which indicates the existence of mesoporous structures in the natural clinoptilolite and CNS (Fig. 2).
N2 adsorption/desorption isotherms of the natural clinoptilolite and CNS samples. STP = standard temperature and pressure.

The total pore volumes of the natural clinoptilolite and the CNS were 0.06 and 0.1 cm3 g−1, respectively. According to the Barrett–Joyner–Halenda (BJH) method, the mesoporous surface area and pore volume were 9.00 cm2 g−1 and 0.06 cm3 g−1, respectively, for the natural clinoptilolite and 17.12 m2 g−1 and 0.11 cm3 g−1, respectively, for the CNS. A comparison of the pore volume of the CNS with that of natural clinoptilolite indicates that the porosity of the natural silicate increased due to the development of the nanostructure. The pores developed are mainly in the mesoporous range (2–50 nm).
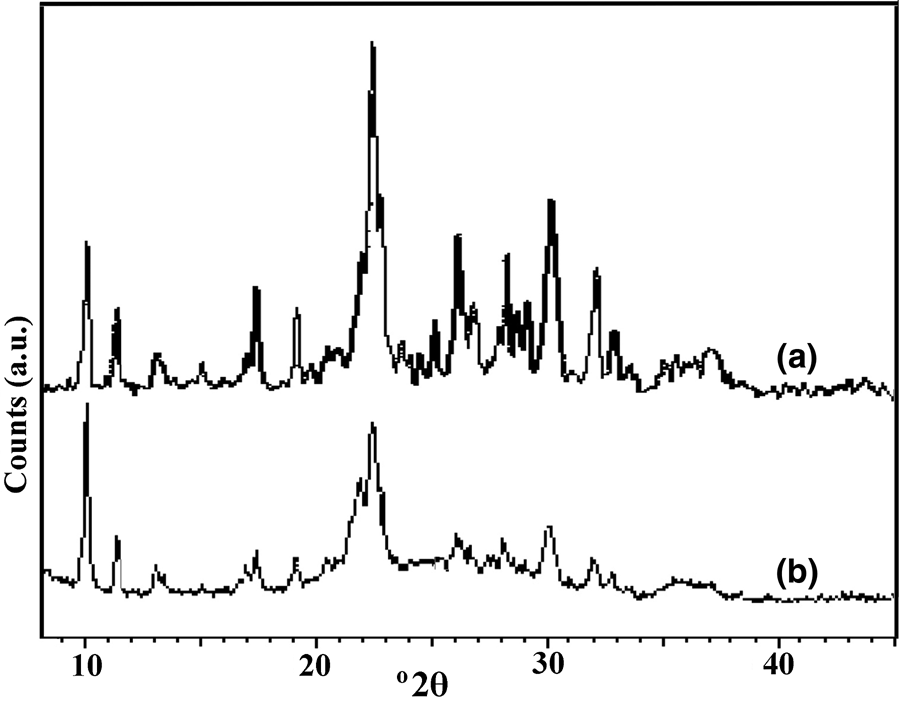
The XRD traces (Fig. 3) of the natural clinoptilolite and CNS samples indicate the existence of diffraction peaks at 10, 11.4, 17.4, 23, 26, 28.2, 30.2, and 32°2θ, typical of clinoptilolite. By comparing the XRD traces of both samples, no significant shifts were seen in the peak positions of the natural clinoptilolite and CNS samples. However, the XRD trace of the CNS sample displays a hump in the 20–30°2θ range, suggesting amorphization of the clinoptinolite during ball milling. Moreover, the intensity of CNS XRD peaks was lower than that of natural clinoptilolite peaks, which may be attributed to the decrease in the crystal order of the zeolite. Similar results were reported for the preparation of martite nanocatalyst from natural martite by high-energy planetary ball milling (Dindarsafa et al., Reference Dindarsafa, Khataee, Kaymak, Vahid, Karimi and Rahmani2017).
XRD traces of the (a) natural clinoptilolite and (b) CNS samples.

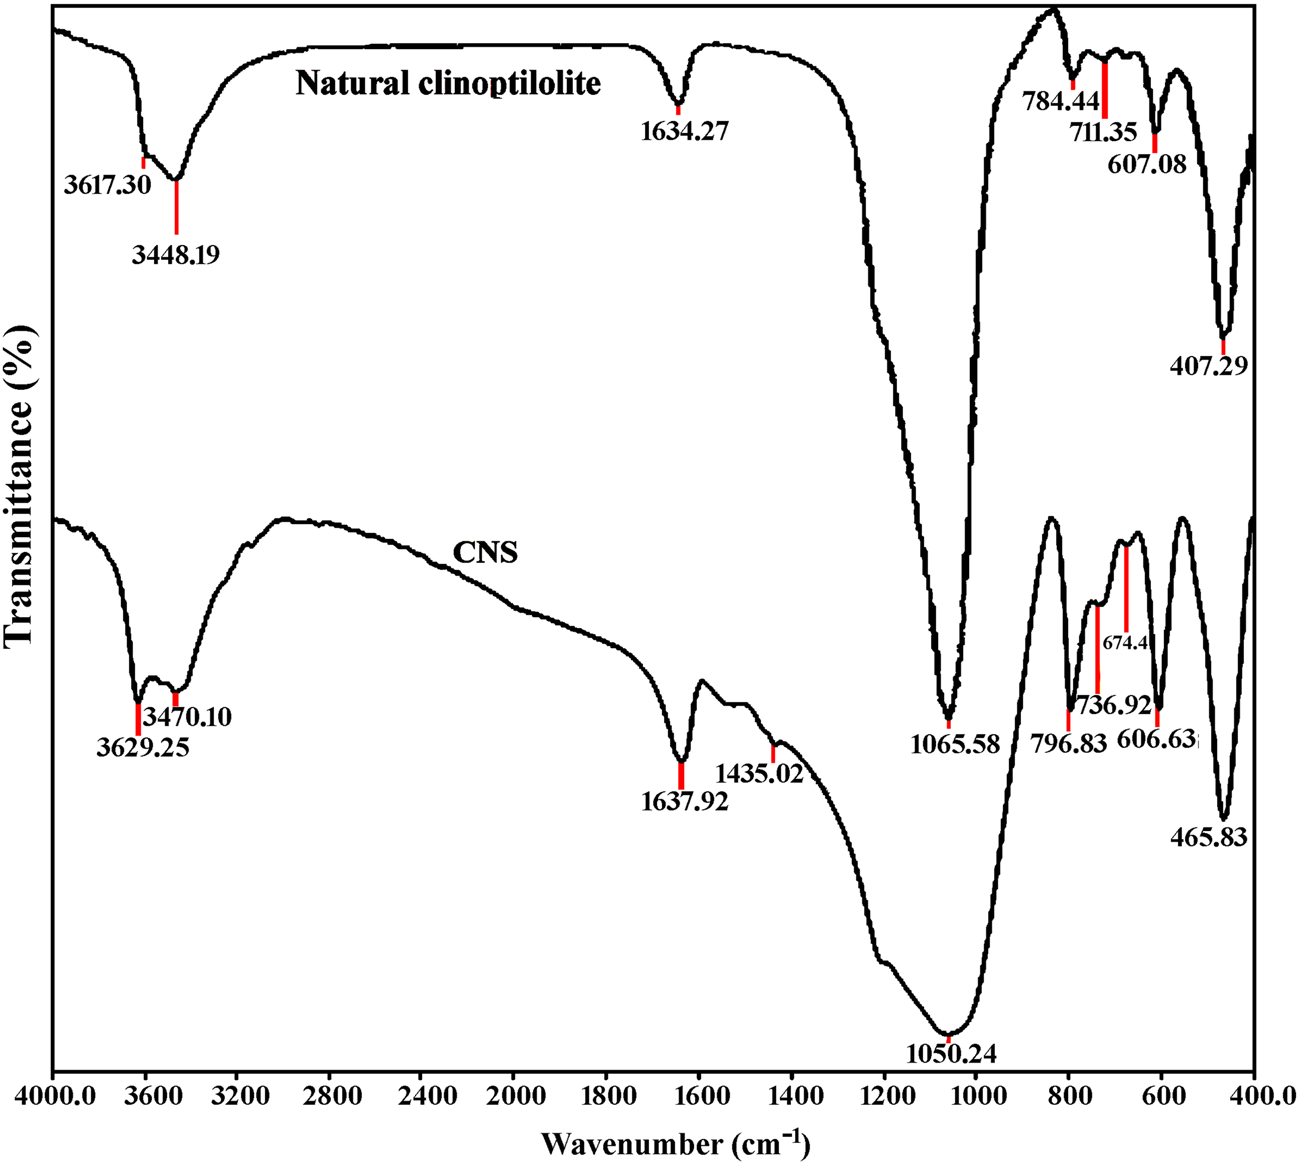
The FTIR spectra obtained from both the natural clinoptilolite and CNS samples in the range of 400–4000 cm−1 are shown in Fig. 4. In the spectrum for natural clinoptilolite, a broad band was observed between 980 and 1200 cm−1 corresponding to the Si–O–Si asymmetric and Si–OH symmetric stretching vibrations (Sun et al., Reference Sun, Meng, Jing, He and Fu2014). The absorption band at 784 cm−1 belongs to the Al–O stretching vibration (Khataee et al., Reference Khataee, Kiranşan, Karaca and Arefi-Oskoui2016). The bands at 3617, 3448 and 1634 cm−1 are due to the –OH stretching vibration, adsorbed H2O deformation and H–OH bending vibration, respectively (Zhang et al., Reference Zhang, Gao, Zhang and Guo2010). Similar absorption bands observed for the CNS sample indicate that the ball milling did not affect significantly the structure of the natural clinoptilolite. Furthermore, the observed frequencies for both samples are in good agreement with published FTIR data on clinoptilolite (Pourtaheri & Nezamzadeh-Ejhieh, Reference Pourtaheri and Nezamzadeh-Ejhieh2015). Meanwhile, the intensities of some of the IR bands related to the CNS sample, especially the band at 796 cm−1 corresponding to amorphous SiO2 formed during milling, indicate that the ball milling resulted in larger surface groups and bands due to increases in the specific surface area.
FTIR spectra of the natural clinoptilolite and CNS samples.

Figure 5 shows the initial pH value (pHi) plotted against the difference between the initial and final pH values (∆pH) of the suspensions to determine the pHpzc of the natural clinoptilolite and CNS samples. pH values of 8.0 and 8.3 are considered to be the pHpzc values of the natural clinoptilolite and CNS samples, respectively. At pHpzc, the surface has net electrical neutrality with amphoteric properties, which act as a buffer. The surfaces of the particles are positive at pH values lower than the pHpzc and negative at pH values higher than the pHpzc. The surface charge density of the material should decrease when the pH of the solution approaches the pHpzc and increase as it deviates from the pHpzc. Comparison of the pHpzc values of the natural clinoptilolite and CNS samples shows that the surface structure of the natural clinoptilolite remained unchanged during high-energy planetary ball milling.
ΔpH vs pHi plots for the determination of pHpzc of the natural clinoptilolite and CNS samples.

Model development and analysis
The results regarding copper removal for all of the experiments designed using the CCD method (Table 2) were analysed using Design-Expert 7.0.0 software and the following mathematical model of the ultrasonic-assisted sorption process was introduced:
 $$\eqalign{ {\rm C}{\rm u}^{2 +} &{\rm removal} \; (\% ) = 53.17 + 14.50 \times X_1 + 15.58 \times X_2 \cr & + 14.00 \times X_3 + 12.50 \times X_4 + 0.87 \times X_1 \times X_2 \cr &+ 3.75 \times X_1 \times X_3 + 3.37 \times X_1 \times X_4 \cr &+ 0.75 \times X_2 \times X_3 - 3.63 \times X_2 \times X_4 \cr & - 1.25 \times X_3 \times X_4 + 1.46 \times X_1^2 + 0.33 \times X_2^2 - 6.29 \times X_3^2 \cr & + 2.96 \times X_4^2 - 3.62 \times X_1 \times X_3 \times X_4 - 3.88 \times X_2 \times X_3 \times X_4 \cr & - 12.38 \times X_1^2 \times X_3 - 11.50 \times X_1^2 \times \; X_4 - 11.00 \times X_1 \times X_2^2} $$
In this model, the negative-signed terms have an antagonistic effect and the positive-signed terms have a synergistic effect on ultrasonic-assisted removal of copper ions from water.
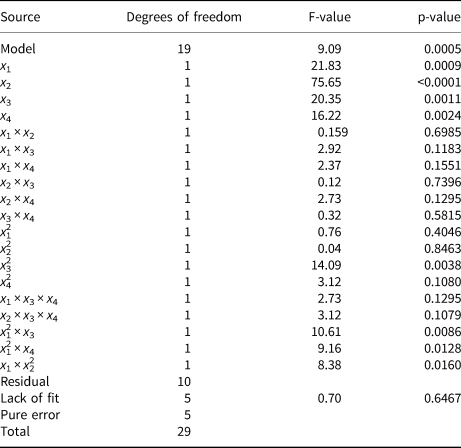
An analysis of variance (ANOVA) test was performed to justify the adequacy of the mathematical model developed. The first index is the p-value of the Fisher F test (prob. > F). The prob. > F for the proposed model was 0.0005 (Table 3), which indicates that the model is significant. Furthermore, the lack of fit (LOF) prob. > F value of 0.6467 implies that LOF is not significant. The significant model and nonsignificant LOF values indicate the suitability of the proposed model for Cu2+ ultrasonic-assisted removal by the CNS.
ANOVA for the response surface quadratic model.

After a statistical justification and assurance of the adequacy of the model developed, all of the terms within the model were also analysed statistically with the F-test to determine their importance in the model. The results for F-values and their p-values are shown in Table 3. By examining the significance tests of each of the independent effective factors and interactions among all the terms of the model with a change in levels, the effects of x 1, x 2, x 3, x 4, x 32, x 12 × x 3, x 12 × x 4 and x 1 × x 22 on Cu2+ removal efficiency are significant.
Response surface and contour plots for Cu2+ removal
The effects of CNS dosage at various sonication temperatures on the removal efficiency of copper ions at pH 4 and a sonication time of 6 min are shown in Fig. 6. The removal efficiency increases with increase of the CNS dosage and sonication temperature. The increase in the removal efficiency may be attributed to the increase in the number of active sorption sites resulting from increase in the sorbent dosage. A similar result was also reported in studies on the sorption of chemical pollutants by natural sorbents (Wang et al., Reference Wang, Liao, Zhang, Li, Xia and Cao2011; Bourliva et al., Reference Bourliva, Michailidis, Sikalidis, Filippidis and Betsiou2013).
Effect of sonication temperature and CNS dosage on the removal efficiency of copper ions (experimental conditions: pH = 4, [Cu2+]0 = 10 mg L−1, sonication time = 6 min).

At low CNS dosages, the sonication temperature does not have a significant effect on the sorption efficiency (Fig. 6). However, in the presence of greater doses of sorbent, the sorption efficiency increases with temperature. The effects of temperature on enhancing the mass transfer and pore diffusion rates of pollutants are considered to be the main reasons for the increase in the removal efficiency with sonication temperature. This leads to an increase in number of effective contacts between sorbate and sorbent. On the other hand, the increase in sonication temperature may affect the size of the clinoptilolite pore structure, which may also lead to an increase in the removal efficiency of copper ions. Moreover, it can be inferred that the sorption of copper ions by clinoptilolite is an endothermic process that occurs via physical sorption. Similar results have been reported for the surface uptake of Cu2+ ions on almond shells (Aber et al., Reference Aber, Salari and Ayoubi Feiz2011).
The effects of the initial pH of the solution and sonication time on the Cu2+ removal efficiency at 25°C are shown in Fig. 7. The Cu2+ removal efficiency increases with increasing initial pH due to the reduction in the H+ concentration. The Cu2+ ions compete strongly with H+ ions for sorption on the clinoptilolite surface at low pH values, whereas with increasing pH values, the Cu2+ loading onto the sorbent surface increases. A similar result has been reported for modified montmorillonite absorbing Pb and Cu (Sani et al., Reference Sani, Ahmad, Hussein, Ibrahim, Musa and Saleh2017). In addition, the removal efficiency of Cu2+ increased slightly with sonication time (Fig. 7). This might be attributed to an increase in the mass transfer of Cu2+ ions from the solution to the surface of CNS.
Effect of initial pH and sonication time on the removal efficiency of copper ions (experimental conditions: [Cu2+]0 = 10 mg L−1, sonication temperature = 25°C).

Optimization results
An optimization study was performed to determine the optimal levels of the experimental variables for maximization of the ultrasonic-assisted removal efficiency of Cu2+ ions and to assess the performance of the process under these conditions. Based on the regression model (equation 6) and ANOVA results, the optimum values of the CNS dosage, initial pH, sonication time and temperature for the maximum Cu2+ removal efficiency were 500 mg L−1, 6, 12 min and 45°C, respectively. Under these conditions, the predicted Cu2+ removal rate was 100%, while the experimental removal rate was ~97%. Thus, equation 6 may be used as a mathematical model of ultrasonic-assisted removal.
Pareto analysis
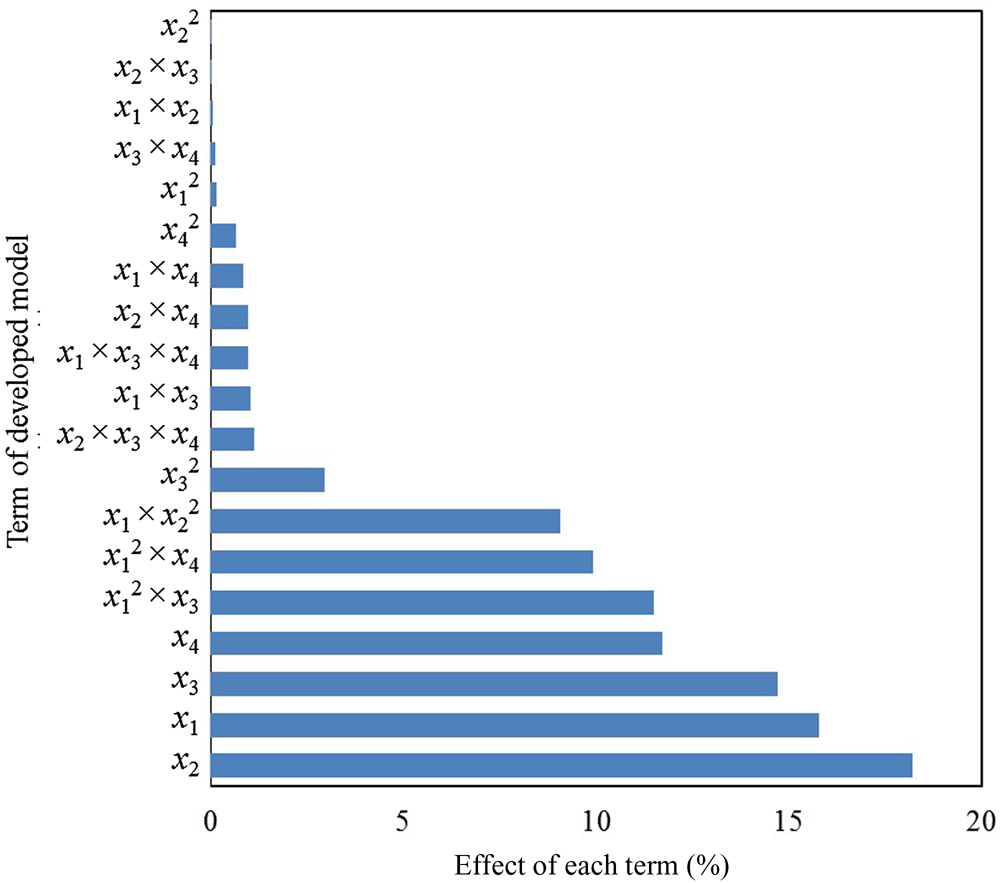
To obtain the percentage effect of each term of the developed model on the Cu2+ removal efficiency, Pareto analysis was performed using equation 7:
 $$p_{\rm i} = \left( {\displaystyle{{X_{\rm i}^2} \over {\sum X_{\rm i}^2}}} \right) \times 100 \lpar {{i}\ne 0} \rpar $$
Figure 8 shows the Pareto graphic analysis. The initial pH produces the greatest effect on ultrasonic-assisted removal efficiency (18.23%) among the variables tested.
Percentage effect of each model term obtained using Pareto analysis.

Comparison experiments
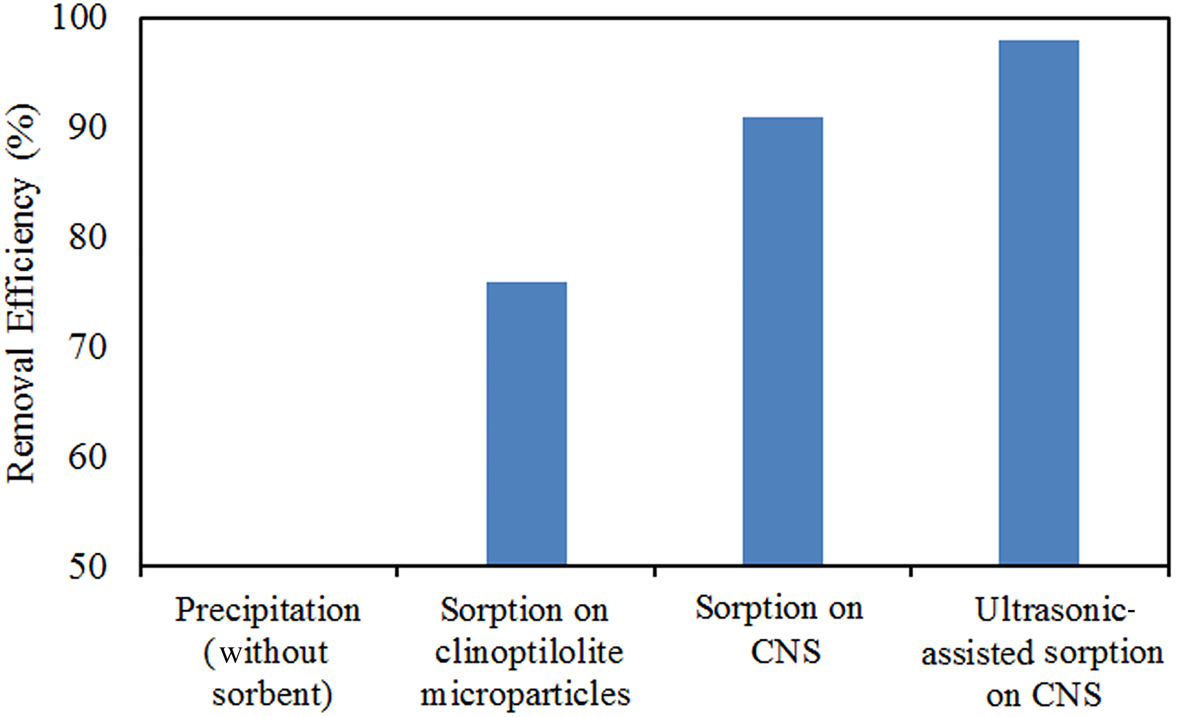
The comparison of sorption and ultrasonic-assisted sorption of Cu2+ from polluted water by CNS with sorption of this pollutant by natural clinoptilolite microstructures and precipitation (sorbent-free) processes is presented in Fig. 9 (experimental conditions were initial Cu2+ concentration of 10 mg L−1 at an initial pH of 6 with a sonication time of 12 min and a sonication temperature of 45°C). The Cu2+ ions did not precipitate at pH 6 (Fig. 9). In addition, the decrease in size of clinoptilolite particles enhanced the ability of this natural zeolite for sorption of Cu2+ from polluted water. Furthermore, ultrasonic irradiation may improve the Cu2+ removal efficiency by CNS due to increase of the contaminant mass-transfer rate around the liquid–solid interface via acoustic waves, microscopic turbulence and the high localized temperature during the collapse of cavitation bubbles.
Comparison of Cu2+ removal (%) by precipitation and sorption on natural clinoptilolite microstructures and CNS with ultrasonic-assisted sorption of Cu2+ using CNS (experimental conditions: sorbent dosage = 500 mg L−1, [Cu2+]0 = 10 mg L−1, initial pH = 6, sonication time = 12 min, sonication temperature = 45°C).

Sorption isotherm
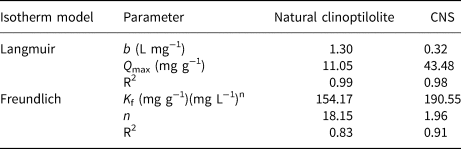
The q e and C e values obtained from the sorption isotherm experiments were fitted to the Langmuir model by plotting C e/q evs C e (Fig. 10a,b). Furthermore, Fig. 10c,d illustrates a plot of logq evs logC e to fit the experimental data with the Freundlich isotherm. Isotherm parameters for the models and correlation coefficients (R2) were calculated and are listed in Table 4. Both the Langmuir and the Freundlich isotherms generated satisfactory fits to the experimental data with consideration of the correlation coefficients. However, the Langmuir isotherm shows a better fit to the sorption data of both natural clinoptilolite and CNS samples than the Freundlich isotherm (Table 4). According to the Langmuir equation assumptions, distribution of sorbate on the homogenous natural clinoptilolite and CNS surfaces is monolayer. Comparison of the values of the maximum sorption capacities for Cu2+ on the natural clinoptilolite (11.05 mg g−1) and CNS (43.48 mg g−1) indicates the increase in sorption capacity of clinoptilolite by the ball-milling process.
Langmuir isotherms for Cu2+ sorption onto (a) natural clinoptilolite and (b) CNS and Freundlich isotherms for Cu2+ sorption onto (c) natural clinoptilolite and (d) CNS.

Langmuir and Freundlich parameters for sorption of Cu2+ on the natural clinoptilolite and CNS samples.

Comparison of CNS with other natural clinoptilolite samples
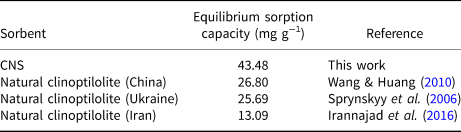
A comparison of the sorption capacity for Cu2+ ions on the CNS with that of the other natural zeolite sorbents reported in previous works is shown in Table 5. The CNS shows a greater sorption capacity in comparison to natural clinoptilolite samples. Therefore, the ball-milling process may be suitable for increasing the sorption capacity of natural clinoptilolite.
Reported equilibrium sorption capacity for Cu2+ on natural clinoptilolite samples in comparison with CNS samples.

Conclusions
The preparation of CNS from natural clinoptilolite and using ultrasound irradiation increases the efficiency of natural zeolite in terms of the removal of Cu2+ ions from the aqueous phase. The process was optimized by RSM based on CCD. Approximately 97% of the Cu2+ ions were removed under the following optimized operational variables: a CNS dosage of 500 mg L−1, an initial pH of 6, a sonication time of 12 min and a sonication temperature of 45°C. The initial pH was the most important individual parameter. The efficiency of removal of Cu2+ via the ultrasonic-assisted sorption processes was greater than that achieved by sorption alone onto the CNS.
Acknowledgments
The authors thank Kharazmi University, Iran, for financial and other support.