I. INTRODUCTION
As a long-standing issue, the microstructures of metallic glasses (MGs) have been extensively studied by both experimental and theoretical efforts because their glass-forming mechanisms and unique properties strongly relate to their atomic- and cluster-level structures.Reference Finney1–Reference Yavari6 ZrCu and ZrNi binary systems have been attracting intense interest because they are the representative models allowing structural investigationReference Li, Guo, Kalb and Thompson7–Reference Huang, Wang, Hao, Kramer and Ho11 based on the following facts: (i) the amorphous alloys could be fabricated over a wide compositional region in both systemsReference Buschow and Beekmans12; (ii) unlike multicomponent MGs, they contain only two components, more direct and reliable structural results can be obtained via experimental or theoretical methods. Because Cu and Ni are neighbor elements in the periodic table and their atomic radii are almost the same in length,Reference Miracle, Louzguine-Luzgin, Louzguina-Luzgina and Inoue13 it is expected that the microstructures should be similar between a ZrCu and its corresponding ZrNi composition according to Miracle’s structural model.Reference Miracle4 As a result, these two alloy systems may exhibit a similar behavior. However, the experimentsReference Yang, Yin, Wang, Cao, Jiang, Saksl and Franz14–Reference Inoue, Zhang and Masumoto17 showed that: (i) ZrCu binary MGs exhibit a glass transition event, whereas the ZrNi counterparts do not; (ii) ZrCu MGs have a relatively high glass-forming ability (GFA). In particular, several pinpointed compositions enable formation of the bulk MGs in ZrCu system,Reference Xu, Lohwongwatana, Duan, Johnson and Garland18, Reference Wang, Li, Sun, Sui, Lu and Ma19 while not in the ZrNi counterpart. Therefore, the origin of the different behavior between these two alloys needs to be revealed. Here a series of state-of-the-art synchrotron radiation–based experiments and simulations were performed to investigate the microstructures of Zr70Cu30 and Zr70Ni30 MGs. Substantial structural difference was observed for these two alloys. Furthermore, the atomic-scale structural difference explained the origin of the different GFA in these two systems.
II. EXPERIMENTS AND SIMULATIONS
Zr70Cu30 and Zr70Ni30 compositions were selected because such Cu (Ni)/Zr ratio meets the stoichiometric demand of the solute-centered cluster structural model.Reference Miracle4, Reference Sheng, Luo, Alamgir, Bai and Ma5 The alloy ingots were prepared by arc melting the mixtures of Zr (99.9 wt%), Cu (99.9 wt%), and Ni (99.9 wt%) elements in Ti-gettered high-purity argon atmosphere and were melted at least four times to ensure their compositional homogeneity. The corresponding amorphous ribbons were fabricated by the same method used in our previous work,Reference Yang, Yin, Wang, Cao, Jiang, Saksl and Franz14, Reference Yang, Guo, Chen, Wei, Jiang and Wang20 with a cross section of 0.04 × 2 mm2. Their glassy structures were confirmed by using the x-ray diffraction (Cu Kα, radiation) and differential scanning calorimeter (NETZSCH DSC 404 C). Subsequently, the synchrotron radiation–based high-energy (about 100 keV) x-ray diffraction measurements were performed for both samples at the beam line BW5 of Hasylab in Germany. The two-dimensional diffraction data were recorded by using a Mar345 image plate. In addition, by using the transmission mode, their Zr, Cu, and Ni K-edge extended x-ray absorption fine structure (EXAFS) spectra also were measured at the beam lines A1 in Hasylab and BL14W1 in SSRF of China. Both the diffraction patterns and EXAFS spectra were normalized via a standard data reduced procedure,Reference Yang, Yin, Wang, Cao, Jiang, Saksl and Franz14 by using the software PDFgetX and Viper, respectively. To obtain the atomic structural information as reliable as possible, both the normalized diffraction and EXAFS data were simulated simultaneously under the framework of reverse Monte-Carlo (RMC).Reference Miracle4, Reference Yang, Xia, Wang, Dong, Chen, Ou, Liu, Jiang, Klementiev, Saksl, Franz, Schneider and Gerward21 Two cubic boxes we used for the RMC simulation contain 20,000 atoms, matching the Zr70Cu30 and Zr70Ni30 compositions, respectively. Then, the simulated atomic structural models were further analyzed by the Voronoi tessellation method.Reference Miracle4, Reference Yang, Guo, Zhang and Chen22
III. RESULTS AND DISCUSSION
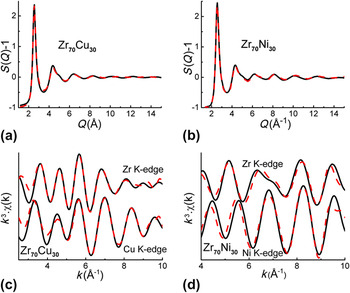
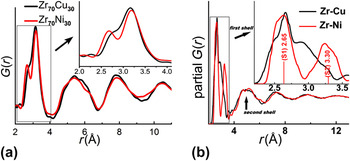
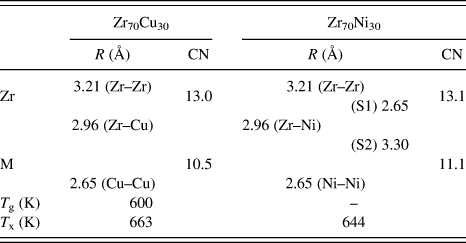
Figures 1(a)–1(d) show the structural factor S(Q) (obtained from the diffraction measurements) and the Zr, Cu, and Ni K-edge EXAFS data in Zr70Cu30 and Zr70Ni30 samples, along with their corresponding simulated curves. The smooth experimental S(Q) curves without any sharp peaks also confirm the full amorphous nature of these two samples. The good matching confirms the reliability of the RMC simulation. The total pair distribution function, G(r), of Zr70Cu30 and Zr70Ni30 is plotted in Fig. 2(a). It is evident that the first-shell distribution (FSD) splits into two sharp subpeaks in Zr70Ni30, while only a shoulder peak besides the main peak appears in that of Zr70Cu30. This contrast indicates the structural difference between these two alloys, which also were observed elsewhere.Reference Georgarakis, Yavari, Aljerf, Louzguine-Luzgin, Stoica, Vaughan and Inoue15 The simulated Zr–Cu and Zr–Ni partial G(r)s are plotted in Fig. 2(b). It is clear that the FSD of Zr–Ni G(r) is formed by two subpeaks (S1 and S2), consistent with the two sharp subpeaks in Fig. 2(a). Whereas Zr–Zr, Zr–Cu, Cu–Cu, and Ni–Ni partial G(r)s exhibit only one broad peak (which is not shown here). In addition, we deduced a more detailed atomic-level structural information based on the atom position–determined structural model obtained by the RMC simulation. The first-shell coordination numbers (CNs) and the atomic pair distances are listed in Table I. The CNs are consistent with the results in other corresponding investigations.Reference Miracle, Louzguine-Luzgin, Louzguina-Luzgina and Inoue13, Reference Cheng and Ma23, Reference Ma, Stoica, Wang, Lu, Xu and Kramer24 It is worth noting that the first-shell of Zr–Ni pairs has two distance distributions (S1 and S2) with the corresponding average values of 2.65 and 3.30 Å, respectively. However, the sum of the Goldschmidt radii of Zr and Ni is 2.84 Å.Reference Yang, Guo, Chen, Wei, Jiang and Wang20 This indicates that the Ni center atoms form a relatively strong bond with some of their neighbor Zr atoms, exhibiting a shorter pair distance (about 2.65 Å). The formation of the strong bond between Ni and Zr atoms may be due to the fact that Ni atoms need two electrons to fill their 3d shell and Zr atoms may have a relatively strong tendency to lose the 4d 5s valence electrons. Because the Ni centers are surrounded with these nearest Zr atoms more densely, some other Zr atoms are “pushed away” from the centers (about 3.30 Å away), although they also could be regarded as the first-shell neighbors. However, the strong atomic interaction may be absent in Zr–Cu pairs because the Zr–Cu bond (2.96 Å) is not shorter than their sum of the Goldschmidt radii (2.88 Å).Reference Georgarakis, Yavari, Aljerf, Louzguine-Luzgin, Stoica, Vaughan and Inoue15
(a, b) S(q) and (c, d) EXAFS data obtained from the experiments (black solid lines) and RMC simulations (red dash lines) in Zr70Cu30 and Zr70Ni30 MGs.

(a) The total G(r) of Zr70Cu30 (black line) and Zr70Ni30 (red line) MGs. The inset is an enlarged view showing the first-shell distribution (FSD). (b) The Zr–Cu and Zr–Ni partial G(r) in Zr70Cu30 and Zr70Ni30, respectively. The inset is an enlarged view showing their FSDs, and the FSD of Zr–Ni is made up of two subpeaks (S1 and S2).

Atomic structural information, including: the first-shell coordination numbers (CNs) of Zr and M (M = Cu and Ni) atoms and the atomic pair distances obtained by RMC simulation, and the thermal parameters for Zr70Cu30 and Zr70Ni30 alloys.
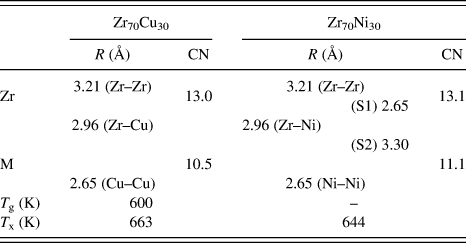
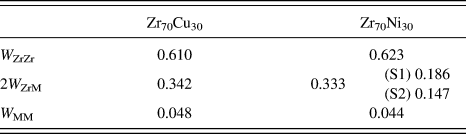
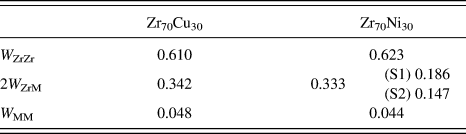
Based on the results deduced above, we may explain the formation of the FSD in Fig. 2(a). In Zr70Ni30 alloy, the combination of the nearest Zr–Ni (S1 = 2.65 Å) and Ni–Ni (2.66 Å) pairs contributes to the formation of the first G(r) subpeak located at 2.65 Å, whose sum of the scattering weight factor W ij is about 0.230, as shown in Table II. In addition, the second subshell Zr–Ni (S2 = 3.30 Å) and the Zr–Zr (3.21 Å) bonds make up of the second G(r) subpeak at 3.25 Å. Concerning the Zr70Cu30 counterpart, although the Cu–Cu (2.65 Å) and Zr–Zr (3.21 Å) pairs contribute to the shoulder peak (2.65 Å) and the main peak (3.21 Å), respectively, the impact of Zr–Cu bonds (2.96 Å) upon the total G(r) with a W ij of 0.342 links up these two subpeaks, resulting in almost a sole strong peak in the FSD in G(r).
The scattering weight factors W ij (M = Cu and Ni) in Zr70Cu30 and Zr70Ni30 MGs.
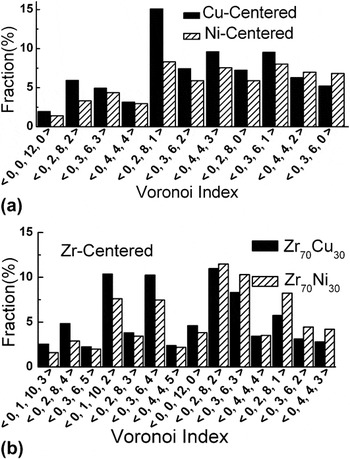
Furthermore, we may deduce their cluster-level microstructures by applying the Voronoi tessellation approach. Cu and Ni atoms are regarded as the solutes in Zr70Cu30 and Zr70Ni30 alloys considering their concentrations (30 at.%). We extracted the Cu- and Ni-centered Voronoi clusters (VCs),Reference Yang, Guo, Chen, Wei, Jiang and Wang20 whose distributions are plotted in Fig. 3(a). Only those major VCs whose fractions are higher than 2% are selected. It is shown that the major VCs centered with Cu (Ni) have a broad distribution with CNs ranged from 9 to 12, and the fractions of almost all major VCs are higher in Zr70Cu30 than in Zr70Ni30. Considering other minority VCs, we could deduce more than 100 Voronoi indices in Ni-centered VCs while only about 50 in Cu-centered counterparts. In addition, we also present the Zr-centered VCs in Fig. 3(b) although Zr atoms should be regarded as the solvents. It is found that Zr70Cu30 is apt to contain larger VCs (with CN above 12) while Zr70Ni30 prefers to smaller VCs (with CN less than 12) relatively.
Distribution of the Voronoi clusters (VCs) centered with (a) Cu and Ni atoms and (b) Zr atoms.

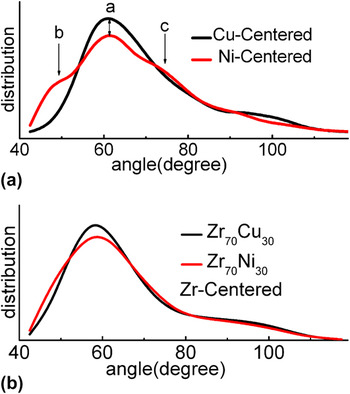
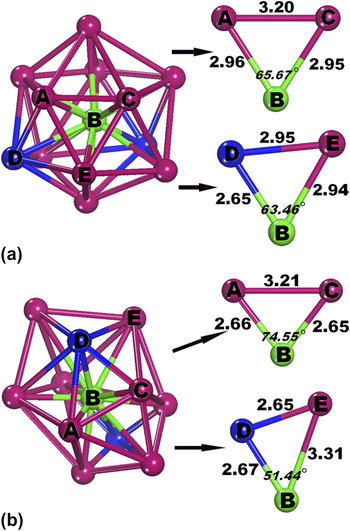
Here, we can explain the dependence of the GFA on microstructures in Zr70Cu30 and Zr70Ni30 from the atomic and cluster scales. The Ni atoms are connected with their neighbors about 2.65 Å (about two Ni and five Zr atoms) and 3.30 Å (four Zr atoms) away. However, the Cu–Cu and Cu–Zr bonds are 2.65 (two Cu atoms) and 2.96 Å (eight Zr atoms), respectively. The relatively narrow (wide) distribution of the pair distances around Cu (Ni) center atoms indicates that the Cu center atoms are apt to be surrounded with the neighbor atoms from more similar distances compared with the Ni center atoms, leading to the formation of more regular Cu-centered VCs than those centered with Ni atoms. As a result, the relatively regular major VCs with abundant fivefold symmetrical features possess a higher fraction in Zr70Cu30 than in Zr70Ni30, as shown in Fig. 3(a), which are the preferred building blocks contributing to the formation of glassy state of alloys.Reference Yang and Guo25 In addition, the distributions of bond angles in Cu- and Ni-centered clusters are shown in Fig. 4(a). It is observed that the distribution exhibits only one peak located about 60° in the Cu-containing alloy while three pronounced peaks appear about 49°, 60° and 75° in the Ni-containing counterpart. It indicates that compared with the Cu-centered VCs, the neighbor atoms are apt to random pack topologically on the shell to form more irregular Ni-centered VCs. And by using the atomic separations deduced above, we construct the relatively regular (irregular) Cu (Ni)-centered cluster models, which are plotted in Fig. 5. Some representative bond angles are extracted from these models, whose degrees are consistent with the pronounced peaks in Fig. 4(a). It reveals that the regularity of clusters strongly relates to the distributions of bond angles and the atomic distances. We also plot the distributions of bond angles in the Zr-centered VCs for both samples in Fig. 4(b). Although their difference is much smaller than that between Cu- and Ni-centered VCs, the relatively narrow angle distribution indicates that the Zr-centered VCs should be more regular structural units in Zr70Cu30 than in Zr70Ni30. Because it has been suggested that the regular clusters with spherical-like symmetry could lead to the formation of MGs and even bulk MGs,Reference Xi, Li, Zhang, Wang and Wu26–Reference Sha, Feng and Li28 therefore, in our case, the relatively regular (irregular) Cu (Ni)-centered and even the Zr-centered clusters deduced should contribute to the relatively high (low) GFA in the Zr70Cu30 (Zr70Ni30) alloy.
(a) Distribution of the bond angles in VC centered with Cu and Ni atoms for Zr70Cu30 (black line) and Zr70Ni30 (red line) MGs, respectively. The bond angle is formed by atoms ABC, B is the Cu or Ni center atom and A and C represent its shell atoms. (b) Distribution of the bond angles in VC centered with Zr atoms for Zr70Cu30 and Zr70Ni30 MGs.

The illustrations of (a) Cu- and (b) Ni-centered VC models and the extracted bond angles and corresponding bond lengths. B stands for the Cu (Ni) center atom, and A, C, D, and E represent the shell atoms.

IV. CONCLUSIONS
In summary, the microstructures of Zr70Cu30 and Zr70Ni30 MGs are investigated at the atomic and cluster scales. Even though they are neighbor elements in the periodic table and their atomic radii are almost the same, substantial structural difference was found between Zr70Cu30 and corresponding Zr70Ni30 alloys. After further analysis, the relatively regular clusters caused by the narrow distributions of atomic separations and bond angles are detected in Zr70Cu30 MG, which should be the structural origin of the relatively high GFA in ZrCu alloys than in the corresponding ZrNi counterparts.
ACKNOWLEDGMENTS
The authors would like to thank HASYLAB in Germany and SSRF in China for the use of the advanced synchrotron radiation facilities. Financial support from the National Natural Science Foundation of China (Grant No. 10805027), the Natural Science Foundation of Jiangsu Province (Grant No. BK2008397), and the NUAA Research Funding (Grant No. NS2010168) are gratefully acknowledged.