I. INTRODUCTION
Due to the excellent luminescent properties originate from the transitions within the partially filled 4f shells, trivalent rare earth ions doped inorganic compounds are widely used as luminescent materials in illumination and displays, lasers, and scintillators. Reference Guo, Liao and Xia1–Reference Zhou and Xia3 Among the known material systems, tungstate based compounds have been widely researched and used for their excellent optical properties. Reference Huang, Hou, Ling, Liu and Yu4–Reference Lei, Yan, Chen and Zhao8 Except for their stable chemical and physical properties to being good hosts, tungstate can absorb ultraviolet light effectively to excite many trivalent rare ions. And the WO4 2− groups in the compounds also show self-excited properties, which can combine with the luminescence from the trivalent rare earth ions like Eu3+ and Tb3+ to obtain more complex colors for more applications. Reference Jia, Wang and Xu9,Reference Wang, Yang, Cheng, Wang, Hou, Dai, Li and Lin10 So they are important for UV-pumped phosphors as well as related applications.
In recent years, single wave length excited single matrix phosphors for multiple colors illumination and display like white light LEDs (WLEDs) attract more and more attention. From the literature, the normal and simply way to realize multiple colors is to combine the luminescence from multiple active ions in single host. The typical examples are Eu/Mn co-activated single matrix white light phosphors. Reference Huang, Chen, Liu, Chiu, Yeh and Jang11–Reference Lv, Jiao, Zhao, Shao, Lü and You13 For example, Liu et al. reported the Eu/Mn co-activated blue-to-white emitting single-phase Mg2Al4Si5O18 phosphor for UV WLED, the EL spectrum obviously displays three emission bands at 385, 480, and 610 nm, which derive from the 385 nm NUV chip, Eu2+ emission, and Mn2+ emission, respectively. Reference Schmiechen, Schneider, Wagatha, Hecht, Schmidt and Schnick14 And Ce3+/Tb3+/Mn2+ co-activated CaScAlSiO6 phosphor Reference Lü, Guo, Jia, Zhao, Lv, Jiao, Shao and You15 can be used as a more complex doped example, too. Moreover, tungstates have their unique advantage that the WO4 2− groups can give blue emission to combine with the other luminescence from the active ions in the tungstates, Reference Lei and Yan16,Reference Lei, Yan, Chen and Zhao17 so rare earth co-doped tungstates might be used as excellent single component phosphors for multiple colors applications, which need more research for novel and effective functional materials.
In recent years, sodium-based trivalent lanthanide double tungstate [NaLn(WO4)2] (Ln = rare earth ions) attracted much attention for their excellent optical performance. Reference Cheng, Xia, Molokeev and Jing18–Reference Yang, Fu, Liu, Zhang, Wei, Wu and Sheng21 Among them, sodium yttrium double tungstate NaY(WO4)2 (NYW) has the advantages of the stable chemical properties, wide absorption in ultraviolet (UV) region, and high damage threshold. From the literature, it is few reports for the co-doped rare earth ions to adjust the colors of products. Furthermore, the mostly used synthesis method of NYW is sol–gel method, Reference Durairajan, Balaji, Rasu, Babu, Hayakawa and Valente22,Reference Jia, Liu, Luo, Yu and Lin23 hydrothermal method, Reference Feng, Yang, Cao, Guan and Xu24,Reference Xu, Xu, Lu, Wang and Hu25 and solid state method. Reference Chen, Yang, Chung, Moon, Choi, Jeong and Kim26 Little attention has been paid to the molten salt synthesis. But the reported documents on other materials systems have supported that molten salt (MS) synthesis, which uses melting salt as a solvent, is a good approach to synthesize various micro- and/or nano-materials. Reference Xiaochun and Xiaojun27–Reference Zhao, Liu, Guo and Yang30 The method possesses the merits of simplicity, versatility, and the ability for large-scale synthesis. So it might be used to obtain products of NYW with required morphology.
In this work, we have combined the molten salt method and Eu3+/Tb3+ co-doped design to obtain novel NYW based functional phosphor with novel microstructure as well as interesting luminescence. The colors of the products can be tuned simply by adjusting the molar ration of Eu3+ and Tb3+ ions. And the structural and morphological properties of the co-doped phosphors were also discussed.
II. EXPERIMENT SECTION
A series of Eu3+, Tb3+ co-doped NaY(WO4)2 phosphors were synthesized by molten salt method. The starting materials were Na2CO3 (AR), WO3 (AR), Y2O3 (4N), Eu2O3 (4N), Tb4O7 (4N), and NaCl (AR), respectively. Among them, NaCl was added as a flux. The raw materials were weighed by stoichiometric (NaY(1−x−y)(WO4)2:Eu3+ x ,Tb3+ y ) and mixed homogeneously in an agate mortar for about 30 min and then calcined in an alumina boat at a certain temperature (800–1100 °C) for about 10 h. The obtained powder was washed completely with deionized water for several times and detected the upper clear solution by AgNO3 solution to ensure the Cl− ions have been totally removed, then the final product was dried in the oven at 80 °C for 12 h.
III. MEASUREMENT
X-ray powder diffraction (XRD) analyses were recorded with Rigaku D\max-2550 X-ray diffractometer (Rigaku Corporation, Tokyo, Japan) equipped with a Cu Kα radiation. The morphology of product was investigated by scanning electronic microscope (SEM). Photoluminescence (PL) spectra were obtained using fluorescence spectrophotometer (RF-5301PC, Shimadzu Corp., Tokyo, Japan) at room temperature. All the measurements were performed at room temperature.
IV. RESULTS AND DISCUSSION
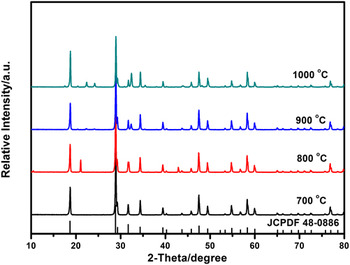
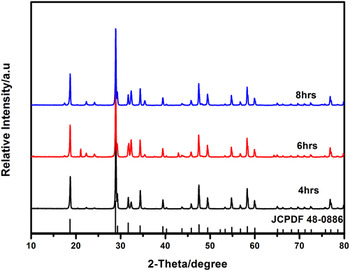
XRD measurement were applied to verify the phase purity of the as-prepared Eu3+ and Tb3+ co-doped NaY(WO4)2 samples. Temperature plays an important role in synthesizing pure phase. So in this work we carried out a series of samples prepared at different temperatures of 700, 800, 900, and 1000 °C, respectively. As shown in Fig. 1, the XRD patterns of NaY0.96(WO4)2:Eu3+ 0.02,Tb3+ 0.02 obtained at different temperature for 4 h are presented. Compared to the standard JCPDF card, we can find the product obtained at 900 °C for 4 h can be indexed well to the JCPDF card 48-0886, which corresponding to the phase of sheelite NaY(WO4)2, with space group I41/a[88] and the lattice parameters of a = b = 5.205 Å, and c = 11.251 Å, and α = β = γ = 90°. Some Y2WO6 phase (PDF#23-1489) existed of the products obtained at 800 °C and 1000 °C, although the main products are NaY(WO4)2 at 800 °C, the diffraction peak intensity of the impurity phase is relatively weak. While the crystallinity of the products obtained at 700 and 900 °C is better. From the XRD pattern, we can observe that except the main NYW phase of the product obtained at 800 °C, there are also some other diffraction peaks of other phase, which may be originated from the experimental error. And there are some other obvious diffraction peaks appeared when the temperature is reached 1000 °C. So we can conclude that the pure NYW can be synthesize by molten salt process in the present of NaCl at 700–900 °C. Although the melting point of NaCl is 801 °C, we thought Na2CO3 in the raw material attend this the reaction, for Na2CO3 and NaCl in a certain proportion will form a low eutectic salt, a total of melt temperature is 637 °C. Reference Fujii, Kodaira, Kawauchi, Tanaka, Yamashita and Anpo31 So we can get the pure sheelite structure NaY(WO4)2 phase at 700 °C. Figure 2 shows the XRD pattern of NaY0.96(WO4)2:Eu3+ 0.02,Tb3+ 0.02 obtained at 900 °C for 4, 6, and 8 h, respectively. All the diffraction peaks can be indexed to the JCPDF card of 48-0886, with space group I41/a[88] and the lattice parameters of a = b = 5.205 Å, and c = 11.251 Å, and α = β = γ = 90°. Compared with the three kinds of different reaction time, there is not much difference from each other, but some weak diffraction peaks appeared of the product obtained for 6 and 8 h. According to the temperature experiments had discussed, we knew that the pure phase of the product can be obtained at 700–900 °C for 4 h. Usually, with the prolonging reaction hours, the intensity of the diffraction peaks increased, which indicate that longer reaction time is better for the crystallization of the products. While in this work, the longer reaction time is not suitable for obtain pure NYW phase, of course this may be due to the experiment condition.
XRD patterns of NaY0.96(WO4)2:Eu3+ 0.02,Tb3+ 0.02 synthesized by molten salt synthesis in the present of NaCl at different temperature (700, 800, 900, and 1000 °C) for 4 h.

XRD patterns of NaY0.96(WO4)2:Eu3+ 0.02,Tb3+ 0.02 synthesized at 900 °C for different hours 4, 6, and 8 h.

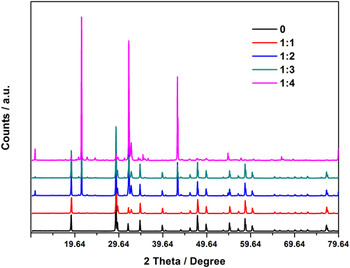
The amount of molten salt also has the influence on the phase purity. Figure 3 shows the XRD patterns of NaY0.96(WO4)2:Eu3+ 0.02,Tb3+ 0.02 synthesized at 900 °C for 4 h with different mass ratio of the flux NaCl (a) 0, (b) 1:1, (c) 1:2, (d) 1:3, and (e) 1:4, respectively. From the XRD results, we can observe that the pure NYW phase can be obtained at 900 °C for 4 h without the flux and with the mass ratio of NaCl 1:1. And with the mass ratio of NaCl increasing, NYW single pure phase can’t be obtained, some other phase come into being. That is too much flux may reduce the concentration of reaction material, and increase the distance between reaction particles.
XRD patterns of NaY0.96(WO4)2:Eu3+ 0.02,Tb3+ 0.02 synthesized at 900 °C for 4 h with different mass ratio of NaCl (a) 0, (b) 1:1, (c) 1:2, (d) 1:3, and (e) 1:4, respectively.

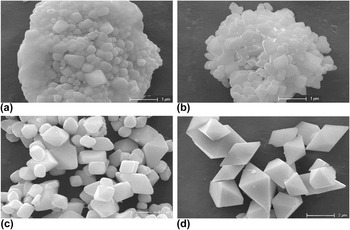
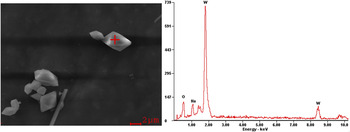
Figure 4 shows the SEM images of NaY0.96(WO4)2:Eu3+ 0.02,Tb3+ 0.02 synthesized by molten salt synthesis at different temperature of (a) 700, (b) 800, (c) 900, and (d) 1000 °C for 4 h, respectively. As can be seen from the SEM images, with increasing the reaction temperature, the grain size increased obviously. According to the XRD pattern of the products, the particles crystallized completely. When kept at 700 °C, we can observe the small crystalline grains formed from the large agglomeration, the mean grain size is about 0.25 μm [Fig. 4(a)]. And when the temperature is increased to 800 °C, the crystal grow up with the mean size of about 0.5 μm, and a large amount of crystal shows the outline of octahedron gradually [Fig. 4(b)]. As the temperature is increased to 900 °C, the octahedron crystal completely formed and separated with each other, the mean size of them is about 0.5–1 μm [Fig. 4(c)]. With continue increasing the temperature to 1000 °C, the crystal is grown larger, and totally formed to the morphology of octahedron with the size of 2–4 μm [Fig. 4(d)], which indicating that the crystal of NaY0.96(WO4)2:Eu3+ 0.02,Tb3+ 0.02 phosphor grow larger and crystallized at higher temperature. The EDS analysis (Fig. 5) shows that the crystal contain Y, W, Na, and O elements of the samples obtained by MSS in NaCl medium, which is consistent with the XRD pattern.
SEM images of NaY0.96(WO4)2:Eu3+ 0.02,Tb3+ 0.02 synthesized by molten salt synthesis at different temperature (a) 700, (b) 800, (c) 900, and (d) 1000 °C for 4 h, respectively.

Energy dispersive X-ray spectra of NaY0.96(WO4)2:Eu3+ 0.02,Tb3+ 0.02 synthesized at 1000 °C for 4 h.

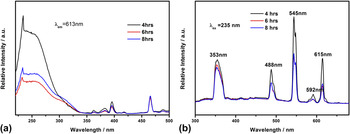
Figure 6(a) shows the excitation spectra of NaY0.96(WO4)2:Eu3+ 0.02,Tb3+ 0.02 obtained at 900 °C for 4, 6, and 8 h, monitoring the red emission of 5D0–7F2 emission at 613 nm. The excitation spectra were composed of a broad band from 220 to 350 nm with a maximum at ∼254 nm and several sharp lines range from 350 to 500 nm. The broad intense band centered at ∼254 nm usually is related to the host adsorption, which attributes to the charge transfer absorption from the 2p orbital of oxygen ligand to the 5d orbital of the central tungsten atom in the WO4 2− group, indicating the energy transfer from WO4 2− to Eu3+. In respect of f–f transitions of Eu3+, the intense peak at 394 nm is due to 7F0 → 5L6. The peaks at 362, 464, and 535 nm are ascribed to 7F0 → 5D J (J = 4, 2, 1). With prolonging the reaction time, the intensity of the excitation spectra decreased. From this experiment we can conclude that the best synthesis condition is at 900 °C for 4 h.
Excitation (a) and emission (b) spectra of NaY0.96(WO4)2:Eu3+ 0.02,Tb3+ 0.02 synthesized by molten salt synthesis at 900 °C for different hours (λem = 613 nm, λex = 235 nm).

Figure 6(b) shows the emission spectra of NaY0.96(WO4)2:Eu3+ 0.02,Tb3+ 0.02 obtained at 900 °C for 4, 6, and 8 h under 235 nm UV excitation. The emission bands composed of a 353 nm band and the bands originated from the characteristic transitions of Tb3+ ions and Eu3+ ions. The band at 353 nm may be origin from the charge transfer transition of O → W. Within 4f 6 configuration of Eu3+ ions, for example, including 5D1 → 7F1 (535 nm), 5D0 → 7F0 (580 nm), 5D0 → 7F1 (590 nm), 5D0 → 7F2 (610, 625 nm), and 5D0 → 7F3 (653 nm), respectively. The strongest one is located at 615 nm. And the band from 450 to 600 nm is originated from Tb3+ ions, which are all attributed to 5D4 → 7F J (J = 6, 5, 4, 3) transitions of Tb3+ corresponding to 5D4 → 7F6 (488 nm), 5D4 → 7F5 (542 and 548/549 nm), 5D4 → 7F4 (588 nm), and 5D4 → 7F3 (620 nm), respectively. The strongest emissions all locate at 545 nm and are indexed to the 5D4 → 7F5 transition of Tb3+. Similarly, the presented emissions of Eu3+ and Tb3+ by excitation of WO4 2− group should be ascribed to the energy transfer from the WO4 2− to the Eu3+ and Tb3+ ions.
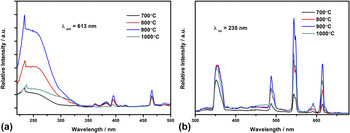
Figures 7(a) and 7(b) shows the excitation and emission spectra of NaY0.96(WO4)2:Eu3+ 0.02,Tb3+ 0.02 obtained by molten salt synthesis at different temperature of 700, 800, 900, and 1000 °C for 4 h, respectively. The excitation spectra monitored at 613 nm of Eu3+’s 5D0 → 7F2 emission [Fig. 7(a)]. The same with the PL spectra of the products obtained at 900 °C for different hours. The excitation spectra were composed of a broad band from 220 to 350 nm with a maximum at ∼254 nm and several sharp lines range from 350 to 500 nm. The broad intense band centered at ∼254 nm usually is related to the host adsorption, which attributes to the charge transfer absorption from the 2p orbital of oxygen ligand to the 5d orbital of the central tungsten atom in the WO4 2− group, indicating the energy transfer from WO4 2− to Eu3+. In respect of f–f transitions of Eu3+, the intense peak at 394 nm is due to 7F0 → 5L6. The peaks at 362 (366), 464, and 535 nm are ascribed to 7F0 → 5D J (J = 4, 2, 1). While the intensity of the band changed greatly with the variation of reaction temperature. With increasing the temperature, the intensity increased firstly, and reached the maximum at 900 °C and then decreased, the results agreed with the XRD pattern. Which indicate that the pure phase of the NaY(WO4)2 is favorable for light emitting. Figure 7(b) shows the emission spectra of NaY0.96(WO4)2:Eu3+ 0.02,Tb3+ 0.02 obtained by molten salt synthesis at different temperature (700, 800, 900, and 1000 °C) for 4 h, which was excited under the 235 nm UV light. The emission bands composed of a 353 nm band and the bands originated from the characteristic transitions of Tb3+ ions and Eu3+ ions. The tendency of intensity is the same with the excitation spectra. The product obtained at 900 °C shows the excellent luminescent properties.
Excitation (a) and emission (b) spectra of NaY0.96(WO4)2:Eu3+ 0.02,Tb3+ 0.02 synthesized by molten salt synthesis at different temperature (700, 800, 900 and 1000 °C) for 4 h. (λem = 613 nm, λex = 235 nm).

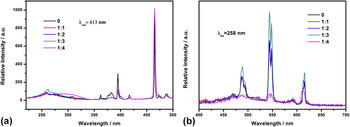
The excitation (a) and emission (b) spectra of NaY0.96(WO4)2:Eu3+ 0.02,Tb3+ 0.02 synthesized at 900 °C for 4 h with different mass ratio of NaCl (a) 0, (b) 1:1, (c) 1:2, (d) 1:3, and (e) 1:4 are shown in Fig. 8, respectively. The excitation spectra were monitored at 613 nm at room temperature, contains a broad band range from 220 to 350 nm and sharp lines of 362, 382, 395, 417, 465, 472, and 488 nm, the broad band attributes to the charge transfer absorption from the 2p orbital of oxygen ligand to the 5d orbital of the central tungsten atom in the WO4 2− group. The sharp lines origin from f–f transitions of Eu3+, the intense peak at 395 nm is due to 7F0 → 5L6, The peaks at 362 (366), 465, and 488 nm are ascribed to 7F0 → 5D J (J = 4, 2, 1). With the increasing of the mass ratio of NaCl, we can observe the difference of the intensity and the position of the band. When the mass ratio researched 1:4, the peak of the broad band shifted from 261 to 292 nm, which is due to the different tungstate host. It was consistent with the previously discussed XRD results.
Excitation (a) and emission (b) spectra of NaY0.96(WO4)2:Eu3+ 0.02,Tb3+ 0.02 synthesized at 900 °C for 4 h with different mass ratio of NaCl (a) 0, (b) 1:1, (c) 1:2, (d) 1:3, and (e) 1:4, respectively.

The emission spectra of NaY0.96(WO4)2:Eu3+ 0.02,Tb3+ 0.02 synthesized at 900 °C for 4 h with different mass ratio of NaCl (a) 0, (b) 1:1, (c) 1:2, (d) 1:3, and (e) 1:4 were excited under 258 nm, respectively. The spectra contains of the characteristic transition from Eu3+ and Tb3+ ions. With the increasing of the mass ratio of NaCl, the intensity of the emission band increased and researched the maximum at 1:3, and then decreased. It is due to the different crystal structure.
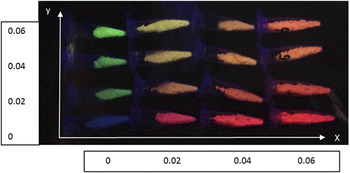
Figure 9 show the luminescence images of the samples with the different doping ratio of NaY(1−x−y)(WO4)2:xEu3+,yTb3+ according to Table I, it was excited under the 254 nm UV excitation. From the photograph we can find the color of the as-prepared samples that can be tuned by adjusting the doping concentration of Eu3+ and Tb3+ ions. Without doping with Eu3+ ions (x = 0), the sample show green emission from the Tb3+ ions, and without doping with Tb3+ (y = 0), it shows red emission from Eu3+ ions. By adjusting the doping ratio of x and y value, the color can be tuned from red, orange, yellow to green gradually. The result indicates that the NYW host is an excellent host for phosphors. When the stoichiometric ratio of (x, y) is (0.02, 0.02), the sample shows yellow emission. And usually the yellow emission phosphor mixed with blue light can merge to white light. So it has potential application value in WLED. And in our work, we choose this molar ratio as a standard ratio to explore different reaction condition on its luminescent performance.
Photograph of phosphors NaY(1−x−y) (WO4)2:Eu3+ x ,Tb3+ y with different ratio under the 254 nm UV excitation.

Ratio of NaY(1−x−y) (WO4)2:Eu3+ x ,Tb3+ y .

V. CONCLUSION
In summary, nearly monodisperse color-tunable sodium yttrium double tungstate NaY(WO4)2:Eu3+,Tb3+ phosphors were synthesized by molten salt synthesis at 700–900 °C for 4 h in the presence of NaCl with the mass ratio of 1:1. The addition of the flux NaCl plays an important role in the formation of NaY(WO4)2:Eu3+,Tb3+ phosphors. The as-obtained NaY(WO4)2:Eu3+,Tb3+ phosphors show strong red/green emission under UV excitation. Moreover, when codoping with Eu3+ and Tb3+ ions in an appropriate ratio, the PL emission colors of the NaY(WO4)2:Eu3+,Tb3+ phosphors can be tuned from red, orange, yellow, and green-yellow to green. When the stoichiometric ratio of (x, y) is (0.02, 0.02), the sample shows yellow emission. And usually the yellow emission phosphor mixed with blue light can merge to white light. So it has potential application value in WLED.
ACKNOWLEDGMENT
The authors gratefully acknowledge the financial supported by the National Natural Science Foundation of China (Grant No. 21301115), the Shanghai University Innovation fund (Grants sdcx2012005) and Shanghai Young University Teachers’ Training Subsidy Scheme (No. ZZSD12025). The authors express their thanks to the Shanghai Committee of Science and Technology, China (No. 14520500300).