Introduction
Late life depression (LLD) can be a significant healthcare risk for older adults and a major cause of disability (Crocco et al., Reference Crocco, Castro and Loewenstein2010).
To date, several morphometric analyses measured the gray matter volume or the thickness difference in LLD using manually delineating region-of-interest (ROI) methods, voxel-based morphometry (VBM), and the cortical thickness analysis (Lim et al., Reference Lim2012). Although they suggested that patients with LLD showed gray matter morphological abnormalities in the fronto–tempro–striatal structures compared with the healthy controls, they did not explain interactions and relationships between the gray matter structures (Lim et al., Reference Lim2012). Indeed, several brain structures comprise large-scale networks and might have their own distinctive interaction patterns. The previous studies have suggested that there are coordinated variations in brain morphology (e.g. volume and thickness of gray matter) between regions of functionally or anatomically connected systems, such as the frontoparietal, frontotemporal, and visual systems and symmetrically interhemispheric regions (He et al., Reference He, Chen and Evans2008).
Recently, graph theoretical analyses have been introduced to understand the large-scale network structures such as brain, Internet, and social structure of human beings (Sporns, Reference Sporns2011). In these analyses, human brain structural networks have small-world characteristics with dense local clustering of connections between neighboring nodes with short path length between any pair of nodes (Bassett and Bullmore, Reference Bassett and Bullmore2006). Small-world topology is an effective model for brain network organization because it could support both segregated and distributed information processing (Sporns and Zwi, Reference Sporns and Zwi2004), confer resilience against pathological attack (Achard et al., Reference Achard, Salvador, Whitcher, Suckling and Bullmore2006), and minimize wiring costs (Achard and Bullmore, Reference Achard and Bullmore2007).
Since small-world characteristics were described quantitatively for brain structural networks, there have been multiple graph-theoretical studies seeking to assess structural correlation networks constructed from regional gray matter volume, cortical thickness, and surface area (Bassett and Bullmore, Reference Bassett and Bullmore2006; Chen et al., Reference Chen, He, Rosa Neto, Germann and Evans2008; Hosseini et al., Reference Hosseini, Hoeft and Kesler2012). Recent graph-theoretical studies have illustrated an alteration of arrangements in structural correlation networks associated with Alzheimer's disease, schizophrenia, acute lymphoblastic leukemia, and epilepsy (Bassett et al., Reference Bassett, Bullmore, Verchinski, Mattay, Weinberger and Meyer Lindenberg2008; He et al., Reference He, Chen and Evans2008; Bernhardt et al., Reference Bernhardt, Chen, He, Evans and Bernasconi2011; Hosseini et al., Reference Hosseini, Hoeft and Kesler2012). In addition, the structural network based on cortical thickness and gray matter volumes was known to closely resemble the direct anatomical connection data by tract tracing, and reflect the precise coordination of cortical morphology in the brain (He et al., Reference He, Chen and Evans2008; Bernhardt et al., Reference Bernhardt, Chen, He, Evans and Bernasconi2011).
No prior published study has investigated the structural network properties of major depressive disorder.
The aim of this study is to construct structural cortical networks using average gray matter volumes of several ROI areas to investigate the characteristics of the gray matter structural networks in controls and LLD patients. We hypothesized that structural network characteristics, such as small worldness, clustering coefficients, and hub structures, of LLD patients might be different from those of controls.
Methods
Study participants
In this study, 37 patients with a lifetime diagnosis of a major depressive disorder were included. They were recruited through the outpatient psychogeriatric clinic of St Vincent Hospital located at Suwon, South Korea from October 2009 to October 2010. The inclusion criteria of the patient group were as follows: (1) Patients aged more than 60 years; (2) DSM-IV-TR diagnosis of major depressive disorder established with the Mini-International Neuropsychiatric Interview (MINI; Sheehan et al., Reference Sheehan1998); (3) the first episode of major depression after the age of 60 years; (4) total score of more than 10 on the 17-item Hamilton Depression Rating Scale (HAM-D17; Hamilton, Reference Hamilton1967); (5) the Korean version of the Mini-Mental State Examination (MMSE) score of >26 (Park and Kwon, Reference Park and Kwon1990); and (6) Global Clinical Dementia Rating (CDR) score of 0 (Morris, Reference Morris1993). The exclusion criteria for the patient group were as follows: (1) Patients with a presumptive diagnosis of dementia and other neurological or medical conditions that diminish the cognitive function (e.g. hypothyroidism); (2) history of other psychiatric disorders (e.g. schizophrenia, delusional disorder, substance abuse); (3) unstable medical conditions (e.g. poorly controlled hypertension, angina, or diabetes); and (4) any clinically relevant abnormal electrocardiograms or laboratory findings or brain magnetic resonance imaging (MRI) findings (e.g. serious deep white matter hyper intensities, lacuna infarction, or brain tumors). Patients were screened with a self-report health questionnaire that reviewed both demographic data and medical history. Through advertisement in a local newspaper, 40 healthy control participants were recruited within the community. Control participants were matched with the patients for age, handedness, and level of education. Exclusion criteria were similar to the patient group, with addition or exclusion of those with any current or past Axis I psychiatric diagnosis as established by the MINI and use of medication. A clinical neuroradiologist (Won Sang Jung) examined the brain MRIs of all the participants; no gross abnormalities were reported in any participant and showed normal-appearing white matter (Huang et al., Reference Huang, Friedland and Auchus2007). All participants were right-handed and non-smokers with no history of smoking.
MRI data acquisition and pre-processing
All participants underwent MRI scans on a 3-Tesla whole body scanner equipped with an 8-channel phased-array head coil (Verio, Siemens, Erlangen, Germany). The scanning parameters of the T1-weighted three-dimensional magnetization-prepared rapid gradient-echo (3D-MPRAGE) sequences were as follows: TE = 2.5 ms; TR = 1900 ms; inversion time (TI) = 900 ms; flip angle (FA) = 91; FOV = 250 × 250 mm; matrix = 256 × 256; and voxel size = 1.0 × 1.0 × 1.0 mm3. The image pre-processing and analysis steps were done in SPM8 (Wellcome Trust Centre for Neuroimaging, London, UK; http://www.fil.ion.ucl.ac.uk/spm) using the VBM8 toolbox (http://dbm.neuro.uni-jena.de/vbm). We utilized the optimized VBM process (Good et al., Reference Good, Johnsrude, Ashburner, Henson, Friston and Frackowiak2001), which included (1) segmentation and extraction of the brain in native space, (2) normalization of the images to a Montreal Neurological Institute (MNI) standard space, (3) segmentation and extraction of the normalized brain (extraction is repeated to ensure that no non-brain tissues remain), (4) modulation of normalized images to correct for tissue volume differences due to normalization procedure, and (5) sample homogeneity was checked to identify any outliers in the study population.
Ninety cortical and subcortical ROIs, excluding the cerebellum, were chosen from the Automated Anatomical Labeling (AAL) atlas using the WFU PickAtlas Toolbox (Tzourio Mazoyer et al., Reference Tzourio Mazoyer2002). These AAL ROIs were re-sliced to the same dimension as that of the segmented gray matter images from the VBM pre-processing step. The ROIs were subsequently used to mask the individual modulated, normalized gray matter images and extract the average volume within each ROI using the REX toolbox (http://web.mit.edu/swg/software.htm).
Network analysis
Network construction
In the present study, the nodes were defined as the 90 AAL ROIs extracted by REX toolbox, and the edges as the Pearson correlation coefficients between ROIs. The interregional cortical networks were then calculated to construct correlation matrices (90 × 90) for the control and LLD groups. The effects of age, gender, education, and total brain volume were regressed out. Binary adjacency matrices were then derived by thresholding association matrices at a range of densities. The lower bound of the range was determined as the minimum density in which the networks of both groups are not fragmented. The upper bound of the range of 0.5 was determined according to the previous result, revealing that anatomical network connections became less biological above this bound (Kaiser and Hilgetag, Reference Kaiser and Hilgetag2006).
Global network measures
In order to investigate the global network topology of both groups, we calculated the clustering coefficient (C) and the characteristic path length (L) of the network (Sporns and Zwi, Reference Sporns and Zwi2004). The clustering coefficient of a node is a measure of the number of edges that exist between its nearest neighbors (Rubinov and Sporns, Reference Rubinov and Sporns2010). The clustering coefficient of a network is thus the average of clustering coefficients across nodes and is a measure of network segregation (Rubinov and Sporns, Reference Rubinov and Sporns2010). The clustering coefficient and the characteristic path length of both networks were compared with the corresponding mean values of a random graph with the same number of nodes, total edges, and degree distribution as the network of interest (Maslov and Sneppen, Reference Maslov and Sneppen2002). The small-world index of a network was then calculated as (C/Crand)/(L/Lrand), where Crand and Lrand are the mean clustering coefficient and the characteristic path length of the random network (Bassett and Bullmore, Reference Bassett and Bullmore2006). In a small-world network, the clustering coefficient is significantly higher than that of random networks (C/Crand ratio > 1), while the characteristic path length is comparable to random networks (L/Lrand ratio ≈1; Hosseini et al., Reference Hosseini, Hoeft and Kesler2012).
Regional network measures
We also investigated the nodal characteristics of the constructed structural networks to identify differences in regional network measures between-groups. Nodal betweenness centrality and nodal degree were calculated for each of the anatomical ROIs for the networks thresholded at minimum density with full connectivity. Nodal betweenness centrality is defined as the fraction of all shortest paths in the network that pass through a given node, and is used to detect important anatomical or functional connections (Sporns, Reference Sporns2011). Nodes that bridge disparate parts of the network have a high betweenness centrality (Rubinov and Sporns, Reference Rubinov and Sporns2010).
Network hubs
In a network analysis, a hub is defined as a node that has a degree larger than the average degree. Hubs are usually considered as important regulators of efficient information flow in brain (Rubinov and Sporns, Reference Rubinov and Sporns2010). In this study, a node was set as a hub if its betweenness centrality was at least two standard deviations (SD) higher than mean network centrality (Bassett et al., Reference Bassett, Bullmore, Verchinski, Mattay, Weinberger and Meyer Lindenberg2008; Hosseini et al., Reference Hosseini, Hoeft and Kesler2012).
Statistical analysis
For comparing network topology and regional network measures, we used the Graph Analysis Toolbox (GAT, http://nnl.stanford.edu/tools.html), which was validated in the previous study (Hosseini et al., Reference Hosseini, Hoeft and Kesler2012). We also used the statistical analysis methods introduced in the study by Hosseini et al. (Reference Hosseini, Hoeft and Kesler2012). Briefly, in order to test the statistical significance of between-group differences in network topology and regional network measures, a non-parametric permutation test with 1,000 repetitions was used (Bassett et al., Reference Bassett, Bullmore, Verchinski, Mattay, Weinberger and Meyer Lindenberg2008). In each repetition, the calculated residual volumes of each participant were randomly reassigned to one of the two groups so that each randomized group had the same number of participants as the original groups. Then an association matrix was obtained for each randomized group. The binary adjacency matrices were then estimated by thresholding the association matrices at a range of network densities. The network measures were then calculated for all the networks at each density. Differences in network measures between randomized groups were then calculated, resulting in a permutation distribution of difference under null hypothesis. The actual between-group difference in network measures was then placed in the corresponding permutation distribution and a two-tailed p-value was calculated on the basis of its percentile position (Bernhardt et al., Reference Bernhardt, Chen, He, Evans and Bernasconi2011; Hosseini et al., Reference Hosseini, Hoeft and Kesler2012).
Results
Baseline demographic data
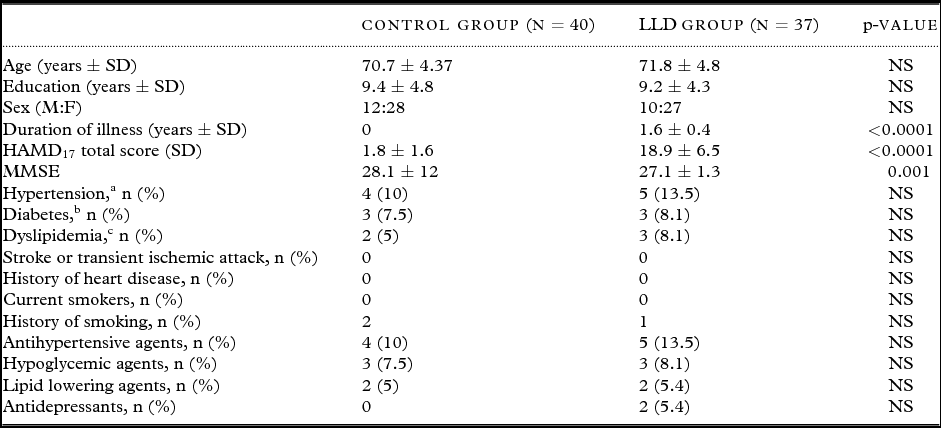
Table 1 shows the baseline demographic data in our different participant groups. There was no significant difference in sex, age, and education between LLD group and control groups. In addition, the degree and frequencies of vascular risk factors, such as hypertension, dyslipidemia, diabetes, obesity, and stroke, were not significantly different between the two groups.
Demographic and clinical characteristics of study participants

Notes: LLD = late life depression, NS = statistically not significant HAM-D17 = 17-item Hamilton Depression Rating Scale, MMSE = Mini-Mental State Examination.
aHypertension defined according to the Seventh Report of the Joint National Committee on Prevention, Detection, Evaluation, and Treatment of High Blood Pressure (JNC 7; Chobanian et al., Reference Chobanian2003).
bDiabetes mellitus defined according to International Diabetes Federation Epidemiology Task Force Consensus Group (Alberti et al., Reference Alberti, Zimmet and Shaw2005).
cDyslipidemia defined according to Revised The National Cholesterol Education Program Adult Treatment Panel III Revised criteria (NCEP ATP III; Grundy et al., Reference Grundy2005).
Global topology of gray matter structural networks
Figure 1 shows the inter-regional correlation matrix of both the groups. As shown in Figure 2, the normalized clustering coefficients (C/Crand ratio) of both groups was greater than 1 across a wide range of densities. In addition, the normalized path length (L/Lrand ratio) of both groups was close to 1. Thus, both LLD and control groups showed a small-world organization of group networks across a wide range of density.
The inter-regional correlations matrix in the control (CON) group and the late life depression (LLD) group. The color bar indicates the value of the correlation coefficient, r. AMYG = amygdala, ANG = angular gyrus, CALC = calcarine fissure, CN = caudate nucleus, ACC = anterior cingulate, MCC = mid-cingulate, PCC = posterior cingulate, CUN = cuneus, IFOp = inferior frontal gyrus, opercular part, IFOr = inferior frontal gyrus, orbital part, IFTr = inferior frontal gyrus, triangular part, MedFOr = medial frontal gyrus, orbital part, MFG = middle frontal gyrus, MFOr = middle frontal gyrus, orbital part, SFG = superior frontal gyrus, MedSF = superior frontal gyrus, medial part, SFOr = superior frontal gyrus, orbital part, FG = fusiform gyrus, HSHL = heschl gyrus, HIPP = hippocampus, INS = insula, LNG = lingual gyrus, IOG = inferior occipital gyrus, MOG = middle occipital gyrus, SOG = superior occipital gyrus, OFB = olfactory cortex, PLD = lenticular nucleus, pallidum, PCL = paracentral lobule, PHIP = parahippocampal gyrus, IPL = inferior parietal lobule, SPL = superior parietal lobule, PoCG = postcentral gyrus, PrCG = precentral gyrus, PCUN = precuneus, PUT = putamen, REC = gyrus rectus, RLN = rolandic operculum, SMA = supplementary motor area, SMG = supramarginal gyrus, ITG = inferior temporal gyrus, MTG = middle temporal gyrus, MTP = middle temporal pole, STP = superior temporal pole, STG = superior temporal gyrus, THL = thalamus.
Changes in global network measures as a function of network density in the control group and the LLD group.
Group analysis on global network measures
In order to investigate changes in the network topology as a function of network density, we thresholded the constructed association matrices at a range of network densities (0.21< density <0.5). The results of comparison of the two networks as a function of network density are shown in Figure 3. There was no significant difference in network characteristic path lengths (p = 0.12), clustering coefficient (p = 0.73), or small worldness (p = 0.91) between groups across a range of densities.
Between-group differences in global network measures as a function of network density. The graph shows differences (red dots) in normalized clustering coefficients, path length, and small-world index between controls and LLD patients as a function of density thresholds. The blue lines represent the mean values (x dots) and 95% confidence intervals of between-group differences obtained in 1,000 permutation tests at each density.
Group analyses on regional network measures
The regions with significant differences in nodal betweenness in the LLD group relative to the control group are shown in Figure 4. Compared with the control group, the LLD group demonstrates lower nodal betweenness in the left angular, the left superior orbitofrontal gyrus, and the right medial orbitofrontal gyrus (p < 0.05, False Discovery Rate (FDR) corrected). In addition, the control group shows lower nodal betweenness in the right putamen and superior temporal gyrus compared with the LLD group (p < 0.05, FDR corrected).
Between-group differences in regional network topology. Regions that showed significant between-group differences in nodal betweenness mapped on ICBM152 surface template. Hot color indicates the regions that have significantly higher nodal betweenness in the control group compared with the LLD group, while cold color identifies regions with significantly higher nodal betweenness in the LLD group compared with the control group. AMYG = amygdala, ANG = angular gyrus, CALC = calcarine fissure, CN = caudate nucleus, ACC = anterior cingulate, MCC = mid-cingulate, PCC = posterior cingulate, CUN = cuneus, IFOp = inferior frontal gyrus, opercular part, IFOr = inferior frontal gyrus, orbital part, IFTr = inferior frontal gyrus, triangular part, MedFOr = medial frontal gyrus, orbital part, MFG = middle frontal gyrus, MFOr = middle frontal gyrus, orbital part, SFG = superior frontal gyrus, MedSF = superior frontal gyrus, medial part, SFOr = superior frontal gyrus, orbital part, FG = fusiform gyrus, HSHL = heschl gyrus, HIPP = hippocampus, INS = insula, LNG = lingual gyrus, IOG = inferior occipital gyrus, MOG = middle occipital gyrus, SOG = superior occipital gyrus, OFB = olfactory cortex, PLD = lenticular nucleus, pallidum, PCL = paracentral lobule, PHIP = parahippocampal gyrus, IPL = inferior parietal lobule, SPL = superior parietal lobule, PoCG = postcentral gyrus, PrCG = precentral gyrus, PCUN = precuneus, PUT = putamen, REC = gyrus rectus, RLN = rolandic operculum, SMA = supplementary motor area, SMG = supramarginal gyrus, ITG = inferior temporal gyrus, MTG = middle temporal gyrus, MTP = middle temporal pole, STP = superior temporal pole, STG = superior temporal gyrus, THL = thalamus.
Network hubs
In the control group, network hubs were identified in the left middle cingulate, right cuneus, and right medial orbitofrontal gyrus on the basis of nodal betweenness. In the LLD group, hubs were found in the right middle cingulate, right putamen, and right superior temporal gyrus (Figure 5).
Network hubs based on nodal betweenness in the control and LLD groups. Gray lines indicate connections (edge), and spheres represent regions (node). The radius of the spheres is proportional to the nodal betweenness. Hubs are shown in red color in the control group, purple color in the LLD group. MidCING = middle cingulate gyrus, MedOFC = medial orbitofrontal cortex, and Sup.Temp = superior temporal cortex.
Discussion
This is the first study to explore gray matter structural network pattern of LLD. In this study, we showed that (1) both networks of LLD and controls followed the small-world structure, (2) there were no significant differences between groups in the global network topologies, (3) significant differences in the regional network characteristics were found in the frontal–temporal–striatal areas, and (4) different hubs were found in LLD versus control based on nodal betweenness.
To date, several studies have highlighted morphological abnormalities of frontal–striatal–temporal–parietal areas in LLD (Butters et al., Reference Butters2008). Therefore, these structural abnormalities might result in a broad range of negative impact on mood, cognition, and globalized functioning in LLD patients. Although the widespread nature of structural damage in LLD is suggestive of a system disorder resulting in disrupted structural networks, studies based on univariate statistical morphometric comparisons can only indirectly test such hypotheses. Indeed, as compared with major depressive disorder in young adults, various pathophysiological processes, such as vascular risk factors and amyloid deposition, are involved in LLD (Butters et al., Reference Butters2008). In this regards, multivariate structural analysis using the graph theory might be a more appropriate paradigm for understanding complicated neurobiological mechanism of LLD.
There have been several structural/functional network models proposed in the analysis of human brain networks (Rubinov and Sporns, Reference Rubinov and Sporns2010; Sporns, Reference Sporns2011). Among them, structural brain connectivity represents structural associations among different neuronal elements, which includes both morphometric correlation and true anatomical connectivity. Diffusion tensor imaging (DTI) tractography has allowed in vivo study of structural networks at a macroscopic level (Gong et al., Reference Gong2009; Hagmann et al., Reference Hagmann2008). However, as water diffusion in the vicinity of cortical regions is generally highly isotropic, the connectivity studies by DTI tractography have limited validity in mapping cortico-cortical networks in the human brain (Bernhardt et al., Reference Bernhardt, Chen, He, Evans and Bernasconi2011). Therefore, correlation analysis of structural MRI data has been proposed as an alternative framework to study structural networks (Bassett et al., Reference Bassett, Bullmore, Verchinski, Mattay, Weinberger and Meyer Lindenberg2008; Bernhardt et al., Reference Bernhardt, Chen, He, Evans and Bernasconi2011; He et al., Reference He, Chen and Evans2007; Lerch et al., Reference Lerch2006). This approach rests on the assumption that positive correlations indicate connectivity, as axonally connected regions are believed to have common trophic, developmental, and maturational influences (Zhang and Sejnowski, Reference Zhang and Sejnowski2000). Morphometric correlations of cortical thickness data have successfully mapped structural networks that closely resembled tract-tracing data (Bernhardt et al., Reference Bernhardt2008; Lerch et al., Reference Lerch2006; Mitelman et al., Reference Mitelman, Buchsbaum, Brickman and Shihabuddin2005).
In this study, both gray matter structural networks showed small-world topology, which was in line with the previous study on normal controls, Alzheimer's disease, schizophrenia, mild cognitive impairment (MCI), and acute lymphoblastic leukemia (Bassett et al., Reference Bassett, Bullmore, Verchinski, Mattay, Weinberger and Meyer Lindenberg2008; He et al., Reference He, Chen and Evans2007; Hosseini et al., Reference Hosseini, Hoeft and Kesler2012; Yao et al., Reference Yao, Zhang, Lin, Zhou, Xu and Jiang2010).
The small-world network is characterized by dense local clustering or cliquishness of connections between neighboring nodes, yet a short path length between any pair of nodes (Bassett and Bullmore, Reference Bassett and Bullmore2006). This is an attractive model for the organization of brain anatomical and functional networks because a small-world topology can support both segregated/specialized and distributed/integrated information processing. As previous studies have reported reduced gray matter volumes in the frontal–striatal–temporal areas in LLD, we hypothesized that small worldness of LLD would be significantly changed compared with controls. However, there was no significant difference in the normalized clustering coefficient, the normalized path length, and the small-world index over a wide range of network density between LLD and control groups. This result was in accordance with the previous gray matter structural network study on mild cognitive impairment and Alzheimer's disease (Yao et al., Reference Yao, Zhang, Lin, Zhou, Xu and Jiang2010). They found no significant difference in small-world characteristics between controls and mild cognitive impairment patients. They suggested that these might be due to non-significant global gray matter volume difference between mild cognitive impairment and control groups. In this regard, our results suggest that gray matter structural change in LLD might not be associated with global but regional neurobiological injury to structural network. However, these should be interpreted with caution because there are varieties of disease spectrum in LLD (Butters et al., Reference Butters2008; Lim et al., Reference Lim2012).
In this study, we observed that the regional nodal betweenness of LLD group were decreased significantly in the medial orbitofrontal gyrus and the angular gyrus, and increased in the superior temporal and putamen area compared with controls. A node with high betweenness can control information flow because it is at the intersection of many short paths (Sporns, Reference Sporns2011). In addition, a node with high betweenness in a structural network has the potential to participate in a large number of functional interactions (Sporns, Reference Sporns2011). The orbitofrontal cortex dysfunction may yield the characteristic state of depression, which shows impaired ability to interrupt perseverative melancholic thoughts and anxious responses to ordinarily non-threatening stimuli (Ballmaier et al., Reference Ballmaier2004; Ongr and Price, Reference Ongr and Price2000). Although there are no much evidences of angular gyrus dysfunction in major depressive disorder, angular gyrus was known to be involved in various cognitive and behavioral processes, including semantic processing, word reading and comprehension, number processing, default mode network, memory retrieval, attention and spatial cognition, reasoning, and social cognition (Seghier, Reference Seghier2013). More specifically, the angular gyrus emerges as a cross-modal hub where converging multi-sensory information is combined and integrated to comprehend and give sense to events, manipulate mental representations, solve familiar problems, and reorient attention to relevant information (Seghier, Reference Seghier2013).
The hub regions of the gray matter structural network that we identified in the control group (the middle cingulate gyrus, the medial orbitofrontal gyrus, and the cuneus) were compatible with those found in previous studies of functional and structural cortical networks (Hagmann et al., Reference Hagmann2008; Sporns, Reference Sporns2011). Although there has been no previous study on the hub structure of LLD, altered location of hub regions of the LLD group (the middle cingulate gyrus, the superior temporal gyrus, and the putamen) might be related to the decreased regional nodal betweenness of these regions in the LLD group compared with the control group. Moreover, these phenomena could be explained by the concept of “degeneracy of system” (Edelman and Gally, Reference Edelman and Gally2001; Tononi et al., Reference Tononi, Sporns and Edelman1999). According to this concept, degeneracy is the capacity of a system to perform an identical function with structurally different set of elements. Thus, a degenerate system can deliver constant performance or output when some of its structural elements are altered, compromised, or disconnected. Sporns (Reference Sporns2011) suggested that communication patterns in degenerated network could occur along many alternative path of equivalent length, a property that protects the network from becoming disconnected if nodes or edges are disconnected.
The limitations of our study are as follows. First, we could not control the medication status of the patients. Indeed, there have been some suggestions that antidepressants may exert a neurotrophic effect on particular regions of the brain (Duman and Monteggia, Reference Duman and Monteggia2006). Furthermore, in geriatric patients with depression, antidepressant exposure was associated with larger orbitofrontal gray matter volume as compared with medication-naive patients (Lavretsky et al., Reference Lavretsky, Roybal, Ballmaier, Toga and Kumar2005). Therefore, further analysis with drug naïve patients with LLD would be needed for investigating the precise change of structural network of LLD. Second, the participants included in this study were elderly people. Therefore, we should not generalize these results to young adults with major depression. Third, compared with the anatomical connectivity obtained by DTI tractography, the method we used in this study only measures the anatomical connectivity indirectly. Moreover, these results should not be generalized to functional network change in LLD. Therefore, comparative analyses using DTI and functional MRI would help to clarify the comprehensive structural and functional network changes in LLD. Finally, VBM method used in this study provides a mixed measure of the cortical gray matter, including the cortical surface area or the cortical folding as well as the cortical thickness (Hutton et al., Reference Hutton, Draganski, Ashburner and Weiskopf2009). Therefore other morphological measurements selectively reflecting gray matter atrophy (e.g. cortical thickness) would be needed for investigating more precise changes of gray matter networks.
In conclusion, we did not find global network topological differences but altered frontal–parietal gray matter network structures in LLD. These changes would provide a comprehensive view on the reorganization of large-scale interregional structural networks in LLD.
Conflict of interest
The authors declare no conflict of interest.
Description of authors’ roles
Hyun Kook Lim and Howard J Aizenstein conceived and designed the experiments, analyzed the data, and contributed reagents/materials/analysis tools. Hyun Kook Lim and Won Sang Jung performed the experiments. Finally, Hyun Kook Lim, Howard J Aizenstein, and Won Sang Jung wrote the paper.
Acknowledgments
This research was supported by Basic Science Research Program through the National Research Foundation of Korea (NRF) funded by the Ministry of Education, Science and Technology (2012R1A1A2042339).