


%20--%3e%3c!DOCTYPE%20svg%20PUBLIC%20'-//W3C//DTD%20SVG%201.0//EN'%20'http://www.w3.org/TR/2001/REC-SVG-20010904/DTD/svg10.dtd'%3e%3csvg%20version='1.0'%20id='Layer_1'%20xmlns='http://www.w3.org/2000/svg'%20xmlns:xlink='http://www.w3.org/1999/xlink'%20x='0px'%20y='0px'%20width='64px'%20height='64px'%20viewBox='5.5%20-3.5%2064%2064'%20enable-background='new%205.5%20-3.5%2064%2064'%20xml:space='preserve'%3e%3cg%3e%3ccircle%20fill='%23FFFFFF'%20fill-opacity='0'%20cx='37.785'%20cy='28.501'%20r='28.836'/%3e%3cpath%20fill='%23595959'%20d='M37.441-3.5c8.951,0,16.572,3.125,22.857,9.372c3.008,3.009,5.295,6.448,6.857,10.314%20c1.561,3.867,2.344,7.971,2.344,12.314c0,4.381-0.773,8.486-2.314,12.313c-1.543,3.828-3.82,7.21-6.828,10.143%20c-3.123,3.085-6.666,5.448-10.629,7.086c-3.961,1.638-8.057,2.457-12.285,2.457s-8.276-0.808-12.143-2.429%20c-3.866-1.618-7.333-3.961-10.4-7.027c-3.067-3.066-5.4-6.524-7-10.372S5.5,32.767,5.5,28.5c0-4.229,0.809-8.295,2.428-12.2%20c1.619-3.905,3.972-7.4,7.057-10.486C21.08-0.394,28.565-3.5,37.441-3.5z%20M37.557,2.272c-7.314,0-13.467,2.553-18.458,7.657%20c-2.515,2.553-4.448,5.419-5.8,8.6c-1.354,3.181-2.029,6.505-2.029,9.972c0,3.429,0.675,6.734,2.029,9.913%20c1.353,3.183,3.285,6.021,5.8,8.516c2.514,2.496,5.351,4.399,8.515,5.715c3.161,1.314,6.476,1.971,9.943,1.971%20c3.428,0,6.75-0.665,9.973-1.999c3.219-1.335,6.121-3.257,8.713-5.771c4.99-4.876,7.484-10.99,7.484-18.344%20c0-3.543-0.648-6.895-1.943-10.057c-1.293-3.162-3.18-5.98-5.654-8.458C50.984,4.844,44.795,2.272,37.557,2.272z%20M37.156,23.187%20l-4.287,2.229c-0.458-0.951-1.019-1.619-1.685-2c-0.667-0.38-1.286-0.571-1.858-0.571c-2.856,0-4.286,1.885-4.286,5.657%20c0,1.714,0.362,3.084,1.085,4.113c0.724,1.029,1.791,1.544,3.201,1.544c1.867,0,3.181-0.915,3.944-2.743l3.942,2%20c-0.838,1.563-2,2.791-3.486,3.686c-1.484,0.896-3.123,1.343-4.914,1.343c-2.857,0-5.163-0.875-6.915-2.629%20c-1.752-1.752-2.628-4.19-2.628-7.313c0-3.048,0.886-5.466,2.657-7.257c1.771-1.79,4.009-2.686,6.715-2.686%20C32.604,18.558,35.441,20.101,37.156,23.187z%20M55.613,23.187l-4.229,2.229c-0.457-0.951-1.02-1.619-1.686-2%20c-0.668-0.38-1.307-0.571-1.914-0.571c-2.857,0-4.287,1.885-4.287,5.657c0,1.714,0.363,3.084,1.086,4.113%20c0.723,1.029,1.789,1.544,3.201,1.544c1.865,0,3.18-0.915,3.941-2.743l4,2c-0.875,1.563-2.057,2.791-3.541,3.686%20c-1.486,0.896-3.105,1.343-4.857,1.343c-2.896,0-5.209-0.875-6.941-2.629c-1.736-1.752-2.602-4.19-2.602-7.313%20c0-3.048,0.885-5.466,2.658-7.257c1.77-1.79,4.008-2.686,6.713-2.686C51.117,18.558,53.938,20.101,55.613,23.187z'/%3e%3c/g%3e%3c/svg%3e)
%20--%3e%3c!DOCTYPE%20svg%20PUBLIC%20'-//W3C//DTD%20SVG%201.0//EN'%20'http://www.w3.org/TR/2001/REC-SVG-20010904/DTD/svg10.dtd'%3e%3csvg%20version='1.0'%20id='Layer_1'%20xmlns='http://www.w3.org/2000/svg'%20xmlns:xlink='http://www.w3.org/1999/xlink'%20x='0px'%20y='0px'%20width='64px'%20height='64px'%20viewBox='5.5%20-3.5%2064%2064'%20enable-background='new%205.5%20-3.5%2064%2064'%20xml:space='preserve'%3e%3cg%3e%3ccircle%20fill='%23FFFFFF'%20fill-opacity='0'%20cx='37.637'%20cy='28.806'%20r='28.276'/%3e%3cg%3e%3cpath%20fill='%23595959'%20d='M37.443-3.5c8.988,0,16.57,3.085,22.742,9.257C66.393,11.967,69.5,19.548,69.5,28.5c0,8.991-3.049,16.476-9.145,22.456%20C53.879,57.319,46.242,60.5,37.443,60.5c-8.649,0-16.153-3.144-22.514-9.43C8.644,44.784,5.5,37.262,5.5,28.5%20c0-8.761,3.144-16.342,9.429-22.742C21.101-0.415,28.604-3.5,37.443-3.5z%20M37.557,2.272c-7.276,0-13.428,2.553-18.457,7.657%20c-5.22,5.334-7.829,11.525-7.829,18.572c0,7.086,2.59,13.22,7.77,18.398c5.181,5.182,11.352,7.771,18.514,7.771%20c7.123,0,13.334-2.607,18.629-7.828c5.029-4.838,7.543-10.952,7.543-18.343c0-7.276-2.553-13.465-7.656-18.571%20C50.967,4.824,44.795,2.272,37.557,2.272z%20M46.129,20.557v13.085h-3.656v15.542h-9.944V33.643h-3.656V20.557%20c0-0.572,0.2-1.057,0.599-1.457c0.401-0.399,0.887-0.6,1.457-0.6h13.144c0.533,0,1.01,0.2,1.428,0.6%20C45.918,19.5,46.129,19.986,46.129,20.557z%20M33.042,12.329c0-3.008,1.485-4.514,4.458-4.514s4.457,1.504,4.457,4.514%20c0,2.971-1.486,4.457-4.457,4.457S33.042,15.3,33.042,12.329z'/%3e%3c/g%3e%3c/g%3e%3c/svg%3e)
1. Introduction
Fertilizer recommendations from land grant institutions vary considerably across states, prompting interest in either harmonizing or explaining the differences (Bourns et al., Reference Bourns, Buol, Spargo, Gatiboni, Yost, Slaton and Osmond2025; Lyons et al., Reference Lyons, Osmond, Slaton, Spargo, Kleinman, Arthur and McGrath2020). One of the keys to determining the optimal fertilizer rate is to determine how much of it will carry over to the next year, either from applied fertilizer or the soil stock of nutrients (Dhakal and Lange, Reference Dhakal and Lange2021; Harmon et al., Reference Harmon, Boyer, Lambert and Larson2017; Kennedy et al., Reference Kennedy, Whan, Jackson and Dillon1973).
Nitrogen (N) is a mobile nutrient with a low carryover rate, so fertilizer-N is typically applied based on target yields (Raun and Johnson, Reference Raun and Johnson1999) or using a regional rate (Nafziger et al., Reference Nafziger, Sawyer, Laboski and Franzen2022). In contrast, phosphorus (P) and potassium (K) are relatively immobile nutrients with fewer loss pathways than N. Although few studies have estimated carryover functions, it is generally acknowledged that P tends to have a high carryover rate, while the carryover rate of K ranges between that of N and P. One of the difficulties in studying K carryover is that K is present in soils in four different forms (Martin and Sparks, Reference Martin and Sparks1985; Moody and Bell, Reference Moody and Bell2006; Potash Development Association, 2019). Solution K (0.1–0.2% of total K) is immediately available for crop uptake. Exchangeable K (1–2% of total K) replenishes the soil solution K and is commonly measured by routine soil tests. Non-exchangeable K (2–10%) slowly replenishes the exchangeable K pool. Primary minerals (90–98%) are unavailable for crop uptake (Bell et al., Reference Bell, Ransom, Thompson, Hinsinger, Florence, Moody, Guppy, Bell, Ransom, Thompson, Hinsinger, Florence, Moody and Guppy2021). Soil test K (STK) is a laboratory measurement of exchangeable K. STK can vary during a season because the movement between the solution, exchangeable, and non-exchangeable pools is influenced by soil moisture, crop residue, and other conditions (Kaiser and Rosen, Reference Kaiser and Rosen2018; Mallarino et al., Reference Mallarino, Clover and Oltmans2011).
K losses beyond crop uptake and removal include, but are not limited to, leaching, runoff, and fixation of exchangeable K to non-exchangeable K – an unmeasured soil reserve. From an economic standpoint, greater fertilizer-K carryover is roughly equivalent to reducing the price of K by the present value of the carryover K since the need to apply fertilizer-K the next year is reduced. A high fertilizer-K carryover would favor a build-and-maintain approach much like what has historically been used for P (Cho et al., Reference Cho, Brorsen and Arnall2024). At the same time, a low fertilizer-K carryover rate could lead to K management guidelines more closely resembling those for mobile nutrients like N. For example, while Popp et al. (Reference Popp, Slaton, Norsworthy and Dixon2021) consider available STK in making fertilizer-K recommendations, they ignore the stock value of STK by estimating short-run profit-maximizing fertilizer-K application rates, essentially assuming low K carryover. Oliver et al. (Reference Oliver, Popp, Fang, Anderson, Slaton, Drescher, Roberts and Thompson2023) lend support to the notion of low fertilizer-K carryover as the analysis of a long-term, flood-irrigated rice (Oryza sativa L.) and soybean (Glycine Max L. Merr.) crop rotation indicated that continuously applying only the short-term profit-maximizing amount of fertilizer-K needed by the crop can remain profitable even in the long term without building STK.
The objective of this study is to guide how to consider K carryover when making fertilizer-K rate recommendations to producers. A major step in accomplishing this objective is to estimate a summary K carryover function. This is accomplished with a meta-analysis that includes estimates from past studies as well as new estimates using data from USDA Ag Data Commons. We discuss the dynamic programming solution in the context of optimal fertilizer-K rate recommendations from past literature. We show that under appropriate assumptions, the dynamic programming solution can be obtained by adjusting the fertilizer-K price to make a single-period optimization consistent with accounting for stock value of K. Because STK is such a noisy measure, we employ a Monte Carlo study to demonstrate that small sample bias and measurement error cannot account for the wide variation in carryover coefficients that we observe. Finally, we use an example employing the theoretical underpinnings developed above with data from a rainfed Bermudagrass fertilizer-K rate trial to demonstrate financial losses from not considering carryover in fertilizer-K recommendations. The estimates are inexact due to the large variation in estimated carryover coefficients as well as insufficient research to estimate when or if the applied fertilizer-K that becomes nonexchangeable will become exchangeable.
2. Methods and data
2.1. Defining carryover
The carryover function models the dynamics of STK. It captures the net annual increase in STK from applied fertilizer-K, the proportion of STK carried over to the next year, and the expected uptake by harvested crops (Jomini et al., Reference Jomini, Deuson, Lowenberg-DeBoer and Bationo1991; Lanzer and Paris, Reference Lanzer and Paris1981; Tré and Lowenberg-DeBoer, Reference Tré and Lowenberg-DeBoer2005; Dhakal et al., Reference Dhakal, Lange, Parajulee and Segarra2019). The function is specified as
 $STK_{it}=\alpha _{0}+\alpha _{1}\cdot STK_{it-1}+\alpha _{2}\cdot K_{it-1}+\alpha _{3}\cdot Y_{it-1}+\varepsilon _{it}$
where STK it is the STK measurement of plot i in year t, K it − 1 is the amount of fertilizer-K applied in the prior year, and Y it − 1 is the yield in the previous year t − 1 (adjusted for the crop-specific K content of the harvested biomass)Footnote 1 , and ϵ it is the random error termFootnote 2 with ϵ it ∼ N(0, σ ϵ 2).
Equation (1) has two carryover rates, but the one for applied fertilizer-K is the focus of this study. The carryover rate of STK, α 1, represented by the autoregressive coefficient of lagged STK, estimates the portion of STK that is retained for use in the following year’s STK. The carryover rate of applied fertilizer-K, α 2, is the portion of K applied that adds to the following year’s STK. Meanwhile, the coefficient on lagged yield, α 3, reflects the depletion of STK through crop uptake and removal.
2.2. Effect of carryover on optimal fertilizer-K in a dynamic programming framework
The optimal fertilizer-K rate and shadow value of carryover are derived using a dynamic programming framework that incorporates STK carryover. A profit-maximizing crop producer chooses the amount of fertilizer-K (K t ) at the beginning of each year (t = 1, …, T) to maximize the NPV of expected returns (R t ) over the planning horizon (Harmon et al., Reference Harmon, Boyer, Lambert and Larson2017; Kennedy et al., Reference Kennedy, Whan, Jackson and Dillon1973; Kennedy, Reference Kennedy1986). Our solution is more general than that of Harmon et al. (Reference Harmon, Boyer, Lambert and Larson2017) since we do not impose the same coefficients on K t and STK t . The producer’s objective function is
 $\max\nolimits_{K_{t=1\ldots T}} NPV={\sum }_{t=1}^{{\rm T}}\delta ^{t-1}\cdot R_{t}$
subject to:
 $R_{t}=p_{t}\cdot y\left(STK_{t},K_{t}\right)-r_{t}\cdot K_{t}$
 $STK_{t+1}=\alpha _{0}+\alpha _{1}\cdot STK_{t}+\alpha _{2}\cdot K_{t}+\alpha _{3}\cdot y_{t}\left(STK_{t},K_{t}\right)$
K t ≥ 0, STK 1 given, t ≤ T;
where NPV is the sum of discounted net returns ($/ha) over the planning horizon, δ is a discount factor reflecting the time value of money, 1/(1+d), where d is the discount rate, R t denotes the annual return in year t determined by the crop price, p t , the expected crop yield y(STK t , K t ) and the cost of fertilizer-K at price r t , subject to the non-negativity constraint on fertilizer use.
The first-order condition (FOC) sets the current marginal value product of K (MVP) to its marginal factor cost (MFC), incorporating the discounted value of K carryover. The envelope condition defines the value of K carryover as the discounted marginal contribution of STK to future returns.
The dynamic programming approach has not been widely adopted for Extension recommendations. While the dynamic programming problem has a simple solution, its unfamiliarity to potential users may discourage its use. We therefore use a simplified analytical solution to the dynamic programming problem that might be more appropriate for Extension recommendations. The solution is that the dynamic programming answer for the first period from Harmon et al. (Reference Harmon, Boyer, Lambert and Larson2017) can be obtained with a single-period optimization by adjusting the cost of fertilizer-K with the value of carryover of applied fertilizer-K. The carryover function is refined by decomposing the aggregated total available K into separate STK and fertilizer-K components that are adjusted for crop K uptake:
 $V_{t}(STK_{t})=\max\nolimits_{K_{t}} R_{t}+\delta \cdot V_{t+1}(STK_{t+1})$
where V t is the present value of net returns subject to the same constraints as in Equation (2).
The optimality condition for applied fertilizer-K follows from differentiating Equation (3) with respect to K t . It is specified as
 ${\partial V_{t} \over \partial K_{t}}=p_{t}\cdot {\partial y_{t} \over \partial K_{t}}-r_{t}+\delta \cdot \left(\alpha _{2}+\alpha _{3}\cdot {\partial y_{t} \over \partial K_{t}}\right)\cdot {\partial V_{t+1} \over \partial STK_{t+1}}=0$
which can be rearranged as
 $p_{t}\cdot {\partial y_{t} \over \partial K_{t}}=r_{t}-\delta \cdot \left(\alpha _{2}+\alpha _{3}\cdot {\partial y_{t} \over \partial K_{t}}\right)\cdot {\partial V_{t+1} \over \partial STK_{t+1}}$
Assuming that the optimal applied K in the next period is not zero, then
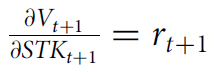 ${\partial V_{t+1} \over \partial STK_{t+1}}=r_{t+1}.$
So, with some simplification Equation (5) becomes
 $p_{t}\cdot {\partial y_{t} \over \partial K_{t}}=r_{t}-\delta \cdot \alpha _{2}\cdot r_{t+1}-\delta \cdot \alpha _{3}\cdot {\partial y_{t} \over \partial K_{t}}\cdot r_{t+1}$
The solution not considering carryover is
 $p_{t}\cdot {\partial y_{t} \over \partial K_{t}}=r_{t}$
, so Equation (6) shows that the solution is the static, single-period optimization solution with an adjustment to fertilizer cost for the amount of applied fertilizer-K carried over to the next year and an adjustment for the amount not carried over given crop removal. If we assume that the current fertilizer-K price is the same as next year’s expected price, then the solution is
 $p_{t}\cdot {\partial y_{t} \over \partial K_{t}}=r_{t}\left(1-\delta \cdot \alpha _{2}-\delta \cdot \alpha _{3}\cdot {\partial y_{t} \over \partial K_{t}}\right)$
The effective price of fertilizer-K is the right-hand side of Equation (7). Equation (7) implies that a higher carryover rate of applied fertilizer-K (α
2) lowers the effective price of fertilizer-K, which increases the optimal fertilizer-K rate. This may appear counterintuitive from an agronomic perspective, where greater carryover is often viewed as reducing fertilizer-K needs. Note that the static approach uses current STK, so it already considers reduced K needs due to carryover from last year. What the dynamic approach adds is the value of applying K this year toward reducing the need to apply K next year. For example, the current Arkansas Potash Rate Calculator’s (PRC) algorithm (University of Arkansas System Division of Agriculture, 2025) implicitly assumes zero carryover. Assuming a 6% interest rate (δ = 0.94) and 30% carryover (α
2 = 0.3) then the current algorithm could be left the same except the price of fertilizer-K would need to be reduced by 28.2% (δ ⋅ α
2 = 0.282) to account for the stock value of K. At the same time, crop K removal by yield (
 $\alpha _{3}\cdot {\partial y_{t} \over \partial K_{t}}$
) offsets part of the stock value of fertilizer-K, although the extent of this offset may vary across crops.Footnote
3
For a given soil test carried into the year, greater fertilizer-K carryover lowers the effective marginal cost of the current application and raises the optimal current fertilizer-K rate. This is a current-period effect. It does not imply that application rises without limit over time, because the fertilizer-K that carries over raises next year’s STK and reduces what has to be applied then. The steady-state consequences are derived in the subsection entitled “Steady-State Soil Test K and Fertilizer-K” below.
The constant expected price assumption assumes a random-walk model for K prices. Denbaly and Vroomen (Reference Denbaly and Vroomen1993) found that the unit root hypothesis for K prices could not be rejected, which supports the random-walk assumption. Maples and Brorsen (Reference Maples and Brorsen2022), however, argue that most cash prices have both unit root and mean-reverting components, which would imply that there could be some ability to predict next year’s K price. If a producer wants to use an expected price that differs from current price, then Equation (6) can be used instead of Equation (7).
While Equation (7) provides a simplified adjustment application, there may be cases where STK and fertilizer-K are not perfect substitutes at the margin. If the marginal value of STK differs from the fertilizer-K price,Footnote 4 the effective fertilizer-K price is
 $p_{t}\cdot {\partial y_{t} \over \partial K_{t}}=r_{t}\cdot \left(1-{\delta \cdot \alpha _{2} \over 1-\delta \cdot \left(\alpha _{1}-\alpha _{2}\right)}-{\delta \cdot \alpha _{3}\cdot \frac{\partial y_{t}}{\partial K_{t}} \over 1-\delta \cdot \left(\alpha _{1}-\alpha _{2}\right)}\right).$
2.3. Optimal fertilizer-K with carryover using a quadratic response plateau
As an example, this study assumes a quadratic response plateau (QRP) yield function (Zhang et al., Reference Zhang, Brorsen and Duncan2026) that gives the marginal response to total available K (TAK t ), defined as the sum of STK and fertilizer-K. The QRP function for expected yield (y t ) is
 ${y_t} = \left\{ {\matrix{ {{\beta _0} + {\beta _1}\cdot(ST{K_t} + {K_t}) + {\beta _2}\cdot{{(ST{K_t} + {K_t})}^2}} & {{\rm{if}}\;TA{K_t}{\rm{ \lt }}TA{K^k}} \cr M & {{\rm{if}}\;TA{K_t} \ge TA{K^k}}}} \right.$
where STK t and K t are the STK measurements and fertilizer-K applied in year t. M is the plateau yield, and TAK k is the total amount of available K required to reach the plateau yield.
Then, if STK t < TAK k the marginal response of yield with respect to fertilizer-K is
 ${\partial y_{t} \over \partial K_{t}}=\beta _{1}+2\beta _{2}\cdot \left(STK_{t}+K_{t}\right),$
and substituting Equation (10) into Equation (8), holding p, r, and δ constant over time, the optimal fertilizer-K rate (K t *) is
 ${K}_{t}^{*}={1 \over 2\beta _{2}}\left({r\left(1-\delta \cdot \alpha _{1}\right) \over p\cdot (1-\delta \cdot \left(\alpha _{1}-\alpha _{2}\right))+\delta \cdot r\cdot \alpha _{3}}-\beta _{1}\right)-STK_{t}$
with β 2 < 0, which is the quadratic curvature on total available K in QRP. As STK carryover (α 1) or applied fertilizer-K carryover (α 2) increases, less available -K is lost to fixation, runoff or leaching, thereby effectively lessening the price of applying fertilizer-K. While the applied higher fertilizer-K carryover (α 2) more directly increases optimal fertilizer-K, the higher STK carryover (α 1) is not as direct because it can both increase the future value of soil-K and reduce the marginal need for future fertilizer-K. At the same time, as α 3 or crop uptake increases, more total available K is consumed in the current year, reducing the effectiveness of fertilizer-K for building STK. Overall, recall that a higher effective price of fertilizer-K reduces the profit-maximizing application rate.
2.4. Steady-state STK and fertilizer-K
Equation (11) gives the optimal fertilizer-K rate for the current year given the soil test carried into that year. It can be written as K t * = TAK* − STK t , where
 $TAK^{*}={1 \over 2\beta _{2}}\cdot \left({r\left(1-\delta \alpha _{1}\right) \over \left(p\left(1-\delta \left(\alpha _{1}-\alpha _{2}\right)\right)+\delta r\alpha _{3}\right)}-\beta _{1}\right)$
is the desired level of total available K. Greater carryover of applied fertilizer-K raises TAK* and so raises the current fertilizer-K application rate at any given STK. STK is not fixed, however.
Substituting these into the carryover function in Equation (1) gives
 $STK_{t+1}=\alpha _{0}+\alpha _{2}\cdot TAK^{*}+\alpha _{3}\cdot y(TAK^{*})+(\alpha _{1}-\alpha _{2})\cdot STK_{t},$
which converges to steady-state STK:
 $ST{K^{ss}} = {{{\alpha _0} + {\alpha _2} \cdot TA{K^*} + {\alpha _3} \cdot y\left( {TA{K^*}} \right)} \over {1 - {\alpha _1} + {\alpha _2}}},$
when the absolute difference of the carryover rates is less than one, |α 1 − α 2| < 1.
Then, the steady-state fertilizer-K rate is
 ${K^{SS}} = TA{K^*} - ST{K^{SS}} = {{\left( {1 - {\alpha _1}} \right)TA{K^*} - {\alpha _0} - {\alpha _3}y\left( {TA{K^*}} \right)} \over {1 - {\alpha _1} + {\alpha _2}}}.$
Greater carryover of applied fertilizer-K therefore has two effects that work against each other. It raises the desired total available K by lowering the effective price of fertilizer, and it lowers the fertilizer needed to hold any given target, because more of what was applied is still there the following year. Which effect dominates depends on the parameters, so the sign of the steady-state response to α 2 is not general.Footnote 5
2.5. Data and carryover estimates from prior studies
Data were obtained from five publicly available field experiments conducted across various crops and states in the U.S. (Filippi et al., Reference Filippi, Gatiboni, Crozier, Osmond and Hardy2024; Oliver et al., Reference Oliver, Popp, Fang, Anderson, Slaton, Drescher, Roberts and Thompson2023; Raun, Reference Raun2025; Savoy et al., Reference Savoy, Leib and Grant2021; Slaton and Uthman, Reference Slaton and Uthman2024). All datasets are from randomized blocked field experiments and contain the information needed to estimate carryover functions. Savoy et al. (Reference Savoy, Leib and Grant2021) worked with alfalfa (Medicago sativa L.) in Tennessee from 2012 to 2014. Oliver et al. (Reference Oliver, Popp, Fang, Anderson, Slaton, Drescher, Roberts and Thompson2023) included a rice–soybean rotation in Arkansas from 2000 to 2020. Filippi et al. (Reference Filippi, Gatiboni, Crozier, Osmond and Hardy2024) included corn (Zea mays L.) production conducted at two-year intervals in North Carolina during 2010, 2012, and 2014. Slaton and Uthman (Reference Slaton and Uthman2024) considered Bermudagrass (Cynodon dactylon L.) in Arkansas from 2006 to 2010 and Raun (Reference Raun2025) collected data from long-term wheat (Triticum aestivum L.) experiments in Oklahoma since 1969. For Oklahoma wheat data, annual STK is available only from 2012 to 2020. Separate K carryover functions are estimated for each crop, including separate rice and soybean functions for the Oliver et al. (Reference Oliver, Popp, Fang, Anderson, Slaton, Drescher, Roberts and Thompson2023) dataset. Units were converted for consistency across all datasets. STK measurements were based on the Mehlich-3 extractant expressed as units of K in mg/kg (ppm) of soil. The Mehlich-1 K dataset from Savoy et al. (Reference Savoy, Leib and Grant2021) was converted to Mehlich-3 K equivalents using the equation Mehlich-3 ppm = (Mehlich-1 ppm × 1.53) + 27, as described by Adotey et al. (Reference Adotey, Logwood, Walker, Hawkins, Duncan, Florence, Blair, Yin, Raper and McNeal2024).
Fertilizer-K application rates were converted to kg K/ha. All crop yields were converted to metric tons per hectare and then multiplied by crop-specific K removal coefficients to reflect the K contained in harvested biomass. The coefficients for K removal are 0.0245 kg K/kg for alfalfa, 0.0208 kg K/kg for Bermudagrass, 0.0037 kg K/kg for corn, 0.0030 kg K/kg for rice, 0.0166 kg K/kg for soybean, and 0.0046 kg K/kg for wheat (Kelling, Reference Kelling2000; Roberts et al., Reference Roberts, Kirkpatrick, Slaton and Norman2015; Plant Nutrition Canada, 2025). Thus, the unit of crop K removal by yield is kg K/ha.
Estimates of carryover functions for P and K were collected from previous studies and are summarized in Table 1. On average, the STK carryover rate is lower than that of P, with an average of 61% of STK persisting to the following year compared with 80% for P. In contrast, the average carryover coefficient of fertilizer-K is 0.40, whereas the fertilizer-P carryover coefficient is 0.17.
Summary of estimated nutrient carryover rates for phosphorus and potassium from previous studies
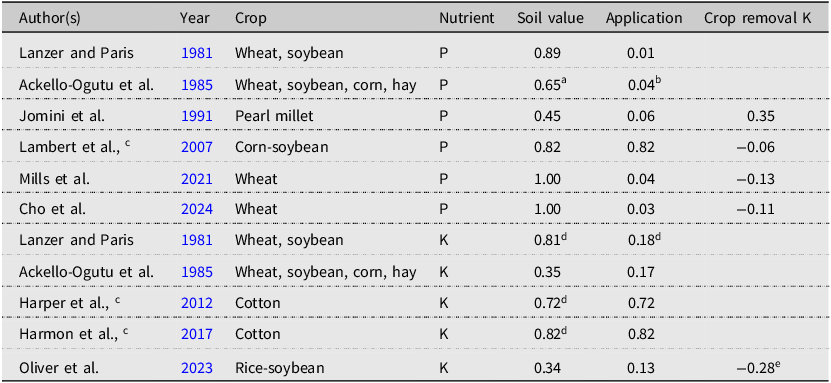
Table 1. Long description
A table summarizing nutrient carryover rates for phosphorus and potassium from various studies. The table has 10 rows and 7 columns. The columns are labeled Author(s), Year, Crop, Nutrient, Soil value, Application, and Crop removal K. The rows list different studies and their findings. Row 1: Lanzer and Paris, 1981, Wheat, soybean, P, 0.89, 0.01, -. Row 2: Ackello-Ogutu et al., 1985, Wheat, soybean, corn, hay, P, 0.65a, 0.04b, -. Row 3: Jomini et al., 1991, Pearl millet, P, 0.45, 0.06, 0.35. Row 4: Lambert et al., 2007, Corn-soybean, P, 0.82, 0.82, -0.06. Row 5: Mills et al., 2021, Wheat, P, 1.00, 0.04, -0.13. Row 6: Cho et al., 2024, Wheat, P, 1.00, 0.03, -0.11. Row 7: Lanzer and Paris, 1981, Wheat, soybean, K, 0.81d, 0.18d, -. Row 8: Ackello-Ogutu et al., 1985, Wheat, soybean, corn, hay, K, 0.35, 0.17, -. Row 9: Harper et al., 2012, Cotton, K, 0.72d, 0.72, -. Row 10: Harmon et al., 2017, Cotton, K, 0.82d, 0.82, -. Row 11: Oliver et al., 2023, Rice-soybean, K, 0.34, 0.13, -0.28e.
Notes: Soil test values are reported in milligrams of nutrient per kilogram of soil (ppm), while fertilizer-K application units and crop-removal yield, adjusted by the crop-specific K content in the harvested biomass for each kilogram of crop yield, are in kilogram of K per hectare.
a Value reported is the sum of coefficients on the first and second lag of soil-test values.
b The coefficient shown applies to wheat, as the corn coefficient is negligible.
c These studies estimated the carryover function using total available nutrient (soil value + application) rather than separating coefficients for each component. The units of nutrient availability are in kilograms total available P or K per hectare.
d The reported standard errors of 0.02 for these coefficients were used in the meta-analysis.
e The unit is based on a relative yield index. As such, STK decreases by −0.28 ppm for a 1% change in soybean yield and −0.15 ppm for a 1% change in rice yield.
2.6. Required adjustments for consistent carryover modeling
To arrive at consistent estimates for carryover from STK and fertilizer-K across studies, we estimate a separate carryover function for each data set following Equation (1). In estimating the carryover model for Arkansas rice–soybean rotations (Oliver et al., Reference Oliver, Popp, Fang, Anderson, Slaton, Drescher, Roberts and Thompson2023), an indicator for prior-year rice is included so that K removal rates can differ between rice and soybean. Carryover functions are also estimated separately for rice and soybean. For the North Carolina corn data, because corn is produced in two-year intervals, lagged terms are defined as t − 2 for estimation. Assuming a constant annual carryover rate, the two-year coefficient is the square of the annual rate, so its square root is the annual carryover estimate used in the meta-analysis.
2.7. Estimating the effect of autocorrelation using Monte Carlo simulation
The carryover equations represent a dynamic panel model, and so the estimates will be biased in small samples (Judson and Owen, Reference Judson and Owen1999; Kiviet, Reference Kiviet1995; Nickell, Reference Nickell1981). The bias arises because the lagged STK term is correlated with unobserved effects that also include the random error, which tends to pull the autoregressive coefficient toward zero (Nickell, Reference Nickell1981). Measurement errors in STK would also bias the carryover coefficient toward zero. Measurement error is not expected to be from laboratory instruments; rather, it is caused by STK changing over time due to changes in moisture, organic matter decomposition, or other factors. To determine the size of these potential biases, this study uses a Monte Carlo study.
The Monte Carlo simulation is used to calculate finite-sample bias of the autoregressive coefficient of lagged STK in a dynamic panel model with time random effects and an exogenous variable representing fertilizer-K application. For the Monte Carlo simulation, the data are generated from
 $\widehat{STK}_{it}=\rho \cdot \widehat{STK}_{it-1}+\gamma \cdot K_{it-1}+\mu _{t}+e_{it}$
where
 $\widehat{STK}_{it}$
is the measured STK, μ
t
is the random intercept and e
it
is the random error term; μ
i
∼ N(0, σ
μ
2) and e
it
∼ N(0, 1). With measurement error,
 $TK_{it}=\widehat{STK}_{it}+\tau _{it}$
, and two measurement error scenarios are considered: standard deviations of τ
it
of 0 and 0.5. The true value is assumed as 0.8 for both the lagged STK and fertilizer-K carryover coefficients,Footnote
6
which are ρ and γ, and the simulation uses 1,000 replications. The simulation assumes four equally spaced treatments with four replications for each treatment.
2.8. Developing carryover estimates across production environments and crops
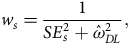
To obtain carryover coefficients that can serve as practical guidelines, this study used previously reported estimates and estimates from the current analysis to arrive at what could be considered summary carryover values. The reported estimates are limited in number and come from studies of different crops grown under varying soil types, climates, and management systems across multiple states. To account for this agronomic diversity, we used a DerSimonian–Laird random-effects meta-analysis (DerSimonian and Laird, Reference DerSimonian and Laird1986) to obtain STK carryover, fertilizer-K carryover, and K depletion from crop uptake estimates for summary carryover values. The random-effects inverse-variance weight for each study (s) is:
 $w_{s}={1 \over {SE}_{s}^{2}+{\hat{\omega }}_{DL}^{2}},$
where the meta-analytic summary estimate (θ̂ meta) is
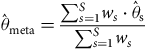 $\hat{\theta }_{{\rm meta}}={{\sum }_{s=1}^{S}w_{s}\cdot \hat{\theta }_{{\rm s}} \over {\sum }_{s=1}^{S}w_{s}}$
and SE
s
is the reported standard error for each study s,
 ${\hat{\omega }}^{2}_{DL}$
is the estimated between-study variance, while θ̂
s is the estimate from study s. The between-study variance was estimated using the DerSimonian–Laird method-of-moments estimator (DerSimonian and Laird, Reference DerSimonian and Laird1986).
Based on the summary estimates, two summary carryover functions are proposed. The first is the five-studies summary carryover function based on the five analyzed studies. The second is the pooled summary carryover function that incorporates the Table 1 estimates from previous literature. However, because the Oliver et al. (Reference Oliver, Popp, Fang, Anderson, Slaton, Drescher, Roberts and Thompson2023) data are also estimated in the five-studies summary carryover, the Table 1 estimate from Oliver et al. (Reference Oliver, Popp, Fang, Anderson, Slaton, Drescher, Roberts and Thompson2023) is not included in the pooled summary carryover function.
2.9. Quantifying the economic effect of using incorrect carryover estimates
The optimal fertilizer-K rate depends on the assumed degree of fertilizer-K carryover. For sensitivity analysis, this study considers applying the optimal fertilizer-K rate under four carryover assumptions which are (1) no carryover of fertilizer-K (No Carryover), (2) carryover of fertilizer-K given by the five-studies summary carryover function (5 Studies), (3) carryover of fertilizer-K given by the pooled summary carryover function (Pooled), and (4) a high-carryover case (High Carryover), assuming a fertilizer-K carryover coefficient of 0.8.
2.10. Bermudagrass case study
To obtain numerical results for the optimal fertilizer-K rate, price information and field-specific carryover and yield functions are required. This study assumes a Bermudagrass producer who maximizes NPV in a dynamic programming framework as an example. We present the solution for five years and include a terminal value that includes the value of K remaining in the soil, so that the solutions are equivalent to an infinite planning horizon. Finite planning horizons would not include the terminal value and would give zero value to carryover in the last year. Using the Arkansas Bermudagrass dataset (Slaton and Uthman, Reference Slaton and Uthman2024), this study estimates the K carryover and QRP yield functions and treats them as the true functions to simulate STK and yield changes under the optimal fertilizer-K rates in each scenario. The meta-analysis carryover coefficients are used in the case study to illustrate the consequences of applying general guidelines on a specific field, since most producers would not have experimental data on their field and would need to rely on such summary values.
3. Results
3.1. Estimated carryover functions
Estimated carryover functions for K from five studies are reported in Table 2. On average, the STK carryover rate is 48% and the carryover coefficient for fertilizer-K is 0.21, both lower than the carryover rates in Table 1. A 48% STK carryover means that if STK is 100 ppm in the first year, about 48 ppm remains in the following year. Similarly, a fertilizer-K coefficient of 0.21 indicates that applying 1 kg/ha of fertilizer-K increases next year’s STK by approximately 0.21 ppm. The carryover coefficients for STK (the estimated coefficient on lagged STK) are usually higher than the coefficient for fertilizer-K. The main exception to this rule is rice following soybeans in Arkansas. This experiment used flood irrigation for both crops, and since K can be water soluble, the flood irrigation and subsequent release of the flood water may have accentuated K loss in runoff, especially when the small plots were cropped to soybean, reducing the persistence in STK that was seen in other studies.
Estimates of soil-test potassium carryover functions
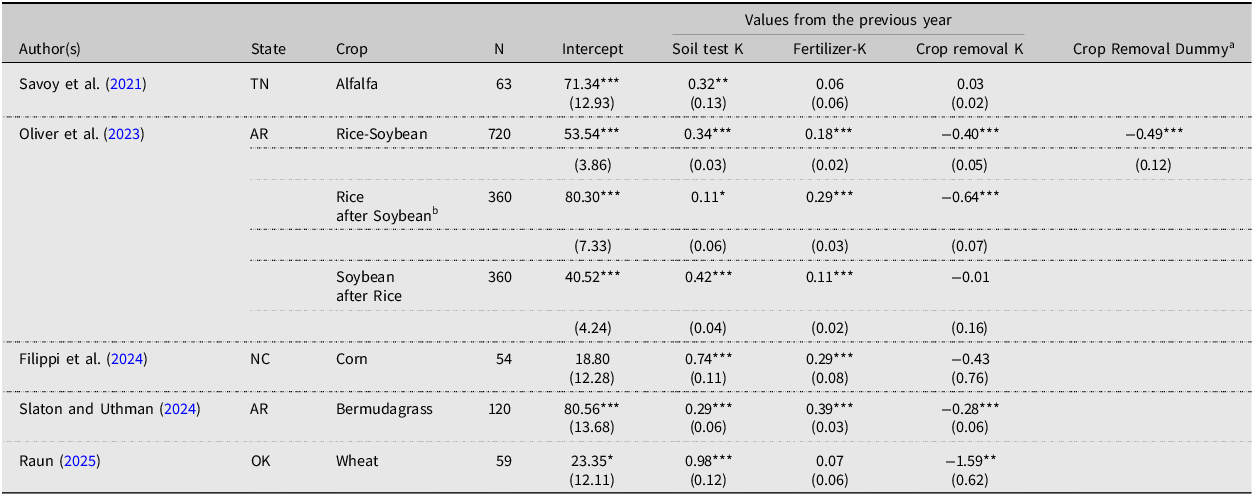
Table 2. Long description
The table presents estimates of soil-test potassium (K) carryover functions from five studies. It includes data on the state, crop, sample size (N), intercept, soil test K, fertilizer-K, crop removal K, and crop removal dummy values. The studies are from Savoy et al. (2021) in Tennessee, Oliver et al. (2023) in Arkansas, Filippi et al. (2024) in North Carolina, Slaton and Uthman (2024) in Arkansas, and Raun (2025) in Oklahoma. The table has 6 rows and 8 columns. Column headers are Author(s), State, Crop, N, Intercept, Soil test K, Fertilizer-K, Crop removal K, and Crop Removal Dummy. Row labels include different crops and states. Notable trends include varying intercepts and coefficients for soil test K and fertilizer-K across different crops and states.
Notes: The dependent variable is soil test K. The explanatory variables are the previous year’s soil test K, fertilizer-K, and K removed by the previous crop. Those data were collected from randomized blocked experiments, and plot-level random effect was included following Equation (1), but the estimates are not reported. Soil test values are reported in milligrams of nutrient per kilogram of soil (ppm), fertilizer-K application units and crop-removal yield, adjusted by the crop-specific K content in the harvested biomass for each kilogram of crop yield, are in kilogram of K per hectare. Statistical significance: *p < 0.10, **p < 0.05, ***p < .01.
a Estimated carryover function for rice–soybean rotation using dummy crop-removal yield for rice.
b Rice-year STK was used as the dependent variable to estimate the carryover function with the previous year’s soybean STK, fertilizer-K application, and soybean yield removal.
In the Tennessee alfalfa and Oklahoma wheat datasets, the fertilizer-K carryover coefficient is statistically insignificant. However, this should not be interpreted as evidence that fertilizer-K does not carry over. In the Tennessee alfalfa study, Savoy et al. (Reference Savoy, Leib and Grant2021) report that STK remained low throughout 2012 to 2014. Moreover, the number of alfalfa cuttings increased each year, with three, four, and five in 2012, 2013, and 2014, respectively. Intensive harvest schedules could imply that most fertilizer-K was removed by the crop rather than remaining in the soil. The Oklahoma wheat dataset is from a long-term experiment conducted since 1969. So, STK could have reached an equilibrium level with very high persistence of STK, which has a 98% STK carryover rate. This suggests that unused applied fertilizer-K may be converted to nonexchangeable K, as these soils have high STK levels.
STK is reported in ppm, whereas crop K removal is reported in kg K/ha. Assuming a soil depth of 10 cm and a bulk density of 1.30 g cm−3, 1 ppm of STK equals 1.3 kg K/ha. Under this assumption, a one-to-one effect of K removal would be 0.77, which is 1 divided by 1.3. However, the coefficient on lagged crop K removal for wheat is greater than 0.77, which means that STK dropped more than the amount removed by the crop. A possible explanation of the large coefficient is that there was more straw when grain yields were high and the K in the straw would not show up in the soil test until sufficient rainfall occurred to leach the K from the straw. Also, with such high levels of STK in the Oklahoma wheat experiment, luxury consumption of K, where the plant removes K without adding yield, is quite possible.
3.2. Effects of autocorrelation on carryover estimates from Monte Carlo simulation
Table 3 reports the results of the Monte Carlo study with 1,000 replications. This shows that the coefficient on lagged STK will be underestimated, and the coefficient on the carryover of fertilizer-K will be overestimated. Nevertheless, these biases are likely small relative to other sources of error. Thus, statistical imprecision cannot explain the low rates of K carryover. The biggest loss of K is likely to the soil reserve (non-exchangeable K), which is slowly available to crops yet not detected by standard soil testing. When the crop removes more K than is applied, K is slowly released from the reserve, buffering the decline and making STK appear stable. When the crop removes less K than is applied, it is generally expected that part of the surplus K will increase STK (exchangeable pool), while the remainder will be stored as reserve K (non-exchangeable K). However, it is also possible that most of the surplus is stored in the reserve, so that STK could appear stable instead of increasing.
Monte carlo study results
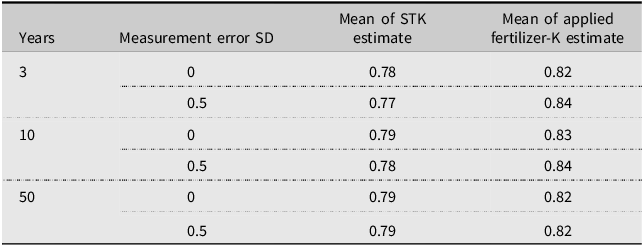
Table 3. Long description
A table with four rows and three columns comparing measurement error SD, mean of STK estimate, and mean of applied fertilizer-K estimate over different years. The columns are labeled Years, Measurement error SD, Mean of STK estimate, and Mean of applied fertilizer-K estimate. The rows are labeled with years 3, 10, and 50, each with measurement error SD values of 0 and 0.5. For year 3, with measurement error SD 0, the mean of STK estimate is 0.78 and the mean of applied fertilizer-K estimate is 0.82. With measurement error SD 0.5, the mean of STK estimate is 0.77 and the mean of applied fertilizer-K estimate is 0.84. For year 10, with measurement error SD 0, the mean of STK estimate is 0.79 and the mean of applied fertilizer-K estimate is 0.83. With measurement error SD 0.5, the mean of STK estimate is 0.78 and the mean of applied fertilizer-K estimate is 0.84. For year 50, with measurement error SD 0, the mean of STK estimate is 0.79 and the mean of applied fertilizer-K estimate is 0.82. With measurement error SD 0.5, the mean of STK estimate is 0.79 and the mean of applied fertilizer-K estimate is 0.82.
Note: The true value of both coefficients was 0.8. These Monte Carlo results do not include the crop removal K term. Simulations were also run with simulated yield and a large crop removal K term (0.5) and the bias found was not appreciably different. With true coefficients of 0.2 instead of 0.8, the average STK coefficient ranged from 0.16 to 0.20 and the Applied K coefficient ranged from 0.197 to 0.205.
3.3. Summary results for carryover function
Two summary carryover functions are estimated from the weighted mean parameter estimates in Table 4. First, a summary function based on the five studies reported in Table 2 has coefficients of 0.46 on STK, 0.20 on fertilizer-K, and − 0.27 on crop uptake. The carryover values of STK and fertilizer-K are equivalent to an approximate 25% discount on the price of fertilizer-K according to Equation (8), leading to higher fertilizer-K application rates and greater carryover retained for use in subsequent years. Second, using pooled estimates from Tables 1 and 2, the summary function has larger coefficients on STK and fertilizer-K, which are 0.55 and 0.31. While K carryover varies, it clearly occurs. Economically, more carryover lowers K’s effective price and leads to more fertilizer-K applied in the current period which dynamically leads to lower application in the future given STK accumulation.
Summary carryover functions from the weighted means estimates and description of scenarios
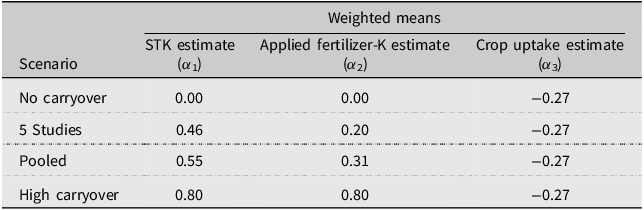
Table 4. Long description
A table comparing weighted means estimates across different scenarios. The table has four rows and three columns. The columns are labeled STK estimate (α1), Applied fertilizer-K estimate (α2), and Crop uptake estimate (α3). The rows are labeled No carryover, 5 Studies, Pooled, and High carryover. Row 1: No carryover, STK estimate 0.00, Applied fertilizer-K estimate 0.00, Crop uptake estimate -0.27. Row 2: 5 Studies, STK estimate 0.46, Applied fertilizer-K estimate 0.20, Crop uptake estimate -0.27. Row 3: Pooled, STK estimate 0.55, Applied fertilizer-K estimate 0.31, Crop uptake estimate -0.27. Row 4: High carryover, STK estimate 0.80, Applied fertilizer-K estimate 0.80, Crop uptake estimate -0.27.
Note: The 5 studies estimate is based only on the five analyzed studies in Table 2, whereas the pooled summary uses estimates from prior studies in Table 1 as well as this study to compute the meta-analytic summary estimate using random-effects inverse-variance weight estimates. No carryover and high carryover scenarios use the assumed values given. Units of STK are milligrams of K per kilogram of soil (ppm), and fertilizer-K application and crop removal units are kilograms of K per hectare. See Equation (1).
3.4. Bermudagrass case study results
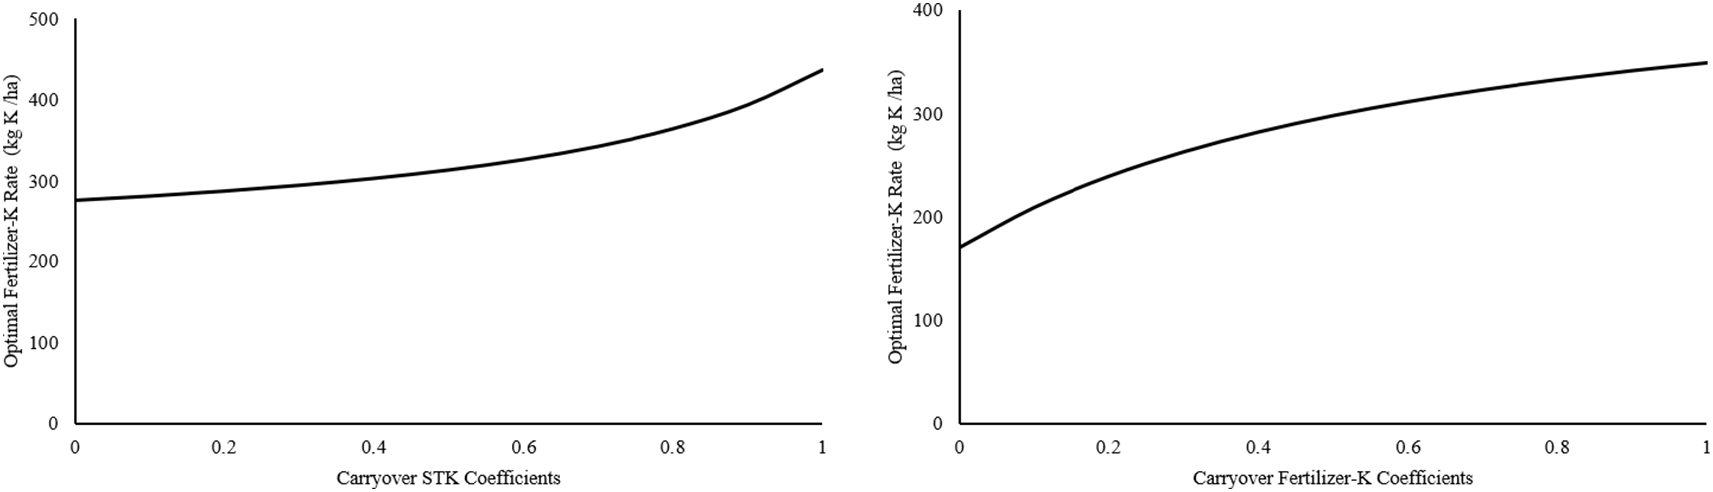
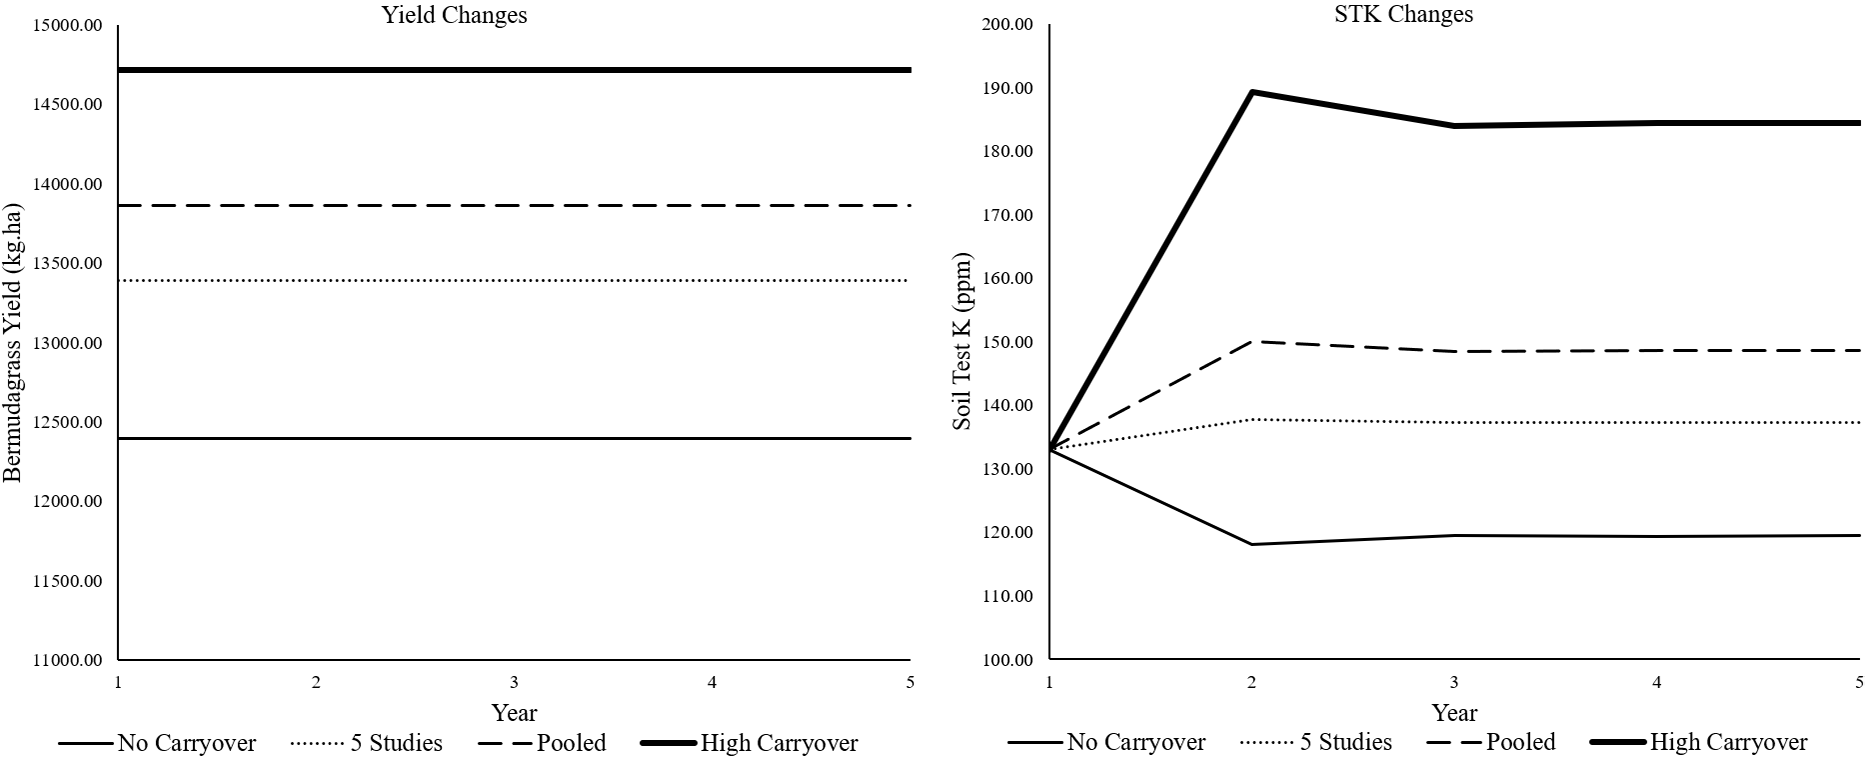
Using Arkansas 2023 prices of $0.07 per kg for Bermudagrass hayFootnote 7 and $1.10 per kg of K for fertilizer-K (Mitchell et al., Reference Mitchell, Mills, Finch, Lawson and Loy2024) with a discount rate of 5% (USDA-FSA, 2026), a five-year NPV dynamic programming analysis was performed. Figure 1 shows optimal fertilizer-K rates as the functions of the STK carryover rate and fertilizer-K carryover rate, using an initial STK of 133 ppm in the first year and the QRP yield function from Table 5. As carryover coefficients increase, the optimal fertilizer-K rate rises because carryover reduces the effective price of fertilizer-K. However, the marginal response of the optimal fertilizer-K rate differs between the STK and fertilizer-K carryover coefficients. As the STK carryover coefficient increases, the marginal response becomes larger, whereas as the applied fertilizer-K carryover coefficient increases, the marginal response becomes smaller. Figure 2 shows that as higher fertilizer-K rates are applied, STK is maintained at higher levels, and yields rise accordingly, with changes tracked over the first five years as a steady state is reached by year 3. When the optimal fertilizer-K rate is calculated without considering carryover, STK remains below the first-year STK level and results in the lowest yield (Figure 2). Figure 1 holds STK at its first-year value of 133 ppm, so what it shows is the current-period effect of carryover at a given soil test. Figure 2 shows what follows from it. Under the true carryover coefficients, STK rises from 133 to 148 ppm in the second year and settles at 147 ppm, and the application rate settles at 267 kg K/ha. The transition is short and the steady state is reached by year 3.
Changes of optimal current-year fertilizer-K rate driven by STK (left) and fertilizer-K carryover (right) assumption in Bermudagrass.
Note: The initial STK is assumed to be 133 ppm. Each plot varies either the STK carryover rate or the applied fertilizer-K carryover rate while holding the other fixed. The left plot varies the carryover STK coefficients with carryover fertilizer-K coefficient fixed at 0.39, whereas the right plot varies the carryover fertilizer-K coefficients with carryover STK coefficient fixed at 0.29. The fixed coefficients are taken from Slaton and Uthman (Reference Slaton and Uthman2024), as reported in Table 2.
Results by scenarios over a first five-year planning horizon for Arkansas Bermudagrass.
Note: The optimal fertilizer-K rates were calculated under four scenarios: no carryover, five-study summary carryover, pooled summary carryover, and high carryover. The corresponding STK and applied fertilizer-K carryover coefficients were (0,0). (0.46, 0.20), (0.55,0.31), and (0.80,0.80), respectively. The true carryover coefficient on STK and fertilizer-K were set to 0.29 and 0.39, based on Bermudagrass carryover estimates reported in Table 2.
Estimated Bermudagrass quadratic response plateau yield function to total available potassium
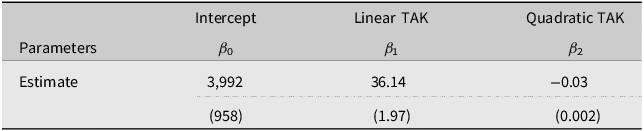
Table 5. Long description
A table with three columns and two rows. The columns are labeled Parameters, Intercept, Linear TAK, and Quadratic TAK. The row labels are Estimate. The values in the table are as follows: Row 1: Parameters, Intercept, Linear TAK, Quadratic TAK. Row 2: Estimate, 3992, 36.14, -0.03. The table also includes values in parentheses: Row 2: Estimate, (958), (1.97), (0.002).
Notes: Units are kilograms per hectare (kg ha-1). Total available potassium (TAK) is the sum of STK and applied fertilizer-K. Standard errors are in parentheses. All estimates are statistically significant at p < 0.001 for the coefficients and p < 0.05 for the intercept. The plateau yield is 14,861 kg ha−1. See Equation (9) for further detail.
3.5. Crop removal K, fertilizer-K, STK, and K losses using different carryover assumptions
Table 6 reports five-year soil changes of STK, fertilizer-K, total K, and crop K removal from the dynamic programming results by each scenario. Total K is calculated as the sum of STK and fertilizer-K. Crop K removal is estimated as expected yield multiplied by − 0.0058, which equals the Bermudagrass removal rate 0.0208 (Plant Nutrition Canada, 2025) times the estimated coefficient on crop removal − 0.28 and reflects removal’s impact on STK. Loss amount was also computed as the remainder of total K once crop K removal and the next year’s STK were deducted. As more fertilizer-K is applied, total available K increases, better supplying crop K needs, which leads to greater crop K removal due to higher yields (Table 6).
Summary of 5-year dynamic programming results for soil-K dynamics with Arkansas Bermudagrass
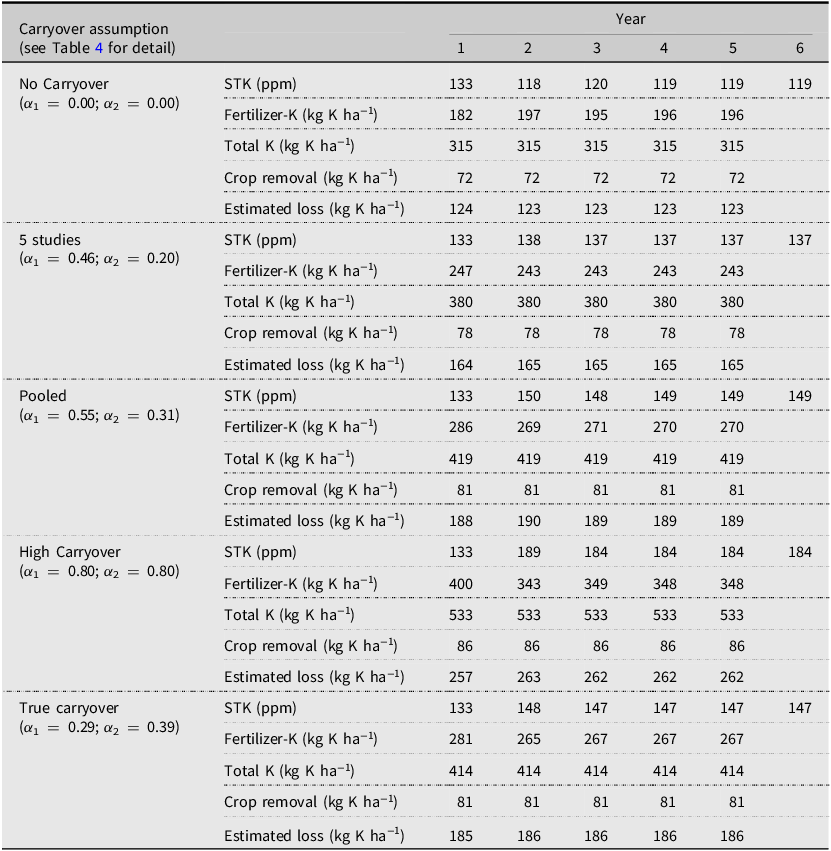
Table 6. Long description
A table comparing soil-K dynamics over five years under different carryover assumptions. The table has six rows and six columns. Column headers are Year, No Carryover, 5 studies, Pooled, High Carryover, and true carryover. Row labels are STK (ppm), Fertilizer-K (kg K ha−1), Total K (kg K ha−1), Crop removal (kg K ha−1), and Estimated loss (kg K ha−1). Each row provides values for each year from 1 to 6 under different carryover assumptions. The table shows variations in STK, Fertilizer-K, Total K, Crop removal, and Estimated loss across different scenarios.
Notes: Estimated loss value is calculated by subtracting crop removal and next year STK from total K in current year. True Carryover values are based on the estimated value for Bermudagrass from Slaton and Uthman (Reference Slaton and Uthman2024) as reported in Table 2.
At the same time, estimated K loss rose as fertilizer-K increased, accounting for 39–49% of total K (Tables 7–8), considering true carryover values of 0.29 and 0.39 for STK and fertilizer-K. In sandy soils under high rainfall or irrigation, K losses can be high (up to 50%), whereas in dry, clay-rich soils, they are very low (approaching zero) (Johnston et al., Reference Johnston, Goulding and Mercer1993; Mendes et al., Reference Mendes, Júnior, da Cunha, da Silva, Evangelista and Casaroli2016). However, leaching losses of K from applied fertilizers are generally reported to be 1–20% in agricultural soils (Lu et al., Reference Lu, Yanhong, Chen, Wang and Zhou2022). Assuming the upper end of 20% of the applied fertilizer-K is lost via leaching, the remaining 0–19% would remain in the soil but is retained through fixation into slowly available pools and thus is not detected by routine soil tests. Our economic analysis does not account for the possibility of future availability of the K in the soil-K reserve, and so our approach may be underestimating the optimal level of fertilizer-K. Fertilizer-K applied in excess of the amount needed to maximize yield is susceptible to luxury consumption and subsequent removal by harvested forages, making our optimal fertilizer-K rates accurate.
Summary of the percentage of estimated K loss by total K in Arkansas Bermudagrass under varying true STK carryover rates
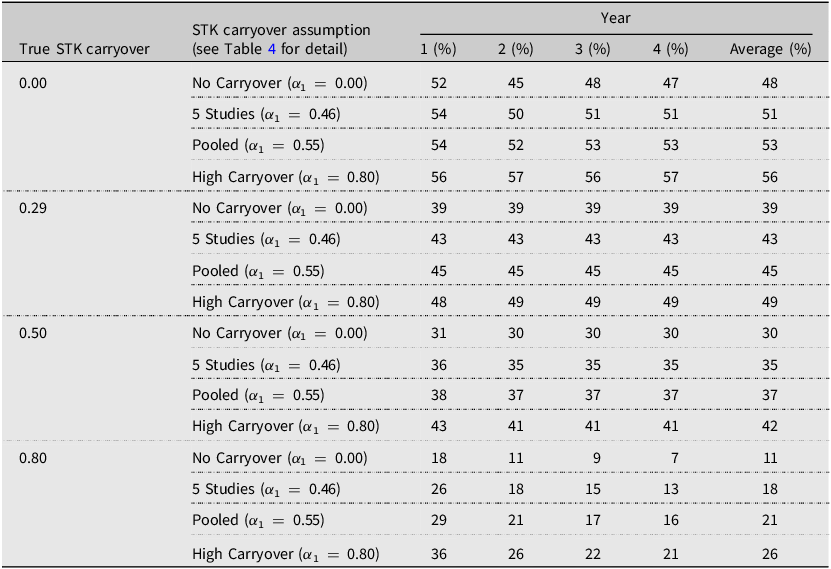
Table 7. Long description
A table comparing estimated Kloss percentages under varying STK carryover rates. The table has 16 rows and 7 columns. Column headers are true STK carryover, STK carryover assumption, Year 1 (percent), Year 2 (percent), Year 3 (percent), Year 4 (percent), and Average (percent). Row labels include different true STK carryover values (0.00, 0.29, 0.50, 0.80) and STK carryover assumptions (No Carryover, 5 Studies, Pooled, High Carryover). Row 1: true STK carryover 0.00, No Carryover, 52, 45, 48, 47, 48. Row 2: true STK carryover 0.00, 5 Studies, 54, 50, 51, 51, 51. Row 3: true STK carryover 0.00, Pooled, 54, 52, 53, 53, 53. Row 4: true STK carryover 0.00, High Carryover, 56, 57, 56, 57, 56. Row 5: true STK carryover 0.29, No Carryover, 39, 39, 39, 39, 39. Row 6: true STK carryover 0.29, 5 Studies, 43, 43, 43, 43, 43. Row 7: true STK carryover 0.29, Pooled, 45, 45, 45, 45, 45. Row 8: true STK carryover 0.29, High Carryover, 48, 49, 49, 49, 49. Row 9: true STK carryover 0.50, No Carryover, 31, 30, 30, 30, 30. Row 10: true STK carryover 0.50, 5 Studies, 36, 35, 35, 35, 35. Row 11: true STK carryover 0.50, Pooled, 38, 37, 37, 37, 37. Row 12: true STK carryover 0.50, High Carryover, 43, 41, 41, 41, 42. Row 13: true STK carryover 0.80, No Carryover, 18, 11, 9, 7, 11. Row 14: true STK carryover 0.80, 5 Studies, 26, 18, 15, 13, 18. Row 15: true STK carryover 0.80, Pooled, 29, 21, 17, 16, 21. Row 16: true STK carryover 0.80, High Carryover, 36, 26, 22, 21, 26.
Notes: This analysis reports the estimated K loss percentage of Total K making different carryover assumptions and applying optimal fertilizer-K rates to estimate how much greater K loss is compared to what true K losses would be with the true STK carryover. For example, the second row of the table suggests that if there truly was no K carryover (true STK carryover = 0), that K losses would be greater by 3% on average if the producer assumed carryover of 0.46, 5% greater if the producer assumed carryover of 0.55, and 8% greater if the producer assumed carryover of 0.80. The true STK carryover of 0.29 and fertilizer-K carryover 0.39 are taken from the study of Slaton and Uthman (Reference Slaton and Uthman2024) as reported in Table 2.
Summary of the percentage of estimated K loss by total K in Arkansas Bermudagrass under varying true fertilizer-K carryover rates
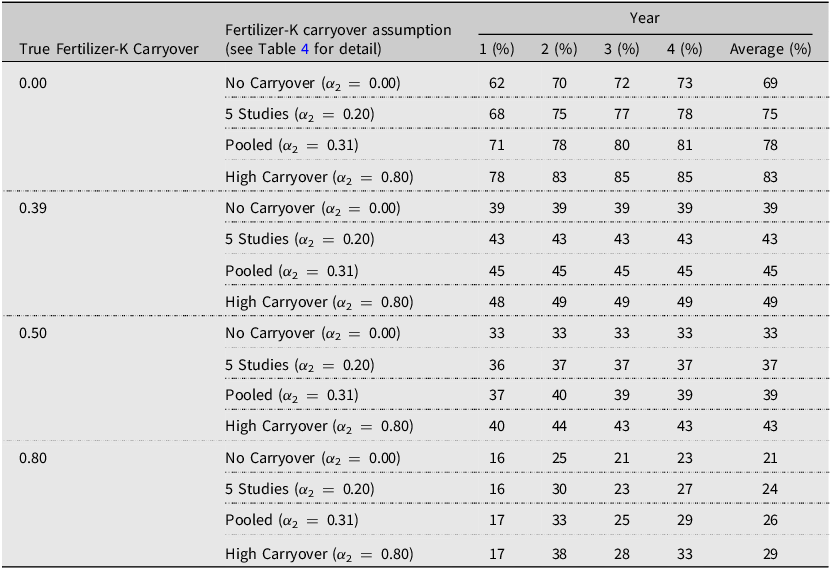
Table 8. Long description
A table comparing estimated Kloss percentages under varying fertilizer-K carryover rates. The table has 4 rows and 6 columns. Column headers are Fertilizer-K carryover assumption, Year 1 (percent), Year 2 (percent), Year 3 (percent), Year 4 (percent), and Average (percent). Row labels are true Fertilizer-K Carryover values of 0.00, 0.39, 0.50, and 0.80. Each row contains values for different assumptions: No Carryover, 5 Studies, Pooled, and High Carryover. Row 1: true Fertilizer-K Carryover 0.00. No Carryover: 62, 70, 72, 73, 69. 5 Studies: 68, 75, 77, 78, 75. Pooled: 71, 78, 80, 81, 78. High Carryover: 78, 83, 85, 85, 83. Row 2: true Fertilizer-K Carryover 0.39. No Carryover: 39, 39, 39, 39, 39. 5 Studies: 43, 43, 43, 43, 43. Pooled: 45, 45, 45, 45, 45. High Carryover: 48, 49, 49, 49, 49. Row 3: true Fertilizer-K Carryover 0.50. No Carryover: 33, 33, 33, 33, 33. 5 Studies: 36, 37, 37, 37, 37. Pooled: 37, 40, 39, 39, 39. High Carryover: 40, 44, 43, 43, 43. Row 4: true Fertilizer-K Carryover 0.80. No Carryover: 16, 25, 21, 23, 21. 5 Studies: 16, 30, 23, 27, 24. Pooled: 17, 33, 25, 29, 26. High Carryover: 17, 38, 28, 33, 29.
Notes: This analysis reports the estimated K loss percentage of Total K making different carryover assumptions and applying optimal fertilizer-K rates to estimate how much greater K loss is compared to what true K losses would be with the true fertilizer-K carryover. For example, the second row of the table suggests that if there truly was no K carryover (true fertilizer-K carryover = 0), that K losses would be greater by 6% on average if the producer assumed carryover of 0.20, 9% greater if the producer assumed carryover of 0.31, and 14% greater if the producer assumed carryover of 0.80. The true STK carryover of 0.29 and fertilizer-K carryover 0.39 are taken from the study of Slaton and Uthman (Reference Slaton and Uthman2024) as reported in Table 2.
3.6. Effects of incorrect carryover assumption on K loss and economic outcomes
Economic outcomes, including annual revenue, fertilizer-K cost, profit, and the first five-year NPV under an infinite planning horizon, are reported in Table 9. In the first year, with STK assumed to be the same across scenarios, single-year profit depended more on lower fertilizer costs than on yield gains. However, scenario 3 used a carryover coefficient of 0.31 for fertilizer-K, which was closest to the true parameter reported in Table 2, and its NPV was only $0.20 per hectare lower than the case using the true carryover parameters. When estimated carryover of applied K was below the true carryover rate, the NPV was always above the no carryover case. However, as in Scenario 4, when carryover is assumed to be substantially higher than the true parameters and large amounts of fertilizer-K are applied, profitability does not improve, as fertilizer-K may either be luxury consumed, lost or is not measured in STK.
Summary of 5-year economic outcomes ($/ha) based on dynamic programming with arkansas Bermudagrass
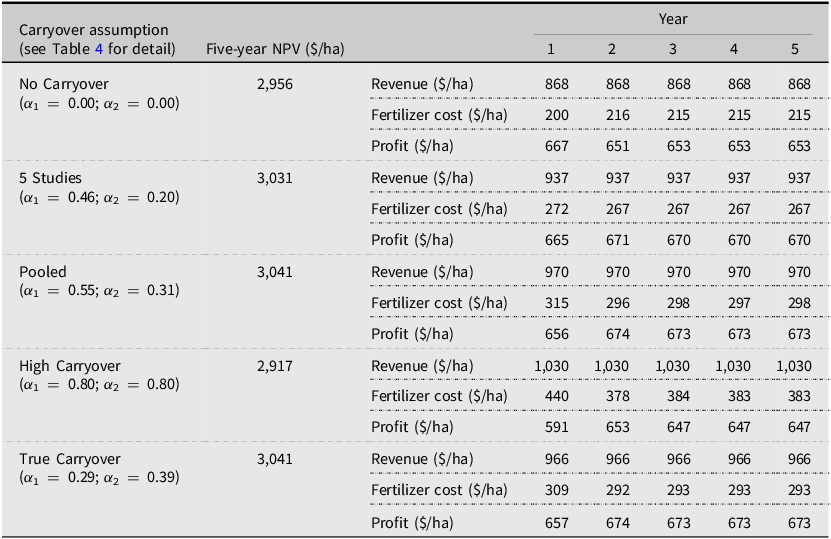
Table 9. Long description
A table comparing economic outcomes over five years for different carryover assumptions. The table has five rows and five columns. The columns are labeled as Year 1, Year 2, Year 3, Year 4, and Year 5. The rows are labeled as No Carryover, 5 Studies, Pooled, High Carryover, and True Carryover. Each row contains data for Revenue ($/ha), Fertilizer cost ($/ha), and Profit ($/ha) for each year. Row 1: No Carryover (α1 = 0.00; α2 = 0.00). Revenue ($/ha): 2956, 868, 868, 868, 868. Fertilizer cost ($/ha): 200, 216, 215, 215, 215. Profit ($/ha): 667, 651, 653, 653, 653. Row 2: 5 Studies (α1 = 0.46; α2 = 0.20). Revenue ($/ha): 3031, 937, 937, 937, 937. Fertilizer cost ($/ha): 272, 267, 267, 267, 267. Profit ($/ha): 665, 671, 670, 670, 670. Row 3: Pooled (α1 = 0.55; α2 = 0.31). Revenue ($/ha): 3041, 970, 970, 970, 970. Fertilizer cost ($/ha): 315, 296, 298, 297, 298. Profit ($/ha): 656, 674, 673, 673, 673. Row 4: High Carryover (α1 = 0.80; α2 = 0.80). Revenue ($/ha): 2917, 1030, 1030, 1030, 1030. Fertilizer cost ($/ha): 440, 378, 384, 383, 383. Profit ($/ha): 591, 653, 647, 647, 647. Row 5: True Carryover (α1 = 0.29; α2 = 0.39). Revenue ($/ha): 3041, 966, 966, 966, 966. Fertilizer cost ($/ha): 309, 292, 293, 293, 293. Profit ($/ha): 657, 674, 673, 673, 673.
Notes: A 5% discount rate (USDA-FSA, 2026) was used and α 2 is the fraction of applied fertilizer-K retained in the soil as STK. The true Bermudagrass carryover parameters are 0.29 and 0.39 for STK and applied fertilizer-K, respectively, based on the results in Table 2. The Bermudagrass quadratic yield plateau function uses the parameters reported in Table 5 as the true functional form, with parameters estimated from the Slaton and Uthman (Reference Slaton and Uthman2024) data. For the 5-year NPV, the value of STK available at the start of year 6 is added Equation (3), using the STK values in year 6 reported in Table 6.
This study also conducted a sensitivity analysis comparing outcomes when the optimal fertilizer-K rate is computed using true carryover versus incorrectly assumed carryover to quantify the resulting losses (Tables 10 and 11). The cost of misspecification is asymmetric. When there is no carryover, but high carryover is assumed to find the optimal fertilizer-K rate, fertilizer-K could be over-applied, leading to substantial losses. When substantial carryover exists but none is assumed, optimal fertilizer-K is under-applied, and losses occur relative to the true optimum. However, these losses are smaller because actual carryover K partially offsets the misspecification. Nevertheless, whenever the carryover coefficient is not accurately specified, losses occur. Even when fertilizer-K prices are volatile, inaccurate carryover specification still causes losses, but the magnitude of those losses changes.Footnote 8
Five-year cost of using inaccurate STK carryover information for Arkansas Bermudagrass
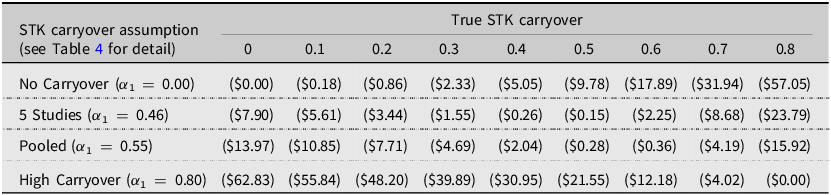
Table 10. Long description
A table comparing the cost of using inaccurate STK carryover information for Arkansas Bermudagrass. The table has 5 rows and 9 columns. The rows are labeled as No Carryover, 5 Studies, Pooled, and High Carryover. The columns are labeled with true STK carryover values ranging from 0 to 0.8. Each cell contains a cost value in USD. Row 1: No Carryover, true STK carryover values from 0 to 0.8, costs are $0.00, ($0.18), ($0.86), ($2.33), ($5.05), ($9.78), ($17.89), ($31.94), ($57.05). Row 2: 5 Studies, true STK carryover values from 0 to 0.8, costs are ($7.90), ($5.61), ($3.44), ($1.55), ($0.26), ($0.15), ($2.25), ($8.68), ($23.79). Row 3: Pooled, true STK carryover values from 0 to 0.8, costs are ($13.97), ($10.85), ($7.71), ($4.69), ($2.04), ($0.28), ($0.36), ($4.19), ($15.92). Row 4: High Carryover, true STK carryover values from 0 to 0.8, costs are ($62.83), ($55.84), ($48.20), ($39.89), ($30.95), ($21.55), ($12.18), ($4.02), ($0.00).
Notes: All units are US dollars per hectare ($/ha). A 5% discount rate (USDA-FSA, 2026) was used and α 1 is the fraction of STK retained in the next year’s STK. All values in parentheses are negative profit representing losses a producer incurs as a function of inaccurate STK carryover assumptions. Those values are calculated as the 5-year NPV difference. To compare only the costs of misspecified STK carryover assumptions, the fertilizer-K carryover rate is held constant at its true value of 0.39 across all scenarios.
Five-year cost of using inaccurate fertilizer-K carryover information for Arkansas Bermudagrass
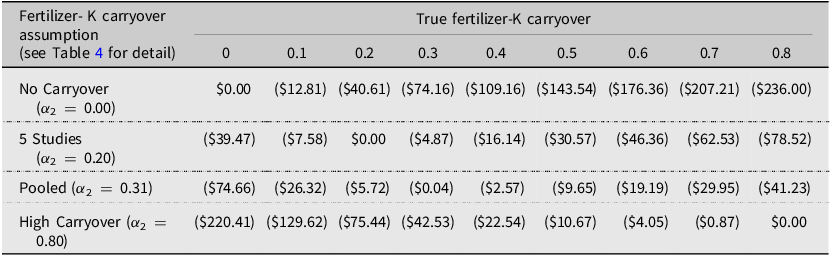
Table 11. Long description
A table comparing the cost of using inaccurate fertilizer-K carryover information for Arkansas Bermudagrass. The table has 4 rows and 9 columns. The columns are labeled with different true fertilizer-K carryover values ranging from 0 to 0.8. The rows are labeled with different fertilizer-K carryover assumptions: No Carryover, 5 Studies, Pooled, and High Carryover. Each cell contains a cost value in USD. Row 1: No Carryover, $0.00, ($12.81), ($40.61), ($74.16), ($109.16), ($143.54), ($176.36), ($207.21), ($236.00). Row 2: 5 Studies, ($39.47), ($7.58), $0.00, ($4.87), ($16.14), ($30.57), ($46.36), ($62.53), ($78.52). Row 3: Pooled, ($74.66), ($26.32), ($5.72), ($0.04), ($2.57), ($9.65), ($19.19), ($29.95), ($41.23). Row 4: High Carryover, ($220.41), ($129.62), ($75.44), ($42.53), ($22.54), ($10.67), ($4.05), ($0.87), $0.00.
Notes: All units are US dollars per hectare ($/ha). A 5% discount rate (USDA-FSA, 2026) was used and α 2 is the fraction of applied fertilizer-K retained in the soil as STK. All values in parentheses are negative profit representing losses a producer incurs as a function of inaccurate fertilizer-K carryover assumptions. Those values are calculated as the 5-year NPV difference. To compare only the costs of misspecified applied fertilizer-K carryover assumptions, the STK carryover rate is held constant at its true value of 0.29 across all scenarios.
3.7. Robustness checks
The analytical solution rests on three assumptions: that the carryover function is deterministic, that next year’s expected fertilizer-K price equals this year’s, and that STK and fertilizer-K are perfect substitutes in production. Each assumption is relaxed as a robustness check.
3.8. Numerical stochastic dynamic programming
We solve for optimal fertilizer-K numerically using stochastic dynamic programming, both to confirm the analytical solution in Equation (11) and to relax the first two assumptions of constant fertilizer cost and perfect substitution of STK and fertilizer-K (Miranda and Fackler, Reference Miranda and Fackler2002). The state is STK, discretized from 0 to 600 ppm in steps of 3 ppm, and the control is fertilizer-K on the same grid. The carryover function carries a normal shock whose standard deviation is the root mean squared error of the Bermudagrass carryover regression, 34.5 ppm. Expectations are taken by Gauss–Hermite quadrature, the value function is interpolated linearly between grid points, and the problem is solved by value function iteration.
The second version adds a stochastic fertilizer-K price. Only the ratio of the fertilizer-K price to the hay price enters the FOC, because the value function is homogeneous of degree one in the two prices. We thus model this ratio. Potash prices are from the U.S. Geological Survey Mineral Commodity Summaries and Arkansas hay prices from the USDA National Agricultural Statistics Service (2026), both nominal and both for 1991 to 2023, so the common inflation trend cancels (U.S. Geological Survey, 1991/2023). The log ratio follows a first-order autoregression with a coefficient of 0.93 (0.07) and an innovation standard deviation of 0.20. An augmented Dickey–Fuller test does not reject a unit root, and with 33 annual observations it has little power. As a result, we also report a random walk with drift, which is the same model with the autoregressive coefficient set to one. The price process is discretized to 13 states following Tauchen (Reference Tauchen1986), and the two-state problem is solved on the same STK grid.
With uncertainty in carryover alone, the policy from the numerical dynamic program is the same as the policy from Equation (11) at every level of STK, to the nearest grid point. At an interior optimum, the producer is in effect choosing total available K, so the marginal value of STK is the constant r/(1 − δ(α 1 − α 2)). A constant marginal value has an expectation that does not depend on the distribution of the shock, so the FOC is unchanged and certainty equivalence is exact rather than approximate. It fails only where the non-negativity constraint on fertilizer-K binds, which for these estimates requires STK above about 414 ppm, roughly eight standard deviations above the steady state.
Price uncertainty does change the solution, but the change is small. At the steady-state STK and the median price ratio, using Equation (7) in place of the numerical solution gives up $2.67/ha in net present value, and using Equation (6) gives up $2.63/ha. Across the whole price grid the largest amount given up is $6.52/ha for Equation (7) and $4.96/ha for Equation (6). These losses are small, equal to roughly 2–8% of the estimated $85/ha loss from ignoring carryover altogether. If the price is instead a random walk with drift, the corresponding figures at the steady state are $1.87/ha for Equation (7) and $3.11/ha for Equation (6). Equation (7) does better the closer the price is to a random walk, which is what the mechanism predicts, since with no mean reversion there is nothing for the dynamic program to exploit. Equation (6) moves the other way, because with a driftless random walk in logs the conditional mean of next year’s price exceeds the current price, so using the conditional mean over-forecasts.
Table A-5 reports the numerical policy function, optimal fertilizer-K by STK and by fertilizer-K price. A user reads a rate from the table rather than solving a dynamic program, and the rates in it are within a grid step of what Equation (11) gives.
3.9. Imperfect substitutability of STK and fertilizer-K
Equation (9) treats STK and fertilizer-K as one-for-one substitutes after conversion to common units. The soil-test-based fertilizer-recommendation development process involves two sequential steps: correlation and calibration. Correlation identifies the soil-test concentration below which crop yield is likely to respond to fertilization and estimates the probability and magnitude of that response (Slaton et al., Reference Slaton, Pearce, Gatiboni, Osmond, Bolster, Miquez and Yost2024). Calibration determines the fertilizer rate needed to optimize yield across responsive soil-test values. Calibration is less common than correlation because it requires multi-rate fertilizer trials across broad soil-test gradients, and crop response is often nonlinear. As a result, fertilizer-K recommendations are frequently based on build coefficients and estimated crop removal rather than direct calibration of fertilizer rate. Multiple-regression calibration studies in soybean illustrate the importance of this limitation. Slaton et al. (Reference Slaton, Golden, DeLong and Mozaffari2010) and Williams et al. (Reference Williams, Parvej, Holshouser, Frame and Reiter2018) showed that calibrated fertilizer-K requirements depend jointly on soil-test K and fertilizer-K rate, with nonlinear effects and interactions that vary among soil-test extractants, sampling depths, soil textures, and production environments. These studies indicate that calibrated K rates are not a simple one-to-one function of soil-test K, but instead depend on the response surface and the probability that fertilizer-K will increase yield. We do not pursue such a production function here, but the need to consider the value of carryover K in determining optimal fertilizer-K would persist.
The Bermudagrass data thus allows the assumption to be tested rather than asserted. Replacing total available K with the index K t + b ⋅ STK t , where imposed b = 1 per Equation (9), we can estimate b jointly with the rest of the yield function, resulting in an estimate of b of 0.39 with a standard error of 0.16. Perfect substitutability is rejected, with a likelihood ratio of 9.1 on one degree of freedom. Equating the two on a mass basis, which at a soil depth of 10 cm and a bulk density of 1.30 g cm−3 would be b = 1.30, fits worse than b = 1 does.
Relaxing perfect substitutability changes the shadow value of STK. Repeating the derivation in footnote 4 with the index in place of total available K gives
 ${\partial V_{t} \over \partial STK_{t}}={b\cdot r_{t} \over 1-\delta (\alpha _{1}-b\cdot \alpha _{2})}+b\cdot STK_{t}$
which is the expression in footnote 4 when b = 1. At an estimated b of 0.39 the shadow value of a ppm of STK falls from $1.01 to $0.50, and the marginal product required at the optimum rises from 11.3 to 13.6 kg of hay per kg of K. As a result, the optimal first-year fertilizer-K rate at an STK of 133 ppm falls from 281 to 262 kg K/ha, a change of 7%.
Two things temper the estimate. STK enters the yield function as the measurement carried into the season, a year before the crop it is credited toward, and the carryover function has a root mean squared error of 34 ppm against a between-plot standard deviation in STK of 69 ppm. Measurement error of that size attenuates the estimate of b toward zero such that 0.39 is better read as a lower bound on the true substitution rate than as a point estimate, and the 7% as an upper bound on the effect. The direction is clear even so. One ppm of STK carried into the season is worth less than an equal weight of fertilizer-K and treating the two as perfect substitutes puts the recommended fertilizer-K rate slightly high rather than slightly low.
4. Discussion
The analytical solution makes dynamic programming easy to implement. For example, the University of Arkansas System Division of Agriculture (2025) Potassium Rate Calculator can be converted to consider carryover by substituting the effective price for the K price in the optimal K formula.
Not considering K carryover leads to underestimating the optimal fertilizer-K application rate. In the Bermudagrass example, not accounting for K carryover in the optimal fertilizer-K application rate would lead to a profit loss of $85/ha over five years, approximately $17/ha per year. Given the average annual profit of $650 to $700/ha, the estimated loss accounts for 2–3% of Bermudagrass production as budgeted. As input prices rise or if the true carryover is larger than our estimates, the losses from ignoring carryover should increase. Of course, overestimating K carryover could reduce profit through excessive fertilizer-K application, so field- or crop-specific carryover estimates are needed.Footnote 9
Our soil-K accounting for Arkansas Bermudagrass indicates that there is a substantial portion of applied fertilizer-K that is not used by the plant and does not show up in next year’s STK. The losses of 39–49% are much higher than estimates of K leaching except in the sandiest soils with high rainfall or irrigation. The “lost” K presumably enters a soil-K reserve (non-exchangeable K), where it could become available to plants in future years. It could also be luxury consumed by the crop. Our method places no value on extra K in Bermudagrass or the potential for added nonexchangeable K to later become exchangeable.
One more question not directly addressed in this study is whether it could be economical to apply the fertilizer-K needed by future crops in advance. If prices are low, can a farmer apply the amount of fertilizer-K needed for several years at once? For example, can a farmer plant alfalfa and apply the fertilizer-K required for the next five years? Empirical estimates of fertilizer-K carryover are generally closer to zero than to one, and based on these values, the answer is no. For such a strategy to be economical, fertilizer-K would need to absorb into the soil-K reserve (non-exchangeable K) from which a large portion would later become available, yet the non-exchangeable K pool is not well understood. In addition, K may be lost through luxury consumption, lost via runoff, or suspended in recovered tailwater in irrigation systems.
The agronomy literature typically reports build coefficients (the amount of K2O applied that is needed to increase STK by one unit) and finds highly varying estimates, with large amounts of applied K becoming nonexchangeable. For example, in a laboratory experiment, Johnston et al. (Reference Johnston, Goulding and Mercer1993) reported build coefficients that would translate into carryover coefficients that varied from 0.09 to 0.56, depending on the soil used.
The estimated carryover coefficients in past literature ranged from 0.1 to 0.82, implying a number of factors such as soil characteristics, crop type, and crop history affect K carryover. When data are available, crop- and site-specific carryover should be used.
The applied fertilizer-K levels in Table 6 reach an equilibrium quickly and show a pattern more like build and maintenance than like the sufficiency approach. The equilibrium yields were 98% of the maximum yield using the 0.20 or 0.31 carryover of fertilizer-K coefficients, which is higher than the 95% rule of thumb often used for the build-and-maintain approach (Filippi et al., Reference Filippi, Gatiboni, Crozier, Osmond and Hardy2025). We recommend using the economic optimum approach used here rather than the build and maintain or sufficiency approaches.
5. Conclusion
This study has three main contributions: (i) it provides empirical estimates of K carryover, (ii) it demonstrates that considering K carryover increases expected profit and optimal K rates, and (iii) it provides a simplified solution that is more likely to be used in extension recommendations. Although results vary widely across regions and crops, K carryover is clearly not zero, averaging 20–30%, compared with roughly 80% for P.
Greater carryover makes more K available in subsequent years and lowers its effective cost, so higher fertilizer-K application rates can increase profitability. The quadratic plateau model leads to less yield losses from under-application than if a linear plateau model had been used. As a result, the economic losses from over-application can be as great or greater than those from under-application, with losses being $6/ha to $76/ha per year greater in our Bermudagrass example. While ignoring carryover led to $10/ha greater profits in the first year, multi-year returns are $85/ha higher when the true carryover coefficients are assumed. Underestimating K carryover causes the optimal fertilizer-K rate to be underestimated. That comparison is between a recommendation that accounts for carryover and one that ignores it, at a given soil-test level. Over time the potassium that carries over raises the soil test and reduces what has to be applied later, so application settles at a finite maintenance rate rather than climbing.
The simplified solution is to use the static solution to expected profit maximization and a price that is adjusted for the K savings the following year. This avoids the complexity of dynamic programming. The simplified solution assumes that carryover is deterministic and that next year’s fertilizer price will equal this year’s. Solving the stochastic dynamic programming problem numerically shows that the first assumption costs nothing, because the marginal value of soil potassium does not depend on the size of the carryover shock, and that the second costs about two to seven dollars per hectare, a small share of losses that occur when ignoring carryover. The user of the recommendation gets the simple rule, and now also knows how accurate it is.
Financial support
Cho receives funding from the South Dakota Agricultural Experiment Station, Hatch Project number SD00H846-25. Brorsen receives funding from the A.J. and Susan Jacques Chair, the Oklahoma Agricultural Experiment Station and USDA National Institute of Food and Agriculture, Hatch Project number OKL03170.
Appendix
Five-year cost of using inaccurate STK carryover information for Arkansas Bermudagrass under 20% higher input prices
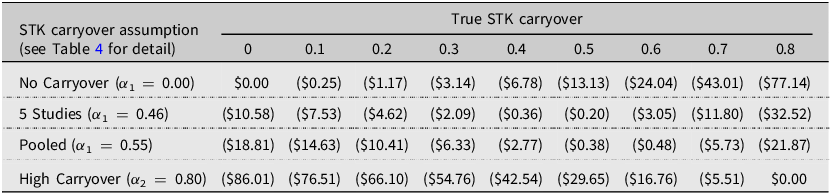
Table A1. Long description
A table comparing the five-year cost of using inaccurate STK carryover information for Arkansas Bermudagrass under 20% higher input prices. The table has four rows and nine columns. The columns are labeled with true STK carryover values ranging from 0 to 0.8. The rows are labeled with different STK carryover assumptions: No Carryover (1 = 0.00), 5 Studies (1 = 0.46), Pooled (1 = 0.55), and High Carryover (2 = 0.80). Each cell contains a value representing the cost in US dollars per hectare. Notable trends include increasing costs as the true STK carryover value increases for No Carryover and High Carryover assumptions, while the costs decrease for 5 Studies and Pooled assumptions. The values in parentheses indicate negative profit representing losses.
Notes: All units are US dollars per hectare ($/ha). A 5% discount rate (USDA-FSA, 2026) was used and α 1 is the fraction of STK retained in the next year’s STK. All values in parentheses are negative profit representing losses a producer incurs as a function of inaccurate STK carryover assumptions. Those values are calculated as the 5-year NPV difference. To compare only the costs of misspecified STK carryover assumptions, the fertilizer-K carryover rate is held constant at its true value of 0.39 across all scenarios.
Five-year cost of using inaccurate fertilizer-K carryover information for Arkansas Bermudagrass under 20% higher input prices
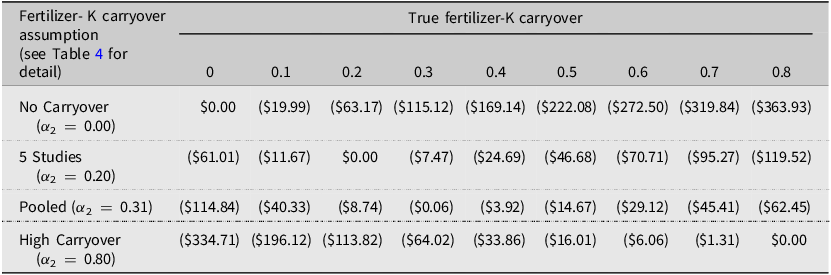
Table A2. Long description
A table with five rows and nine columns comparing the five-year cost of using inaccurate fertilizer-K carryover information for Arkansas Bermudagrass under 20% higher input prices. The columns represent true fertilizer-K carryover values ranging from 0 to 0.8. The rows represent different fertilizer-K carryover assumptions: No Carryover, 5 Studies, Pooled, and High Carryover. Each cell contains the cost in US dollars per hectare. Row 1: No Carryover, $0.00, ($19.99), ($63.17), ($115.12), ($169.14), ($222.08), ($272.50), ($319.84), ($363.93). Row 2: 5 Studies, ($61.01), ($11.67), $0.00, ($7.47), ($24.69), ($46.68), ($70.71), ($95.27), ($119.52). Row 3: Pooled, ($114.84), ($40.33), ($8.74), ($0.06), ($3.92), ($14.67), ($29.12), ($45.41), ($62.45). Row 4: High Carryover, ($334.71), ($196.12), ($113.82), ($64.02), ($33.86), ($16.01), ($6.06), ($1.31), $0.00.
Notes: All units are US dollars per hectare ($/ha). A 5% discount rate (USDA-FSA, 2026) was used and α 2 is the fraction of applied fertilizer-K retained in the soil as STK. All values in parentheses are negative profit representing losses a producer incurs as a function of inaccurate fertilizer-K carryover assumptions. Those values are calculated as the 5-year NPV difference. To compare only the costs of misspecified applied fertilizer-K carryover assumptions, the STK carryover rate is held constant at its true value of 0.29 across all scenarios.
Five-year cost of using inaccurate STK carryover information for Arkansas Bermudagrass under 20% lower input prices
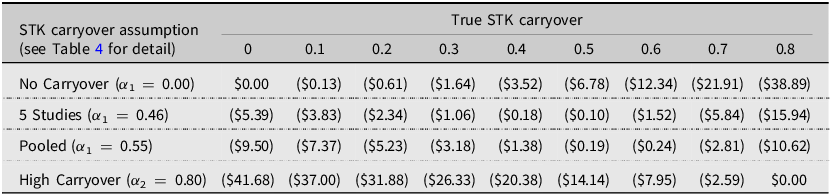
Table A3. Long description
A table comparing the five-year cost of using inaccurate STK carryover information for Arkansas Bermudagrass under 20% lower input prices. The table has four rows and nine columns. The columns are labeled with true STK carryover values ranging from 0 to 0.8. The rows are labeled with different STK carryover assumptions: No Carryover (1 = 0.00), 5 Studies (1 = 0.46), Pooled (1 = 0.55), and High Carryover (2 = 0.80). Each cell contains a value representing the cost in US dollars per hectare. Row 1: No Carryover (1 = 0.00), $0.00, ($0.13), ($0.61), ($1.64), ($3.52), ($6.78), ($12.34), ($21.91), ($38.89). Row 2: 5 Studies (1 = 0.46), ($5.39), ($3.83), ($2.34), ($1.06), ($0.18), ($0.10), ($1.52), ($5.84), ($15.94). Row 3: Pooled (1 = 0.55), ($9.50), ($7.37), ($5.23), ($3.18), ($1.38), ($0.19), ($0.24), ($2.81), ($10.62). Row 4: High Carryover (2 = 0.80), ($41.68), ($37.00), ($31.88), ($26.33), ($20.38), ($14.14), ($7.95), ($2.59), $0.00.
Notes: All units are US dollars per hectare ($/ha). A 5% discount rate (USDA-FSA, 2026) was used and α 1 is the fraction of STK retained in the next year’s STK. All values in parentheses are negative profit representing losses a producer incurs as a function of inaccurate STK carryover assumptions. Those values are calculated as the 5-year NPV difference. To compare only the costs of misspecified STK carryover assumptions, the fertilizer-K carryover rate is held constant at its true value of 0.39 across all scenarios.
Five-year cost of using inaccurate fertilizer-K carryover information for Arkansas Bermudagrass under 20% lower input prices
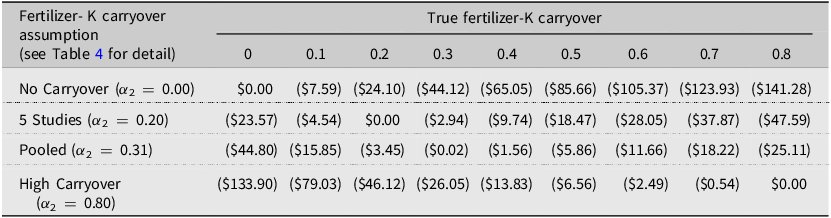
Table A4. Long description
A table comparing the five-year cost of using inaccurate fertilizer-K carryover information for Arkansas Bermudagrass under 20% lower input prices. The table has four rows and nine columns. The row labels are No Carryover (2 0.00), 5 Studies (2 0.20), Pooled (2 0.31), and High Carryover (2 0.80). The column headers are true fertilizer-K carryover values ranging from 0 to 0.8. The values in the table represent the cost in US dollars per hectare ($/ha), with negative values indicating losses. Row 1: No Carryover (2 0.00), $0.00, ($7.59), ($24.10), ($44.12), ($65.05), ($85.66), ($105.37), ($123.93), ($141.28). Row 2: 5 Studies (2 0.20), ($23.57), ($4.54), $0.00, ($2.94), ($9.74), ($18.47), ($28.05), ($37.87), ($47.59). Row 3: Pooled (2 0.31), ($44.80), ($15.85), ($3.45), ($0.02), ($1.56), ($5.86), ($11.66), ($18.22), ($25.11). Row 4: High Carryover (2 0.80), ($133.90), ($79.03), ($46.12), ($26.05), ($13.83), ($6.56), ($2.49), ($0.54), $0.00.
Notes: All units are US dollars per hectare ($/ha). A 5% discount rate (USDA-FSA, 2026) was used and α 2 is the fraction of applied fertilizer-K retained in the soil as STK. All values in parentheses are negative profit representing losses a producer incurs as a function of inaccurate fertilizer-K carryover assumptions. Those values are calculated as the 5-year NPV difference. To compare only the costs of misspecified applied fertilizer-K carryover assumptions, the STK carryover rate is held constant at its true value of 0.29 across all scenarios.
Optimal fertilizer-K Rate (kg K/ha) by soil-test potassium and fertilizer-K price, Arkansas Bermudagrass
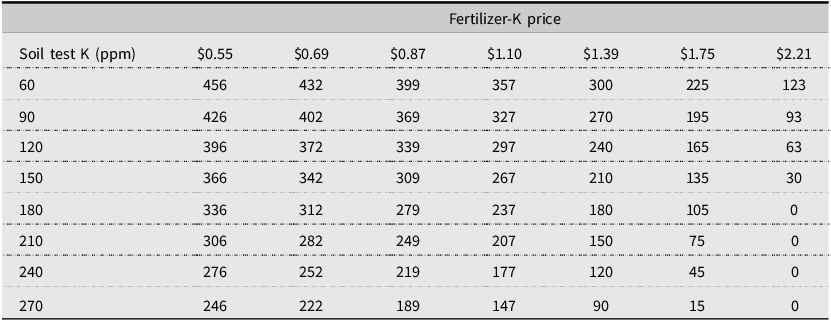
Table A5. Long description
A table comparing optimal fertilizer-K rates (kg K/ha) by soil-test potassium (ppm) and fertilizer-K price ($ per kg) for Arkansas Bermudagrass. The table has 8 columns and 10 rows, including headers. Column headers are Fertilizer-K price values: $0.55, $0.69, $0.87, $1.10, $1.39, $1.75, and $2.21. Row labels are Soil test K (ppm) values: 60, 90, 120, 150, 180, 210, 240, and 270. Each cell contains the optimal fertilizer-K rate corresponding to the intersection of soil-test potassium and fertilizer-K price. Notable trends include decreasing optimal fertilizer-K rates with increasing soil-test potassium and increasing fertilizer-K price. For example, at a soil-test potassium of 60 ppm, the optimal fertilizer-K rate decreases from 456 kg/ha at $0.55 per kg to 123 kg/ha at $2.21 per kg.
Notes: Rates are read from the policy function of the numerical dynamic program with a stochastic carryover function and a stochastic fertilizer-K price. Soil test potassium (STK) is in milligrams of K per kilogram of soil (ppm) and the fertilizer-K price is in dollars per kilogram of K. The hay price is $0.07 per kg and the discount rate is 5%. Carryover coefficients are the Bermudagrass estimates from Table 2, 0.29 on STK and 0.39 on fertilizer-K. A rate of zero means the non-negativity constraint on fertilizer-K binds. At the base price of $1.10 per kg and an STK of 133 ppm the table gives 284 kg K/ha against the 281 kg K/ha in Table 6, because here the fertilizer-K price is stochastic and mean reverting, so the expected price next year at the base node is $1.13 rather than $1.10.


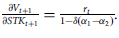
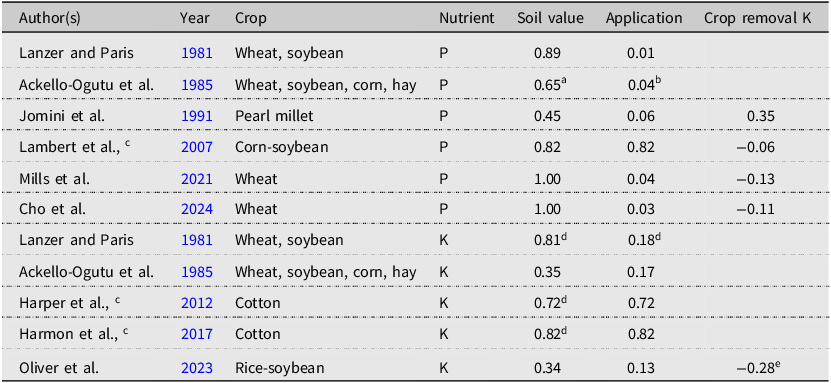
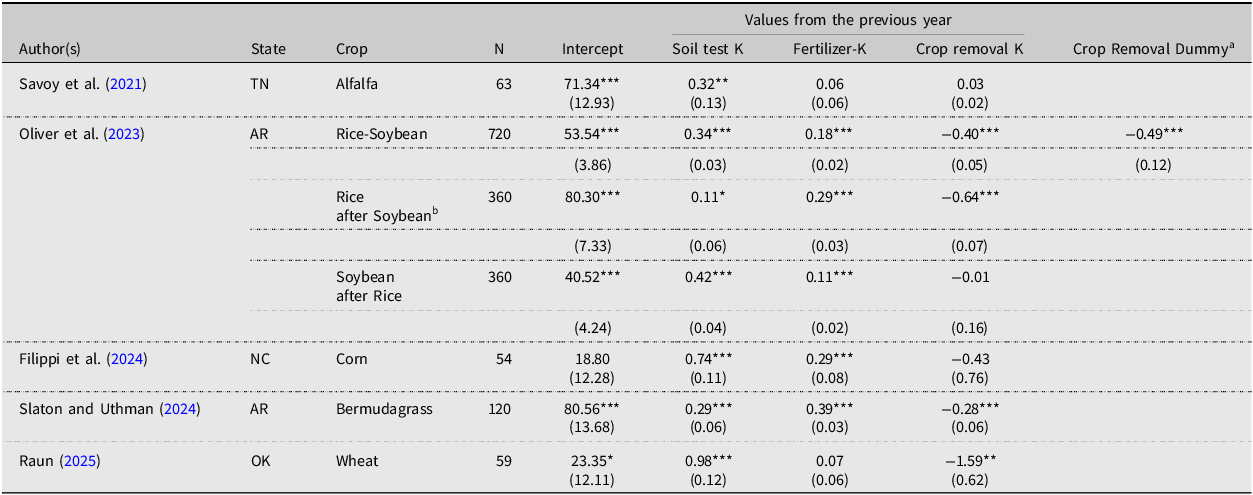
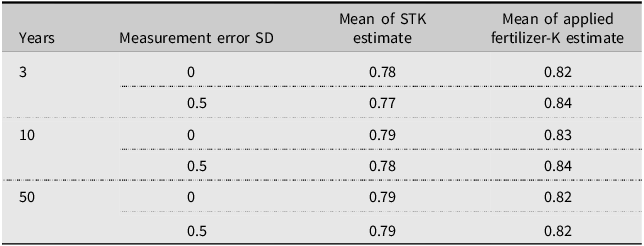
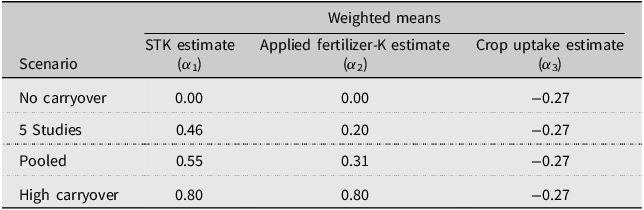
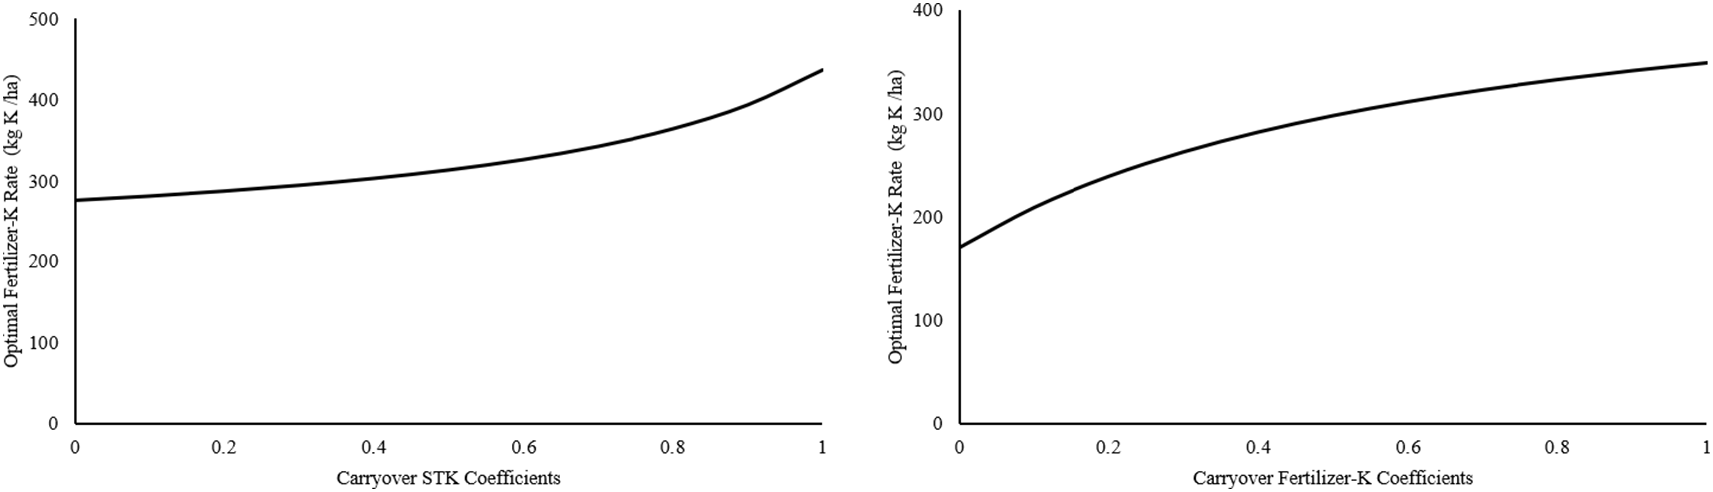
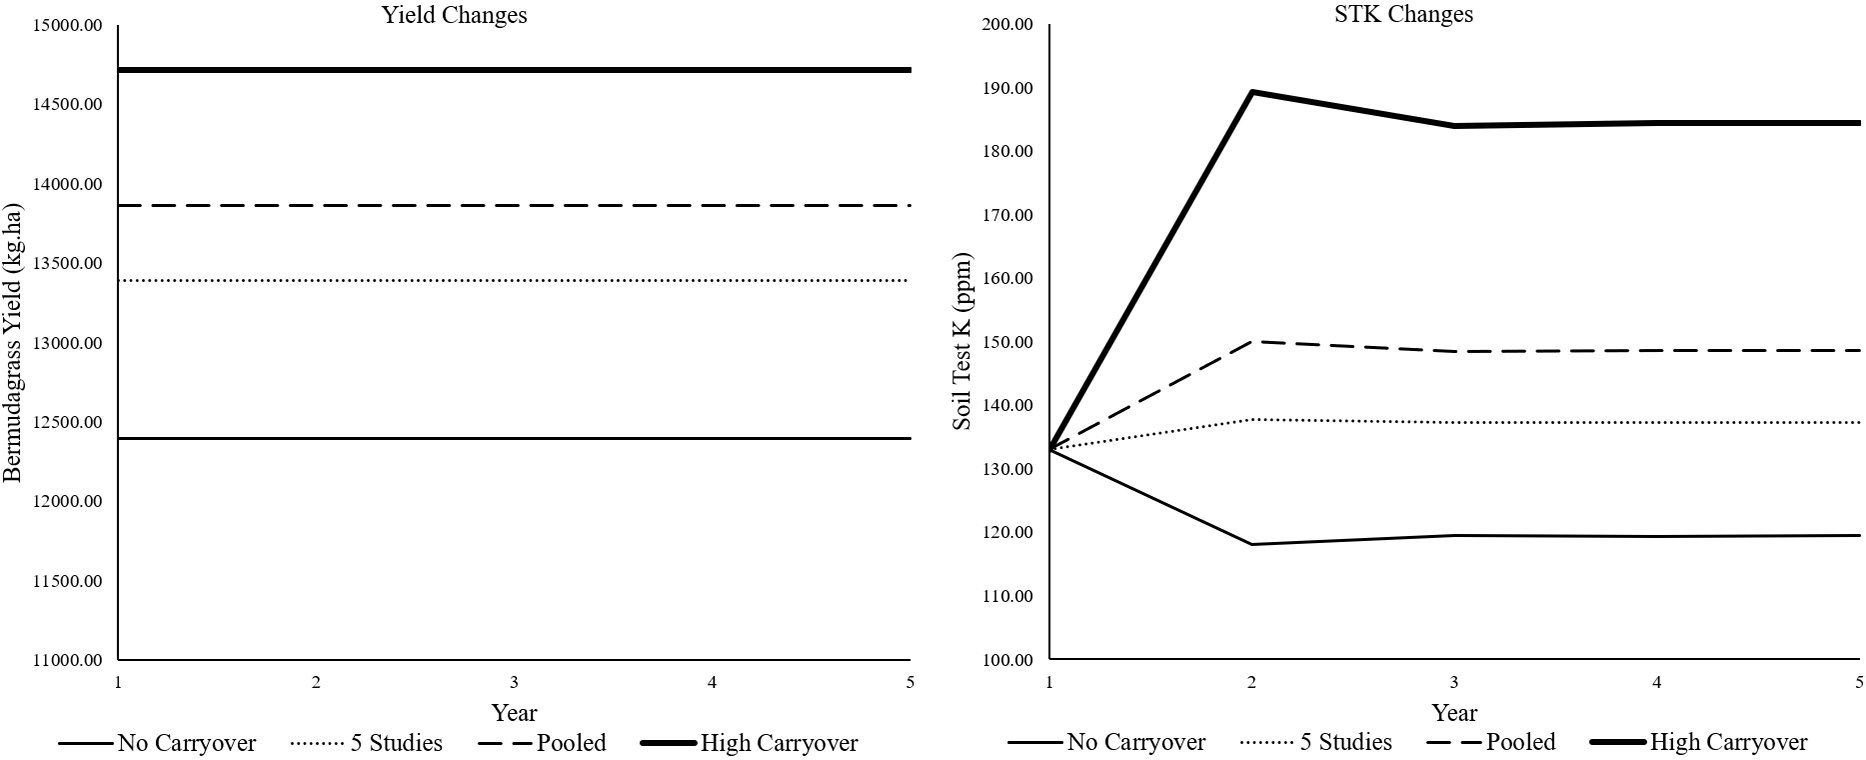
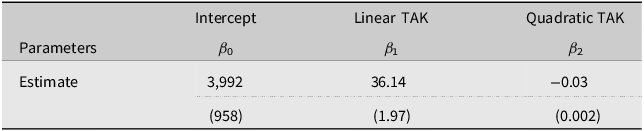
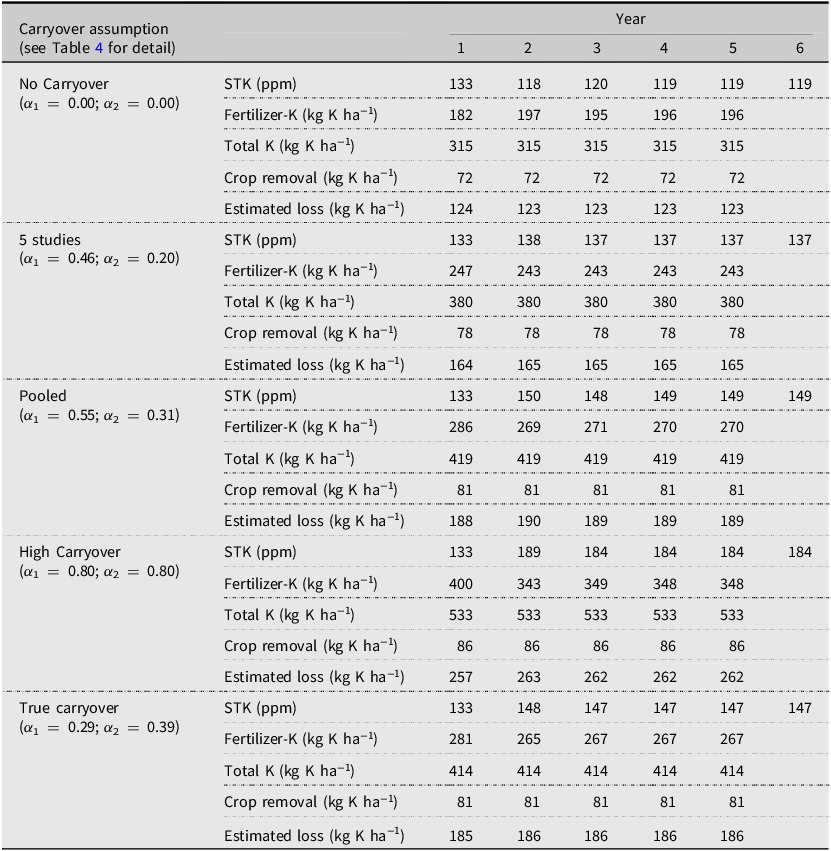
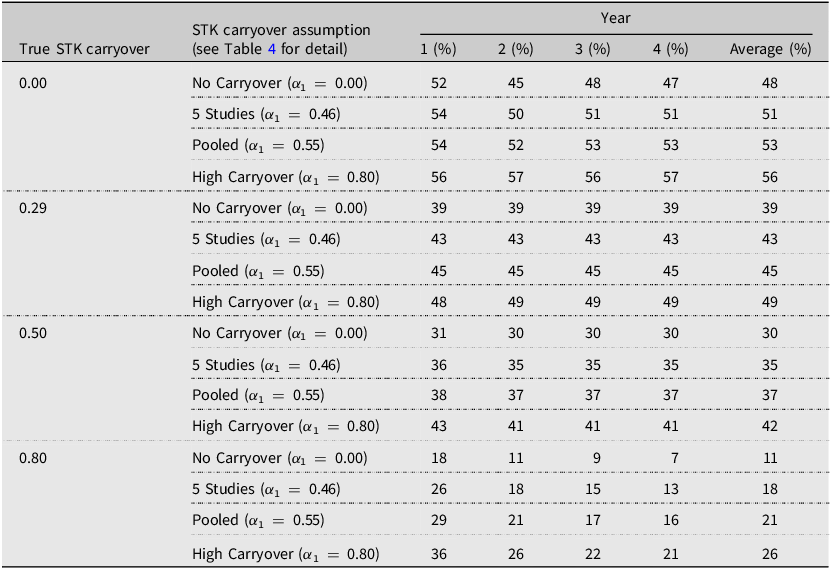
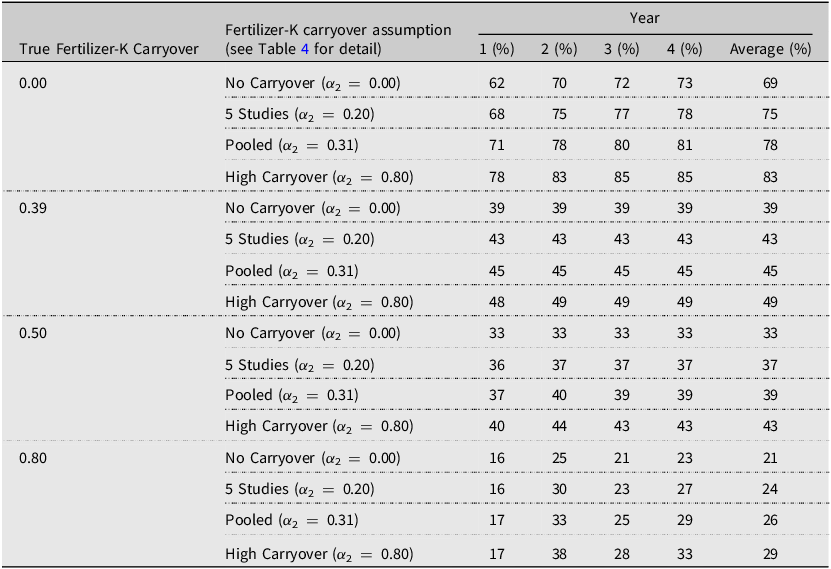
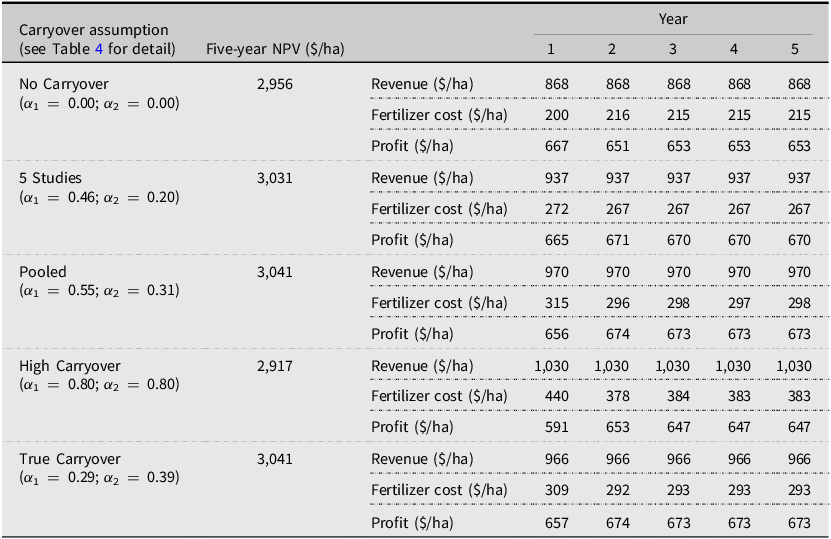
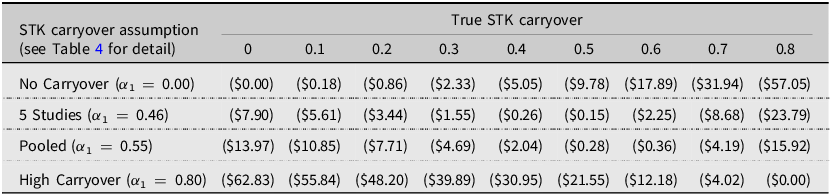
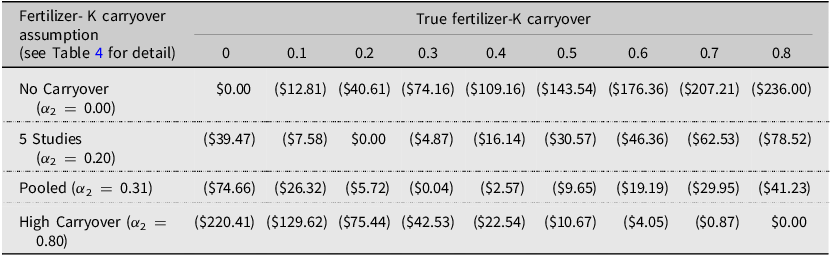
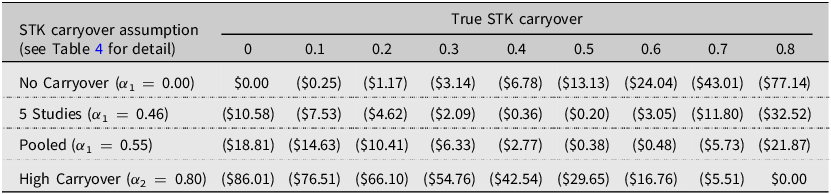
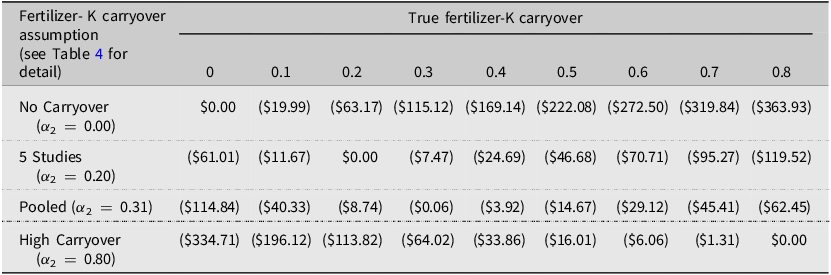
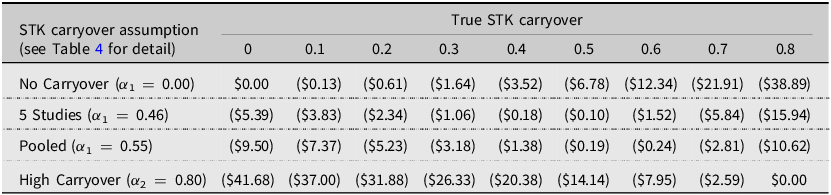
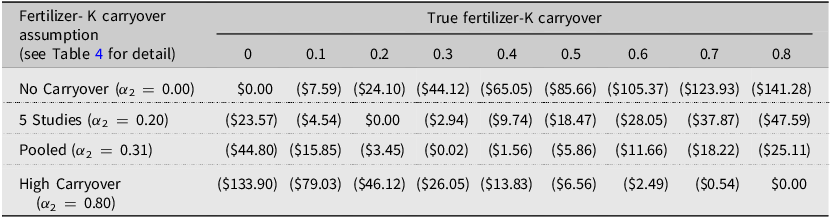
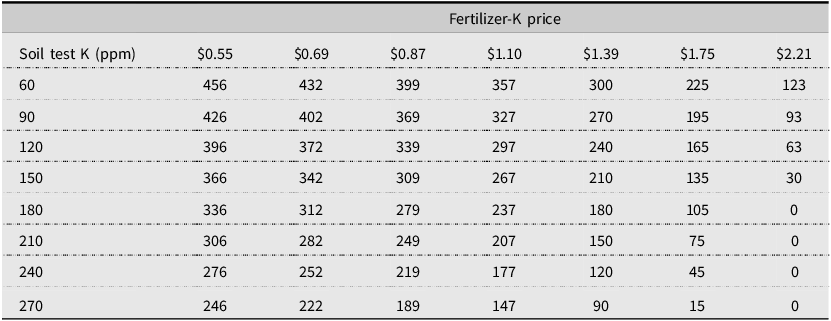

 Open access

