Implications
Milk composition and gene expression in the mammary gland tissue were evaluated in grazing dairy cows supplemented with different unsaturated fatty acids (UFA). The UFA supplementation improves the health and nutrition quality aspects of dairy milk, besides affecting the gene networks expression signature associated with cellular growth and proliferation, cell death, signaling, nutrient metabolism and immune response. This molecular knowledge on the physiology of the mammary gland might provide the basis for more detailed functional studies for future research.
Introduction
The growing awareness over the last decade of the association between diet and health has led nutritional quality to become a relevant factor in consumers’ food choices. A major development has been the recognition that certain lipids in dairy milk, such as oleic acid, some isomers of the conjugated linoleic acid (CLA) and α-linolenic acid (ALA), can improve human health status and prevent diseases (Bauman et al., Reference Bauman, Mather, Wall and Lock2006). Supplementing the diet of lactating dairy cows with different unsaturated fatty acids (UFA) is a significant attempt to improve milk fat composition for human consumption (Mansbridge and Blake, Reference Mansbridge and Blake1997; Harvatine and Bauman, Reference Harvatine and Bauman2006). Recently functional genomics studies, based on quantitative real-time polymerase chain reaction (qRT-PCR), have described the effects of dietary UFA on the expression of a number of candidate genes in the mammary gland involved in lipid metabolism (Harvatine and Bauman, Reference Harvatine and Bauman2006; Bauman et al., Reference Bauman, Perfield, Harvatine and Baumgard2008; Bionaz and Loor, Reference Bionaz and Loor2008a and Reference Bionaz and Loor2008b; Harvatine et al., Reference Harvatine, Perfield and Bauman2009; Kadegowda et al., Reference Kadegowda, Bionaz, Thering, Piperova, Erdman and Loor2009). There is significant evidence that feeding cows with UFA-rich diets reduces the mammary mRNA abundance of acetyl-coenzyme A (CoA) carboxylase (ACACA), fatty acid synthase (FASN), and stearoyl-CoA desaturase 1 (SCD1), as well as the transcription factor sterol regulatory element binding factor 1 (SREBP1) and peroxisome proliferator-activated receptor-γ (PPARG; Bauman et al., Reference Bauman, Mather, Wall and Lock2006; Thering et al., Reference Thering, Graugnard, Piantoni and Loor2009). However, information on the genome-wide expression of genes in the mammary gland tissue of dairy cows supplemented with different dietary unprotected UFA is still lacking. Therefore, it is not known yet whether dietary unprotected UFA supplementation also affects processes not related to lipid metabolism and the expression of less obvious genes.
Although qRT-PCR is a powerful approach to obtain a quantitative and highly precise estimates of gene expression; interest in microarray technologies for measuring gene expression has exploded in recent years (Sinicropi et al., Reference Sinicropi, Cronin and Liu2007). The biggest advantage of microarray technology is its unbiased approach and the large number of transcripts that can be quantified in a single experiment. Microarray studies provide the ability to monitor the genome-wide expression of genes and to discover target genes that would not have been detected by other more focussed methods (Sinicropi et al., Reference Sinicropi, Cronin and Liu2007). In addition, they provide a holistic view of the molecular events that occur when the mammary gland adapts to changes in the supply of dietary lipids, and consequent changes in the milk yield and composition through feeding strategies. Therefore, the recent development of microarray platforms for bovines in combination with bioinformatics has gained much attention in dairy science to discover genes and molecular pathways related to changes in the environment and/or phenotypic characteristics. Here, these developments have been used to determine the effects of unprotected dietary UFA from different plant oils on the global expression pattern of genes in the mammary gland tissue of grazing dairy cows in order to improve our understanding of mammary gland physiology.
Material and methods
Animals and diets
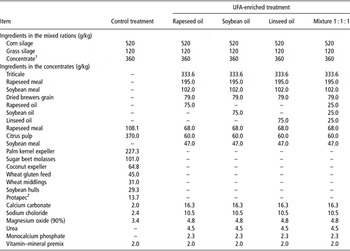
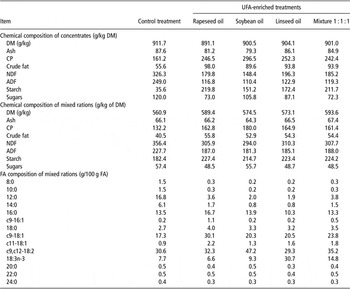
A total of 28 Holstein–Friesian dairy cows in mid-lactation were blocked according to parity (2.4 ± 0.63 births), days in milk (153 ± 32.8 days), milk yield (25.7 ± 1.08 kg/day) and milk fat percentage (4.3% ± 0.12%). Cows were then randomly assigned to treatment groups based on one of the four dietary treatments (n = 7 per dietary treatment). The dietary treatments consisted of a basal diet supplemented with either 2.7% of rapeseed oil, 2.7% of soybean oil, 2.7% of linseed oil or 2.7% of a proportional mixture of the three oils on a dry matter (DM) basis (Table 1). Rapeseed oil was chosen because it is an oil rich in c9-18:1 (oleic acid), whereas soybean oil was chosen as an oil rich in c9,c12-18:2 (linoleic acid) and the linseed oil as an oil rich in ALA. Overall, the concentration and the different oil sources used in the experiment are typically present in dairy cows rations. The oil supplements were included in the concentrate, which was fed, together with corn silage and grass silage, as a mixed ration (MR; Table 1). Corn silage, grass silage and concentrates represented 52%, 12% and 36% of the MR DM. In addition to the MR, each cow received 1 kg of a commercial standard concentrate per day through automatic feeders in the milking parlor. Cows were fed the MR indoors at night, and were grazed on pasture composed of ryegrass (Lolium perenne L.), with approximately 20% white clover (Trifolium repens L.) during the day (from 0800 h to 1600 h). The average paddock size was 5 ha and the stocking rate was 16 cows/ha. Cows were fed the MR at a level of about 14.5 kg of DM/cow per day, and grazed at a daily herbage intake of approximately 5.5 kg of DM/cow. After the first 23 days (experimental period I), all cows were switched to a control diet without oil supplementation for an additional 28 days (experimental period II; Tables 1 and 2). This design, in which, each cow got both of the intervention in sequence, was chosen because it reduces variability of gene expression between cows due to heterogeneity in genetic background, and increases the statistical power to detect differential gene expression to a specified Type I error rate. A disadvantage of this design is that the effects attributed to UFA supplementation may be confounded with effects due to difference (of 28 days) in lactation stage (see Discussion). Cows were milked twice a day in the milking parlor at the facility. Each of the four groups of cows was kept indoors in separated pens. Individual milk production and MR intake per treatment group were recorded daily during both experimental periods. The pasture intake estimation was limited by the variation in the sward heights before grazing (at 0800 h) and after grazing (1600 h) on the last 3 days of each period, using a rising plate meter (weight: 350 g, diameter: 0.5 m, standing pressure ca. 17.5 N/m2; Eijkelkamp, Giesbeek, the Netherlands). Samples of individual feedstuffs, including pasture and MR were taken during the last 3 days of the experimental periods, and were then analyzed for nutrient composition and fatty acid (FA) profile. Ingredients of the concentrates and MR are presented in Table 1, whereas chemical composition of concentrates and the chemical and FA composition of the MR are presented in Table 2. The chemical and FA composition of the pasture are presented in Table S1. In addition, on the last day of experimental periods I and II, two consecutive milk samples (0700 h and 1700 h milking) were obtained and pooled (0.6 : 0.4 ratio). One aliquot was stored at 4°C until analysis of fat, protein and lactose percentage, and another aliquot was frozen at −20°C until analysis for FA composition by gas chromatography. Fat, protein and lactose percentage was determined using mid-infrared spectrometry (International Standard Organisation (ISO) 9622, 1999; Qlip NV, Zutphen, the Netherlands).
Ingredients of the experimental diets and the concentrates offered in the mixed ration

UFA = unsaturated fatty acids.
1Including the concentrate supplied through the automatic feeding station.
2Concentrated potato fruit juice mixed with soybean hulls.
Chemical composition of the concentrates and chemical and FA composition of the mixed rations

FA = fatty acid; UFA = unsaturated fatty acids; DM = dry matter.
On the last day of both experimental periods, biopsies were carried out before the afternoon milking. A core of secretory tissue (750 to 1000 mg) of mammary tissue from each cow was obtained by surgical biopsy from the midpoint section of a rear quarter according to the method of Farr et al. (Reference Farr, Stelwagen, Cate, Molenaar, McFadden and Davis1996). The capsular end of the core was deleted to reduce the gene expression heterogeneity as a result of its greater amount of connective tissue (Farr et al., Reference Farr, Stelwagen, Cate, Molenaar, McFadden and Davis1996). Tissue biopsies were snap-frozen in liquid nitrogen and stored at −80°C until RNA extraction.
To prevent local infection, a single intramammary injection of amoxicillin and clavulic acid (Avuloxil®; Pfizer Animal Health, Capelle a/d IJssel, the Netherlands) was applied in the affected rear quarter. Furthermore, a single intramuscular dose of ceftiofur hydrochloride (Excenel®; Pfizer Animal Health, Capelle a/d IJssel, the Netherlands) was given immediately after the biopsy. Within 2 h of the biopsy, cows were machine-milked and hand-stripped as needed to remove all intramammary blood clots, according to the method of Farr et al. (Reference Farr, Stelwagen, Cate, Molenaar, McFadden and Davis1996). This experiment was conducted at the Cranendonck Research Farm, the Netherlands, between September 26 and November 14, 2007, and procedures were approved by the Animal Care and Ethics Committee of Wageningen UR Livestock Research, Lelystad (the Netherlands).
Chemical analysis
Composite samples of feeds from the last 3 days of each experimental period were analyzed for DM content (ISO 6496, 1998), ash (ISO 5984, 2002), Kjeldahl N (ISO 5983, 2005), ADF (Van Soest, Reference Van Soest1973) and NDF according to a modified method of Van Soest et al. (Reference Van Soest, Robertson and Lewis1991) with additional incubations in α-amylase and protease as described by Goelema et al. (Reference Goelema, Spreeuwenberg, Hof, Poel and Tamminga1998). Crude fat was determined by Berntrop method with acid hydrolysis (ISO 6492, 1999).
FA analysis
The FA of milk and feedstuffs were extracted with chloroform–methanol (2 : 1, v/v) and transesterified to fatty acid methyl esters (FAME) by vortexing with sodium methanolate in methanol (30%). Then, FAME were used for gas chromatography analysis (Trace GC Ultra, Waltham, MA, USA). Specific details with regard to the analysis of FA in milk and feedstuffs are presented in the Supplementary materials. The proportion of de novo synthesis of FA was estimated based on the assumption that all FAs from 4-carbon to 14-carbon and only 50% of 16-carbon FAs were synthesized by the mammary gland (Delamaire and Guinard-Flament, Reference Delamaire and Guinard-Flament2006). In addition, the proportion of long-chain fatty acid (LCFA) was calculated by the sum of 50% 16-carbon and all the 18- to 24-carbon FA (Delamaire and Guinard-Flament, Reference Delamaire and Guinard-Flament2006).
RNA isolation, processing and microarray analysis
Total RNA from mammary gland tissue (50 to 100 mg) was isolated using TRIzol reagent (Invitrogen, Breda, the Netherlands), following the manufacturer's instructions. The RNA purity and concentrations were determined using a NanoDrop ND-1000 spectrophotometer (Isogen, Maarssen, the Netherlands), and the RNA quality was assessed using the BioAnalyzer 2100 (Agilent Technologies, Amsterdam, the Netherlands). The RNA was judged as suitable for array hybridization because they showed intact bands corresponding to the 18S and 28S ribosomal RNA subunits, displayed no RNA degradation products, and presented an average RNA integrity number of 8.32 ± 0.05. The RNA of each biopsy was amplified, biotin-labeled and hybridized to single dye Affymetrix GeneChip® Bovine Genome Array (no. 900493) by ServiceXS (Leiden, the Netherlands), as described in the users’ manual (Affymetrix GeneChip® Expression Analysis Technical Manual, Santa Clara, CA, USA). As the factorial design and analysis of the microarray experiment is a reliable method to identify the influence of multiple factors on the expression profiles of the probe sets in the microarray (Xu and Faisal, Reference Xu and Faisal2010), a total of 56 one-color arrays were prepared, one array per RNA sample. Briefly, total RNA (2 μg per sample) was reverse transcribed to cDNA using a T7-oligo(dT) primer. Following second strand cDNA synthesis, the double-stranded cDNA was purified as a template for the subsequent in vitro transcription reaction. Linearly amplified biotin-labeled cRNA was synthesized in the presence of a biotin-labeled nucleotide analog/RNA mix. The labeled cRNA was purified, fragmented and hybridized to the arrays at 45°C for 16 h with constant rotational mixing at 60 r.p.m. Washing and staining of the arrays was carried out using the Affymetrix GeneChip® Fluidics Station 450 (Santa Clara, CA, USA). The arrays were scanned using an Affymetrix GeneChip® Scanner 7G (Santa Clara, CA, USA) and Affymetrix GeneChip® Operating Software version 1.4, following the GeneChip's specifications. After scanning, the Affymetrix GeneChip Command Console Software automatically acquired and analyzed image data and computed an intensity value for each probe cell. A number of quality control parameters associated with assay and hybridization performance were closely monitored. Specific details with regard to these quality control parameters are presented in the Supplementary materials.
Validation of differential gene expression by qRT-PCR
In order to validate microarray analysis, the following four genes measured by microarray analysis were confirmed by qRT-PCR: FASN, fatty acid desaturase 1 (FADS1), fatty acid desaturase 3 (FADS3) and SCD1. Briefly, reverse transcription of 1 μg of the isolated total RNA (see section ‘RNA isolation, processing and microarray analysis’) was performed in a 20-μl reaction using Superscript III reverse transcriptase (Invitrogen, Breda, the Netherlands), deoxynucleosides (Roche Diagnostics, Almere, the Netherlands) and random hexamer primers (Roche Diagnostics, Almere, the Netherlands) for 1 h at 50°C according to the manufacturer's protocol (Invitrogen, Breda, the Netherlands). Templates were amplified after a preincubation for 10 min at 95°C, followed by amplification for 40 cycles (10 s at 95°C, 5 s at 60°C and 5 s at 72°C) on a LightCycler 1.2 Real-Time PCR System by using FastStart DNA Master SYBR Green I reagents (Roche Diagnostics, Almere, the Netherlands). All reactions revealed a single product as determined by melting curve analysis. Quantitative measurement was taken by establishing a linear amplification curve from serial dilutions of cDNAs for corresponding genes, and efficiencies of the used sets of primers were calculated to be at least 95%. Values were calculated according to the comparative threshold cycle method using 18SRNA as the endogenous reference gene.
Microarray data analysis
All microarray analysis including preprocessing, normalization and statistical analysis was carried out using Bioconductor packages (version 2.5) in R programming language (version 2.11). Data were quality assessed before and after normalization using a number of built-in quality control methods implemented in the Bioconductor affycoretools and associated packages to identify eventual irregularities of array hybridization, RNA degradation and data normalization.
Arrays were considered to be of sufficient quality when they showed not more than 10% of specks in Bioconductor's Fitting Probe Level Model (fitPLM) images, were not deviating in RNA degradation and density plots, and were not significantly deviating in Normalized Unscaled Standard Errors Plot and in Relative Log Expression plots (data not shown). Upon rigorous examination of the resulting diagnostic plots, all 56 microarrays were included in further analysis. Affymetrix GeneChip® uses a set of 11 to 20 oligonucleotide probes, each 25 bases long, to represent a single gene (Gautier et al., Reference Gautier, Cope, Bolstad and Irizarry2004). The expression level for a single gene is the summary of the data from the entire probe set (Gautier et al., Reference Gautier, Cope, Bolstad and Irizarry2004). In this study, the expression levels of probe sets were summarized using the library GeneChip content-corrected robust multichip average algorithm ( Wu et al., Reference Wu, Irizarry, Gentleman, Martinez-Murillo and Spencer2004), employing the empirical Bayes approach for background correction followed by quantile normalization. As many of the original annotations for the Affymetrix GeneChip® Bovine have been found to be erroneous (Gautier et al., Reference Gautier, Cope, Bolstad and Irizarry2004), a custom chip definition file (CDF; Bovine_Bt_REFSEQ version 12.0.0), available at http://brainarray.mbni.med.umich.edu/Brainarray/Database/CustomCDF/12.0.0/refseq.asp was used to re-annotate the probes to new probe sets. Therefore, the original probe set definitions were discarded and all probes were recomposed into new probe sets by mapping each probe via their sequence to unique genes available in Refseq genomics resources. As these custom CDFs are based on the latest genomic knowledge, the newly defined probe sets perform better, and allow for more reliable comparison of gene expression. In addition, as genes are uniquely represented in a custom CDF, bias toward genes represented by multiple probe sets is avoided in gene-set enrichment (de Leeuw et al., Reference de Leeuw, Rauwerda, Jonker and Breit2008). This resulted in gene expression values for 11 495 known genes with unique identifiers from 24 128 transcripts. All microarray experiment data are MIAME (Minimum Information About a Microarray Experiment) compliant and has been deposited in gene expression omnibus (GEO; http://www.ncbi.nlm.nih.gov/geo/; accession numbers GSE20909).
Statistical analyses
Milk yield and composition, as well as FA composition, were analyzed using a mixed-effects ANOVA (release 9.1; Statistical Analysis Software Institute Inc. Cary, NC, USA). The model included UFA sources, UFA supplementation (experimental periods), and the interaction between UFA sources and UFA supplementation (experimental periods), as fixed effects and cow within pen as a random effect. When differences between UFA sources were significant (P < 0.05), Tukey's test was used to compare means. The same model was used to analyze gene expression. The mixed-effects ANOVA was chosen because when there are more than two conditions to compare, the application of ANOVA F-test is much powerful than a t-test (Cui and Churchill, Reference Cui and Churchill2003). ANOVA considers the variability of the expression levels within and among treatments. If the variability of the expression of a gene among treatments is substantially greater than the variability within treatments, this indicates that the gene is differentially expressed. Lastly, the mixed-effects ANOVA allows to treat the cow as a random effect, which captures variability between individual cows within the same condition (Churchill, Reference Churchill2004). Ollier et al. (Reference Ollier, Leroux, de la Foye, Bernard, Rouel and Chilliard2009) also analyzed genome-wide expression in the mammary gland of goats fed with diets differing in forage-to-concentrate ratio supplemented or not with lipids by ANOVA, including diet, period and animal group effects. However, in our study, the expression of genes in mammary gland was not significantly affected by the different dietary unprotected UFA sources. Therefore, this unstatistically significant variable and the interaction between UFA sources and UFA supplementation (experimental periods) were removed from the model. The final statistical model included UFA supplementation (experimental periods) as fixed effect and cow as a random effect. The P-values were corrected for multiple testing using a false discovery rate (FDR) method, which provides an estimate of the fraction of false discoveries among the significant terms (Bunger et al., Reference Bunger, van den Bosch, van der Meijde, Kersten, Hooiveld and Muller2007). The list of differentially expressed genes was generated using a FDR < 5% (q-value <0.05) together with an absolute fold change (FC) threshold of 1.3. In addition, three complementary methods were applied to relate changes in gene expression to functional changes. One method, provided via the ErmineJ software program, was based on overrepresentation of gene ontology (GO) terms (Lee et al., Reference Lee, Braynen, Keshav and Pavlidis2005). Another approach was the gene-set enrichment analysis (GSEA). The GSEA derives its power by focusing on gene sets, that is, groups of genes that share common biological functions (e.g. biochemical, metabolic or signal transduction routes), chromosomal location or regulation. The GSEA method first calculates an enrichment score (ES) that reflects the degree to which a set of genes is overrepresented at the extremes (top or bottom) of the entire list of genes. Then after, it estimates the significance level of ES by using an empirical phenotype-based permutation test procedure that preserves the complex correlation structure of the gene expression data, and lastly there is an adjustment for multiple hypothesis testing (Subramanian et al., Reference Subramanian, Tamayo, Mootha, Mukherjee, Ebert, Gillette, Paulovich, Pomeroy, Golub, Lander and Mesirov2005). Gene set size filter considered a minimum of 15 and a maximum of 500 genes, and the number of permutation was set to 1000. Gene sets were considered significantly enriched at a FDR < 5%. Normalized enriched scores of significantly enriched pathways were calculated. Both applied methods have the advantage that it is unbiased, because no gene selection step is used, and a score is computed based on all genes in a GO term or gene set. The last method used the Ingenuity Pathways Analysis (IPA; version 5.5, Ingenuity Systems, Redwood City, CA, USA) to identify the relevant molecular and cellular functions, canonical pathways, biological functions and the biological interaction networks among significant genes. For IPA analysis, the data set containing gene identifiers and corresponding to an absolute threshold of FC of 1.3 and FDR q-values <0.05 was uploaded into the application. Each identifier was mapped to its corresponding gene object in the Ingenuity knowledge base. To study the biological interaction networks, genes were overlaid onto a global molecular network developed from information contained in the Ingenuity Pathways Knowledge Base. Networks of these genes were then algorithmically generated based on their connectivity. Network analysis returns a score that ranks networks according to their degree of relevance to the network eligible molecules in the data set (Calvano et al., Reference Calvano, Xiao, Richards, Felciano, Baker, Cho, Chen, Brownstein, Cobb, Tschoeke, Miller-Graziano, Moldawer, Mindrinos, Davis, Tompkins and Lowry2005). The network score is based on the hypergeometric distribution and is calculated with the right-tailed Fisher's exact test. The score is the negative log of this P-value. A score of 1.3 thus indicates a P-value of 0.05 and is considered statistically significant. Only those molecules that show relationships to other genes, proteins or endogenous chemicals were integrated into the analysis.
Results
DM intake, milk production and composition
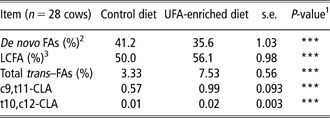
Total estimated MR intake was 12.5 ± 1.50 kg/day when cows were fed with control diet and 14.7 ± 1.50 kg/day when cows were supplemented with UFA. Total DM intake (DMI) was 15.1, 14.4, 14.5 and 14.7 kg/day for diets enriched with rapeseed oil, soybean oil, linseed oil and a proportional mix of them all, respectively, but the differences in DMI could not be statistically evaluated as intake was not determined per individual animal. Average pasture intake was 5.80 ± 0.5 kg/day for cows fed on control diet and 5.52 ± 0.5 kg/day for cows fed on UFA-enriched diet. The milk yield was 15% greater (P < 0.05) when supplementing dairy cows with UFA (27.6 ± 1.26 kg/day) relative to the same cows fed the control diet (23.4 ± 1.26 kg/day), irrespective of the UFA source (P > 0.10). Milk fat and protein yield did not differ between treatments (1.00 ± 0.05 and 0.91 ± 0.05 kg/day, respectively). Although lactose yield was greater (P < 0.01) for cows fed on UFA-enriched diet (1.21 ± 0.04 kg/day) compared with cows fed on control diet (1.02 ± 0.04 kg/day), the total milk fat percentage was lower by over 20% (3.59% v. 4.30% ± 0.60%; P < 0.05) and protein percentage was lower by over 6% (3.51% v. 3.75% ± 0.41%; P < 0.05) for the same comparison. Lactose content was not different among treatments (4.37% ± 0.05%). In addition, throughout supplementation of dietary UFA, the proportion of de novo FA decreased (P < 0.001), and the proportion of LCFAs and trans-18 FA in the milk increased (P < 0.001; Table 3). Further information of dietary effects on milk FA profiles are given in the Supplementary materials (Table S2 and Table S3).
FA profile of milk when comparing dairy cows supplemented with UFA relative to the same cows fed a control diet

FA = fatty acid; UFA = unsaturated fatty acids; LCFA = long-chain FA; CLA = Conjugated linoleic acid.
1P-value = effect of UFA supplementation; *** levels of significance indicate P < 0.001.
2De novo FAs include all FAs from 4-C to 14-C and only 50% of 16-C FA.
3LCFA include all FAs with >18-C.
Differential expression of genes in the mammary gland
We identified a total of 972 genes differentially expressed in the mammary gland tissue of cows fed on a diet supplemented with UFA compared with the same cows receiving the control diet. The list of differentially expressed genes was generated using a cut-off of FDR q-values <0.05 together with an absolute FC threshold of 1.3 and further refined by selecting those probe sets mapping to unique Entrez Gene identifiers. The gene identification, symbol and description of these genes are shown in Supplementary material (Table S4). Within these 972 genes, 312 upregulated and 660 downregulated genes were found when cows were supplemented with UFA compared with when cows were fed the control diet. As gene expression was not significantly affected in mammary gland of cows fed on diets differing in the sources of dietary unprotected UFA sources, we focused on the effect of UFA supplementation (experimental period) on gene expression in the mammary gland tissue, instead of the effect of different UFA sources. To validate the microarray gene expression data, mammary gland tissue RNA samples were analyzed by qRT-PCR for the genes FASN, FADS1, FADS3 and SCD1. The qRT-PCR results confirmed the microarray expression levels for the selected genes (Supplementary material, Table S5). In addition, correlations between qRT-PCR and microarray gene expressions was consistently high, with most genes having r 2 values >0.70.
Functional clustering of differential expressed genes in the mammary gland
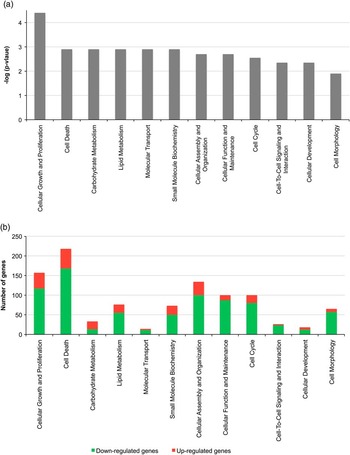
To gain insight into the mammary gland tissue processes that were altered during UFA supplementation, we tested the list of differentially expressed genes using GO term enrichment analysis (Supplementary material; Table S6), GSEA (Supplementary material; Table S7) and IPA (Figure 1). One major finding of all these approaches was that UFA supplementation mainly reduces expressions of genes involved in cellular growth and proliferation, cytoskeleton organization and cellular homeostasis, apoptosis, nutrient metabolism, as well as molecular transport and defense response (Figure 2a). Most of the genes included in these molecular and cellular functions were downregulated during UFA supplementation (Figure 2b). A specific examination of the lipid metabolism IPA molecular and cellular function revealed that the SREBP1 was downregulated during UFA supplementation (Table 4). Consequently, the expression of gene sets regulated by SREBP1 were also downregulated (Table 4).
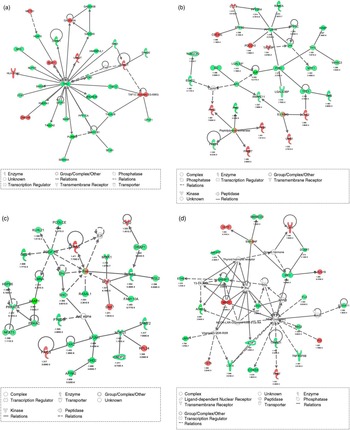
Ingenuity Pathways Analysis (IPA) networks detected when comparing dairy cows supplemented with unsaturated fatty acid relative to the same cows fed a control diet. (a) IPA network 1 included genes involved in cell cycle, cancer, cellular assembly and organization and presented a score of 46 and 33 focus genes; (b) IPA network 2 included genes involved in cell-mediated immune response, cellular development and amino acid metabolism, with a score of 43 and 30 focus genes; (c) IPA network 3 included genes involved in skeletal and muscular disorders, cell death, dermatological disease, with a score of 40 and 28 focus genes; and (d) IPA network 4 included genes involved in connective tissue development and function, as well as tissue morphology and antigen presentation, with a score of 35 and 24 focus genes. The network displayed graphically as nodes (gene/gene products) and edges (the biological relationship between nodes). The node color intensity indicates the expression of genes: red upregulated, green downregulated in animals supplemented with UFA relative to the same cows fed a control diet. The shapes of nodes indicate the functional class of the gene product. The fold value and false discovery rate q-values are indicated under each node.

(a) Molecular and cellular functions significantly modulated in the mammary gland tissue when comparing dairy cows supplemented with unprotected unsaturated fatty acids (UFAs) relative to the same cows fed control diet. Statistical significance of pathway modulation was calculated via a right-tailed Fisher's Exact test in Ingenuity Pathway and represented as –log (P-value): −log values exceeding 1.30 were significant false discovery rate q-values <0.05. (b) The downregulated and upregulated genes for each molecular pathway are presented. The color intensity indicates the expression of genes: red upregulated, green downregulated in animals supplemented with UFA relative to the same cows fed a control diet.

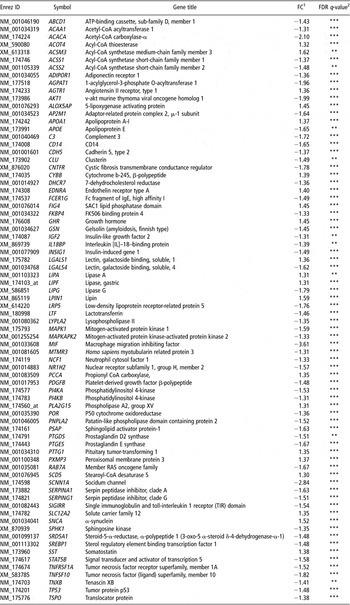
Lipid metabolism genes in mammary gland when comparing dairy cows supplemented with UFA relative to the same cows fed a control diet. Lipid metabolism genes were identified by Ingenuity Pathways Analysis and they presented an absolute FC threshold of 1.3 and a FDR <5%

UFA = unsaturated fatty acid; FC = fold change; FDR = false discovery rate; CoA = coenzyme A.
1FCs were calculated considering gene expression when cows were fed with UFA-enriched diet compared with the same cows fed control diet.
2FDR q-value = effect of UFA supplementation.
**, *** levels of significance indicate P < 0.01 and P < 0.001, respectively.
Interestingly, the canonical signaling pathways significantly modulated in the mammary gland tissue of dairy cows fed on diets supplemented with UFA relative to the same cows fed on control diet were mainly involved in cellular growth, proliferation and development or immune system response (Supplementary material; Figure S1). Those pathways associated with cellular growth, proliferation and development, included the mammalian target rapamycin (mTOR) signaling pathways, the Janus kinases and signal transfers and activators of transcription (JAK/STAT) signaling pathways, as well as the granulocyte-macrophage colony-stimulating factor (GM-CSF) pathway (Supplementary material; Figure S2a). Most of the genes included in these canonical pathways were downregulated during UFA supplementation (Supplementary material; Figure S2b). In addition, the main canonical pathways involved in immune response were related to interleukin (IL) IL-2, IL-3, IL-8 and IL-6 signaling, as well as natural killer cell signaling (Supplementary material; Figure S3a). Remarkably, most of these canonical pathways included downregulated genes when cows were supplemented with UFA compared with when cows were fed with control diet (Supplementary material; Figure S3b).
The IPA networks with the highest significance score (network score ⩾35) are represented in Figure 1a to d. The first network (Figure 1a) presented a score of 46 and 33 focus genes. The major node that was identified during UFA supplementation: tumor protein P53 (P53), is a key transcription factor associated with mammary development in ruminants (Piantoni et al., Reference Piantoni, Bionaz, Graugnard, Daniels, Akers and Loor2008). The second network (Figure 1b), having a score of 43 and 30 focus genes, indicated gene clusters centred on the serine/threonine-protein phosphatase 2A, and peptidylprolylisomerase. This network presents functions related to immune response, cellular development and amino acid metabolism. The third IPA network (Figure 1c), having a score of 40 and 28 focus genes, centred on Ras. Members of the Ras family of small GTPases function downstream of mitogenic growth factor receptors and interact with a number of effectors to regulate cell proliferation and survival (Swarbrick et al., Reference Swarbrick, Roy, Allen and Bishop2008). The last network (Figure 1d) involved genes associated with connective tissue development and function, as well as tissue morphology and antigen presentation, with a score of 35 and 24 focus genes. Figure 1d shows how UFA supplementation could be related to genes that modulate the nuclear factor kappa-light-chain-enhancer of activated B cells (NFκB), which is a transcription regulator of genes encoding cytokines, cytokine receptors and cell adhesion molecules that drive immune and inflammatory responses (Sigal, Reference Sigal2006).
Discussion
Milk production and composition
Our study suggests that supplementing grazing dairy cows with different unprotected UFA sources increases the milk yield by 15%. This is in agreement with the study of Bu et al. (Reference Bu, Wang, Dhiman and Liu2007), who reported that supplementing basal diet with either 4.0% soybean oil, 4.0% linseed oil or 2.0% soybean oil and 2.0% linseed oil, resulted in a milk yield increase of 16.7% compared with the control treatment. The greater energy density, protein content and starch content in the enriched-UFA diet could have increased the availability of glucose precursors for lactose synthesis in the mammary gland. This, followed by the reduced NDF content, probably stimulated milk production. However, because the control period was conducted 28 days after UFA supplementation, the effects attributed to diet supplemented with UFA may be confounded with effects due to a difference of 28 days in lactation stage. Therefore, isolation of the specific effects of UFA supplementation on milk production and composition may be complex and challenging to draw clear conclusions.
The reduction in milk fat and protein percentage in cows fed with UFA supplementation most likely resulted from a dilution effect. However, the decreased milk fat and protein contents, without modifications in lactose content, were coupled with the decreased expression of genes associated with the transport processes of nutrients, and with the reduction of fat, and protein metabolism (see section ‘Effects of UFA supplementation on nutrient metabolism’). Therefore, these results suggested that the modification of milk components cannot be only accounted for the increase in milk production but also for the decreased activities per cell. Interestingly, the performance of cows fed on different plant oil treatments were the same, suggesting that oils rich in oleic (rapeseed oil), linoleic (soybean oil), ALA (linseed oil) affected the performance of animals in a similar way. Furthermore, cows fed on diets supplemented with different unprotected UFA sources had increased proportion of LCFA and c9,t11-CLA in milk but reduced de novo FA synthesis, which in turn, improved the nutrition quality aspects of their milk (Table 3, S2 and S3). It is well established that feeding dairy cows with plant oils results in a reduction in the de novo FA, and increases LCFA (Bauman and Griinari, Reference Bauman and Griinari2003; Bernard et al., Reference Bernard, Leroux and Chilliard2008; Thering et al., Reference Thering, Graugnard, Piantoni and Loor2009). Altered fermentation of these plant oils results in rumen outflow of unique biohydrogenation intermediates, some of which reduce lipid synthesis in the mammary gland (Bauman and Griinari, Reference Bauman and Griinari2003; Bauman et al., Reference Bauman, Perfield, Harvatine and Baumgard2008). In particular, the trans-18:2 FA has emerged as an important factor associated with the inhibition of de novo FA synthesis (Bauman et al., Reference Bauman, Mather, Wall and Lock2006; Harvatine et al., Reference Harvatine, Perfield and Bauman2009).This study found similar results. Therefore, it is likely that in our study the different unprotected UFA sources had undergone ruminal biohydrogenation, increasing the trans-FA and CLA isomers reaching the mammary gland, which could be considered as an important factor in the inhibition of the milk synthesis of de novo FA proportion in milk. These observations, together with several gene expression effects (see section ‘Effects of UFA supplementation on nutrient metabolism’) are the major factors in leading us to believe that the dietary UFA supplementation, together with the higher energy and protein content, was indeed the main factor affecting milk yield and composition, rather than the lactation stage.
Differential gene expression of genes in the mammary gland
A total of 972 genes were differentially expressed in the mammary gland tissue when supplementing grazing dairy cows with UFA compared with when cows were fed with a control diet, suggesting a large degree of transcriptomic adaptation to the dietary UFAs. Similar to the milk production and composition variables, we acknowledge that the effects of UFA supplementation on gene expression might be confounded by lactation stage, but also by the different amount of dietary protein and energy that was utilized by the cow. There are no studies that report the effects of varying dietary protein and energy levels on the genome-wide expression in the mammary gland of dairy cows. Further, there are no studies that describe the genome-wide expression in the mammary gland of mid-lactation cows. However, Bionaz and Loor (Reference Bionaz and Loor2008b) observed that the expression of 45 genes associated with lipid synthesis and with well-defined roles in mammary lipid metabolism peaked at 60 days post partum, and thereafter, their mRNA abundance decreased following the lactation curve. As the mRNA expression of most of the genes in our study presented different pattern from the so-called lactation curve, it may be assumed that there is an effect of enriched-UFA diet on their expression. Surprisingly, expressions of genes in the mammary gland were not significantly different between UFA sources. A possible explanation for these results might be that the variability in the FA profile among the dietary treatments was not sufficient because the unprotected UFA sources had undergone extensive biohydrogenation by rumen microorganisms (Chilliard et al., Reference Chilliard, Glasser, Ferlay, Bernard, Rouel and Doreau2007); and therefore, the contrast in absorbed FA composition between supplements was probably too small to cause large differences in mammary gland tissue gene expression. In agreement, Ollier et al. (Reference Ollier, Leroux, de la Foye, Bernard, Rouel and Chilliard2009) supplementing mid-lactation multiparous goats with oil from whole intact rapeseed or sunflower did not find significant changes in the expression of 8382 genes in the mammary gland, despite changes in milk composition. However, the lack of differently expressed genes between UFA sources could also be the result of a high variability in the expression levels of genes in the mammary gland within groups of treatments, as biological variation is intrinsic to all organisms (Churchill, Reference Churchill2002).
Functional clustering of differential expressed genes in the mammary gland
The functional clustering of differentially expressed genes by GO analysis, GSEA and IPA showed that supplementation of UFA leads to downregulation of hundreds of genes that modulate cellular growth proliferation and development cell death, connections between cells and morphology (cytoskeleton organization), apoptosis, cell cycle, nutrient metabolism, as well as immune system response.
Effects of UFA supplementation on cellular growth proliferation and development, cellular death, cytoskeleton organization and apoptosis
The downregulation of the expression of key genes (P53, PPP2R1A and Ras) associated with cellular growth, cell cycle, remodeling and apoptosis, as well as canonical pathways such as mTOR and JAK/STAT signaling, suggested changes in mammary gland tissue integrity and cell adhesion when cows were supplemented with UFA-enriched diets. The mTOR controls cellular metabolism, growth and proliferation (Panasyuk et al., Reference Panasyuk, Nemazanyy, Zhyvoloup, Filonenko, Davies, Robson, Pedley, Waterfield and Gout2009), and the JAK/STAT pathway is the principal signaling mechanism for a wide array of cytokines and growth factors resulting in cell proliferation, differentiation, cell migration and apoptosis (Rawlings et al., Reference Rawlings, Rosler and Harrison2004). These cellular events are critical to mammary gland lactation (Rawlings et al., Reference Rawlings, Rosler and Harrison2004). The information with regard to the effect of UFA supplementation on regulation of genes functioning in remodeling of the mammary gland in dairy cows is lacking. However, Connor et al. (Reference Connor, Siferd, Elsasser, Evock-Clover, Van Tassell, Sonstegard, Fernandes and Capuco2008) studying the specific mechanisms controlling the increase in milk production in dairy cows during the first few weeks of lactation, reported a downregulation of genes functioning in remodeling of the mammary gland. Therefore, it can be suggested that inhibition related to cell proliferation and remodeling could be mainly occurring in response to UFA-enriched diet that promoted an increase in milk synthesis.
Effects of UFA supplementation on immune system response
We present some of the first data in the bovine that reveal changes in the expression of defense, inflammatory and immune-related genes in response to UFA supplementation. Cows fed with UFA-enriched diet revealed downregulation of many key genes known to be involved in cellular and humoral immune responses, as well as pathogen-induced signaling and cellular stress and injury (Supplementary material; Figure S3). It featured a number of genes involved in cytokine and IL signaling, which exert potent chemokinetic and chemotactic activity on leukocytes and enhance the bactericidal activity of phagocytes in dairy cows (Pfaffl et al., Reference Pfaffl, Wittmann, Meyer and Bruckmaier2003), as well as T and B cell receptors, natural killer cell signaling, GM-CSF signaling, C-C chemokine receptor type 3 (CCR3) signaling in eosinophils, CXC chemokine receptor 4 (CXCR4) signaling and integrin signaling. Lessard et al. (Reference Lessard, Gagnon and Petit2003) suggested that cellular immunity of the dairy cows was affected by dietary supplementation of UFA. They observed that 5 days after calving, the lymphocyte proliferative response of cows allocated to linseed treatment was reduced. Connor et al. (Reference Connor, Siferd, Elsasser, Evock-Clover, Van Tassell, Sonstegard, Fernandes and Capuco2008) reported that increasing milk yield through milking frequency resulted in a downregulation of several genes that function in innate immune response and inflammation. Furthermore, one major finding of our study was the downregulation of genes associated with NFκB response after UFA supplementation (Figure 1d). In agreement, Lessard et al. (Reference Lessard, Gagnon and Petit2003) reported that dietary UFA can affect the regulation of cytokine gene expression by modulating the activation of transcription nuclear factors such as NFκB. Though little is known about the expression of defense, inflammatory and immune-related genes in response to dietary UFA supplementation in dairy cows, the results presented here suggest that enriched-UFA diets may affect immune functions of the mammary gland and thus may modify the susceptibility to mastitis in lactating cows and the resulting quality of milk. However, experiments specifically designed to test these hypothesis are warranted to verify the roles of UFA on genes involved in immune system response pathways and networks, together with cell cycle, cell growth and certain apoptotic pathways.
Effects of UFA supplementation on nutrient metabolism
Our microarray data provide insight into the nutrient metabolism adaptations in the mammary gland as a result of UFA supplementation. Our finding suggested that through feeding UFA-enriched diets, the mammary gland reduced overall fat and protein metabolic activity, but increased carbohydrate metabolism. Most of the transcripts involved with biological process related to carbohydrate metabolism (glycolysis and gluconeogenesis, and pentose phosphate pathway) were upregulated (Figure 2b). Glucose is the major precursor for synthesis of lactose, which controls milk volume by maintaining the osmolarity of milk (Finucane et al., Reference Finucane, McFadden, Bond, Kennelly and Zhao2008). Consistent to increased expression of genes associated with carbohydrate metabolism, lactose and milk yield of cows fed with enriched-UFA diet was greater relative to cows fed with control diet. Under the conditions of this experiment, increasing the fermentable energy content of the diet, by reducing NDF and increasing starch was also likely to stimulate the carbohydrate metabolism.
In contrast, supplementing basal diet of dairy cows with unprotected UFA was characterized by substantial downregulation of the mRNA expression of genes in the mammary gland involved in protein synthesis, protein trafficking, protein folding and the regulatory pathways controlling these processes, as well as lipid, and transport processes of nutrients. These changes may explain the reduction of fat and protein percentages in milk of these dairy cows. The most prominent functional characteristic of lipid metabolism category was the downregulation of the transcription factor SREBP1, when cows were supplemented with dietary unprotected UFA. Therefore, these results suggested that increasing the LCFA and trans-FA reaching mammary gland from blood may affect expression of key transcription regulator genes and their response genes. Together with the downregulation of SREBP1, ACACA, which catalyzes the carboxylation of acetyl-CoA to produce malonyl-CoA (Bernard et al., Reference Bernard, Leroux and Chilliard2008), was found to be downregulated during supplementation of UFA (Table 4). These results support the hypothesis that regulation of genes involved in de novo synthesis of FA is under control of SREBP1 (Bionaz and Loor, Reference Bionaz and Loor2008b). However, the observed downregulation of de novo lipid biosynthesis in bovine mammary gland could also be influenced by the downregulation of the insulin-induced gene (INSIG1; Raghow et al., Reference Raghow, Yellaturu, Deng, Park and Elam2008). When cells have sufficient sterol levels, INSIG1 retains the SREBP1 cleavage-activating protein (SCAP)-SREBP1 in the endoplasmic reticulum and consequently inhibits SREBP1-mediated gene expression. On the basis of the above observations, it is tempting to speculate that UFA reaching the mammary gland addresses the expression of both SREBP1 and INSIG1 to inhibit SREBP1-mediated gene expression and consequently, at least partially, reduce lipogenic activity in the mammary gland. This is in agreement with Harvatine and Bauman (Reference Harvatine and Bauman2006), who reported that dietary treatments causing milk fat depression decreased expression of SREBP1 and the INSIG1, consistent with decreased abundance of active SREBP1. Similarly, our findings underscore that supplementation of dietary UFA decreased the expression of gene sets regulated by PPARG, including those associated with FA import (e.g. acetyl-CoA acyltransferase 1 (ACAA1)), activation and intracellular channeling of FA (e.g. acyl-CoA synthetase short-chain family member 1 and 2 (ACSS1 and ACSS2)) and de novo FA synthesis (e.g. ACACA). Furthermore, the genes related to the formation of triglyceride (TG) such as the acyl-glycerol phosphate acyl-transferase (AGPAT1), thought to be involved in catalyzing the initial step in the synthesis of TG, were downregulated (Table 4). But on the contrary, our data indicated that supplementation of dietary unprotected UFA upregulated the expression of stearoyl-CoA desaturase 5 (SCD5), an isoform of the Δ-9 desaturase family (Lengi and Corl, Reference Lengi and Corl2007). The role of SCD5 in the mammary tissue remains elusive, although Gervais et al. (Reference Gervais, McFadden, Lengi, Corl and Chouinard2009) reported important differences between SCD1 and SCD5 regulation and physiological roles when Holstein cows were infused with a lipid emulsion enriched with t10,c12-CLA. However, no effects on the expression of SCD1 were found in this study (Supplementary material; Table S8). This is in agreement with Delbecchi et al. (Reference Delbecchi, Ahnadi, Kennelly and Lacasse2001), who reported no differences in the expression levels of SCD1 in the mammary gland when mid-lactation Holstein cows were fed a total MR supplemented with either 4.8% canola meal, 3.3% unprotected canola seeds plus 1.5% canola meal or 4.8% formaldehyde-protected canola seeds. Furthermore, Murrieta et al. (Reference Murrieta, Hess, Scholljegerdes, Engle, Hossner, Moss and Rule2006) also did not report differences on SCD1 mRNA expression in the mammary gland of crossbred beef cows supplemented with cracked safflower seed supplements. However, most of the studies that examined the effect of milk fat depressing diets on SCD1 expression in the mammary gland, reported a tendency toward reduction of mammary expression of SCD1 (Harvatine and Bauman, Reference Harvatine and Bauman2006; Gervais et al., Reference Gervais, McFadden, Lengi, Corl and Chouinard2009).
Conclusions
The results of our study suggest that supplementing the diets of grazing dairy cows with different unprotected UFAs decreases milk fat and protein percentage, and increases milk yield. Due to the UFA supplementation, the proportion of LCFAs in milk increases, whereas de novo FA synthesis decreases, which in turn, improves the nutrition quality aspects of dairy milk. The UFA supplementation led to robust transcriptional adaptations with 972 genes affected, suggesting a strong impact on metabolism and other cellular functions in the mammary gland. In particular, the functional analysis on these genes indicated that inclusion of dietary UFAs not only reduces the expression of genes associated with lipid and protein metabolism, but unexpectedly also of genes involved in cell–cell interactions, cells morphology (cytoskeleton organization), cell death and immune response. The large-scale transcriptional adaptations occurring in mammary tissue in response to dietary lipids might provide the basis for more detailed functional studies for future research.
Acknowledgments
The authors gratefully acknowledge the financial support of WUR investment funds (BAS code KB-05-003-040-ASG-V-2), and of ‘Comissionat per a Universitats i Recerca (CUR) del DIUE’ of the Government of Catalonia. The authors are also grateful to Dirk Anjema, Paul Kroon, Johan Meijer and Peter Jan ten Haken for surgical biopsies, and to Karel Houwelingen and Guido Hooiveld from Nutrition, Metabolism & Genomics Group of Wageningen University for their assistance. We thank Ad M. van Vuuren for critical comments.