

1 Introduction
Turbulence is a classical example of an out-of-equilibrium system. In steady state, energy is constantly injected at some scale  $\ell _{in}$, while it is dissipated at smaller scales
 $\ell _{\unicode[STIX]{x1D708}}$ by viscous forces. This process requires a finite flux of energy from the former scale
 $\ell _{in}$ to the latter
 $\ell _{\unicode[STIX]{x1D708}}$ that is provided by the well-known Kolmogorov–Richardson cascade. Despite the out-of-equilibrium nature of turbulence, there are circumstances where equilibrium dynamics become relevant. This has been claimed to be the case for the scales larger than the injection scale
 $\ell >\ell _{in}$. At these scales, the energy flux is zero and can possibly be modelled using equilibrium dynamics (Dallas, Fauve & Alexakis Reference Dallas, Fauve and Alexakis2015; Cameron, Alexakis & Brachet Reference Cameron, Alexakis and Brachet2017; Alexakis & Brachet Reference Alexakis and Brachet2019). Furthermore, at the smallest scales of the inertial range a so-called ‘bottleneck’ manifests where the power-law slope of the energy spectrum becomes less steep (Falkovich Reference Falkovich1994; Lohse & Müller-Groeling Reference Lohse and Müller-Groeling1995; Martinez et al. Reference Martinez, Chen, Doolen, Kraichnan, Wang and Zhou1997; Donzis & Sreenivasan Reference Donzis and Sreenivasan2010). This has been interpreted by Frisch et al. (Reference Frisch, Kurien, Pandit, Pauls, Ray, Wirth and Zhu2008) as an ‘incomplete thermalization’ that becomes asymptotically at equilibrium for hyper-viscous flows when the order of the hyper-viscosity tends to infinity. Equilibrium dynamics become also relevant in the presence of inverse cascades in finite domains where large scale condensates form (Kraichnan Reference Kraichnan1967; Robert & Sommeria Reference Robert and Sommeria1991; Naso, Chavanis & Dubrulle Reference Naso, Chavanis and Dubrulle2010; Bouchet & Venaille Reference Bouchet and Venaille2012; Shukla, Fauve & Brachet Reference Shukla, Fauve and Brachet2016). Finally, understanding equilibrium dynamics is important for systems that display a transition from a forward to an inverse cascade (Deusebio et al. Reference Deusebio, Boffetta, Lindborg and Musacchio2014; Seshasayanan, Benavides & Alexakis Reference Seshasayanan, Benavides and Alexakis2014; Sozza et al. Reference Sozza, Boffetta, Muratore-Ginanneschi and Musacchio2015; Benavides & Alexakis Reference Benavides and Alexakis2017; Sahoo, Alexakis & Biferale Reference Sahoo, Alexakis and Biferale2017; Alexakis & Biferale Reference Alexakis and Biferale2018) because the large scale flows in these systems transition from an equilibrium state to an out-of-equilibrium state. Besides the possible applications, understanding the equilibrium dynamics in turbulence is also a much needed step required before understanding its much harder out-of-equilibrium counterpart. This has led many researchers (Hopf Reference Hopf1952; Lee Reference Lee1952; Kraichnan Reference Kraichnan1967, Reference Kraichnan1973; Orszag Reference Orszag, Balian and Peube1977) to investigate the equilibrium state of the truncated Euler equations (TEE), where only a finite number of Fourier modes is kept and are given by
 $$\begin{eqnarray}\unicode[STIX]{x2202}_{t}\boldsymbol{u}+\mathbb{P}_{K}[\boldsymbol{u}\boldsymbol{\cdot }\unicode[STIX]{x1D735}\boldsymbol{u}+\unicode[STIX]{x1D735}p]=0,\quad \unicode[STIX]{x1D735}\boldsymbol{\cdot }\boldsymbol{u}=0.\end{eqnarray}$$
Here  $\boldsymbol{u}$ is the incompressible velocity field,
 $p$ is the pressure and
 $\mathbb{P}_{K}$ is a projection operator that sets to zero all Fourier modes except those that belong to a particular set ‘
 $K$’ (here chosen to be all wavenumbers inside a sphere centred at the origin with radius
 $k_{max}$). These equations conserve exactly two quadratic invariants:
 $$\begin{eqnarray}\text{the energy,}\quad {\mathcal{E}}=\frac{1}{2}\int |\boldsymbol{u}|^{2}\,\text{d}x^{3},\quad \text{and the helicity,}\quad {\mathcal{H}}=\frac{1}{2}\int \boldsymbol{u}\boldsymbol{\cdot }\unicode[STIX]{x1D735}\times \boldsymbol{u}\,\text{d}x^{3}.\end{eqnarray}$$
In Fourier space, these invariants are distributed among the different modes that are quantified by the energy and helicity spherically averaged spectra,  $E(k),H(k)$, respectively, defined as
 $$\begin{eqnarray}E(k)=\frac{1}{2k_{0}}\mathop{\sum }_{k\leqslant |\boldsymbol{k}|<k+k_{0}}|\tilde{\boldsymbol{u}}_{\boldsymbol{k}}|^{2}\quad \text{and}\quad H(k)=\frac{1}{2k_{0}}\mathop{\sum }_{k\leqslant |\boldsymbol{k}|<k+k_{0}}\tilde{\boldsymbol{u}}_{-\boldsymbol{k}}\boldsymbol{\cdot }(\text{i}\boldsymbol{k}\times \tilde{\boldsymbol{u}}_{\boldsymbol{k}}).\end{eqnarray}$$
Here  $\tilde{\boldsymbol{u}}$ is the Fourier transform of
 $\boldsymbol{u}$ and we have assumed a triple periodic cubic domain of size
 $2\unicode[STIX]{x03C0}/k_{0}$. The spectra have been divided by the smallest non-zero wavenumber
 $k_{0}$ so that they have units of energy and helicity density, respectively.
At late times, this system reaches a statistically steady state whose properties are fully determined by these two invariants. Using Liouville’s theorem and assuming ergodicity, Lee (Reference Lee1952) predicted that, at absolute equilibrium, this system will be such that every state  $\boldsymbol{u}$ of a given energy
 ${\mathcal{E}}$ is equally probable. This is equivalent to the microcanonical ensemble in statistical physics, and it leads to equipartition of energy among all the degrees of freedom (i.e. among all Fourier amplitudes) and an energy spectrum given by
 $E(k)\propto k^{2}$. Kraichnan (Reference Kraichnan1973) generalized these results, including helicity, and, assuming a Gaussian equipartition ensemble,
 $$\begin{eqnarray}{\mathcal{P}}(\boldsymbol{u})={\mathcal{Z}}^{-1}\exp [-\unicode[STIX]{x1D6FC}{\mathcal{E}}-\unicode[STIX]{x1D6FD}{\mathcal{H}}],\end{eqnarray}$$
where  ${\mathcal{P}}(\boldsymbol{u})$ is the probability distribution for the system to be found in the state
 $\boldsymbol{u}$,
 ${\mathcal{E}}$ is the energy and
 ${\mathcal{H}}$ the helicity given in (1.2) and
 ${\mathcal{Z}}$ a normalization constant. The parameters
 $\unicode[STIX]{x1D6FC}$ and
 $\unicode[STIX]{x1D6FD}$ are the equivalent of an inverse temperature and inverse chemical potential, respectively, in analogy with statistical physics. We note that for the TEE system, (1.4) is not exact! This is because (1.4) allows for fluctuations of the energy
 ${\mathcal{E}}$, which are not allowed for the TEE system. However, it becomes closer to the true distribution as the number
 $N$ of Fourier modes becomes larger. For no helicity,
 $\unicode[STIX]{x1D6FD}=0$, which leads to the energy spectrum
 $E(k)\propto k^{2}$ predicted by Lee. In the presence of helicity, one obtains
 $$\begin{eqnarray}E(k)=\frac{4\unicode[STIX]{x03C0}\unicode[STIX]{x1D6FC}k^{2}}{\unicode[STIX]{x1D6FC}^{2}-\unicode[STIX]{x1D6FD}^{2}k^{2}},\quad H(k)=\frac{4\unicode[STIX]{x03C0}\unicode[STIX]{x1D6FD}k^{4}}{\unicode[STIX]{x1D6FC}^{2}-\unicode[STIX]{x1D6FD}^{2}k^{2}}.\end{eqnarray}$$
The coefficients  $\unicode[STIX]{x1D6FC}$ and
 $\unicode[STIX]{x1D6FD}$ are determined by imposing the conditions
 $$\begin{eqnarray}{\mathcal{E}}=k_{0}\mathop{\sum }_{\boldsymbol{k}}E(k)\quad \text{and}\quad {\mathcal{H}}=k_{0}\mathop{\sum }_{\boldsymbol{k}}H(k),\end{eqnarray}$$
where  ${\mathcal{E}}$ and
 ${\mathcal{H}}$ are the initial energy and helicity, respectively. The predictions above have been verified for the truncated Euler system in numerous numerical simulations (Orszag & Patterson Reference Orszag, Patterson, Rosenblatt and Van Atta1977; Cichowlas et al. Reference Cichowlas, Bonaïti, Debbasch and Brachet2005; Krstulovic et al. Reference Krstulovic, Mininni, Brachet and Pouquet2009; Dallas et al. Reference Dallas, Fauve and Alexakis2015; Cameron et al. Reference Cameron, Alexakis and Brachet2017; Alexakis & Brachet Reference Alexakis and Brachet2019).
In the TEE, however, there is no exchange of energy with external sources or sinks, and it is thus harder to make contact with more realistic systems, such as those scales larger than the forcing scale in a turbulent flow, mentioned at the beginning of the introduction. It was shown recently in Alexakis & Brachet (Reference Alexakis and Brachet2019) that, in some cases, although the large scales are close to an equilibrium state, there is still exchange of energy with the smaller turbulent and forcing scales, generating energy fluxes (from the forced scales to the large scales and from the large scales to the turbulent scales). It appears thus that, even in the presence of sources and sinks, equilibrium dynamics can still be relevant. In this work, we examine further this possibility by looking at the truncated Navier–Stokes (TNS) equations, where there is constant energy injection and dissipation similar to the regular Navier–Stokes equations, but the system is limited to a finite number of Fourier modes as in TEE. We show analytically in the next section that, for weak energy injection and weak viscosity so  $k_{max}\unicode[STIX]{x1D702}\ll (k_{0}/k_{max})^{11/4}$ (where
 $\unicode[STIX]{x1D702}$ is the Kolmogorov length scale), the system indeed reaches a quasi-equilibrium state whose probability distribution
 ${\mathcal{P}}(\boldsymbol{u})$ can be calculated. We verify and extend these results using direct numerical simulations in § 3. Our conclusions are presented in the last section.
2 Asymptotic expansion
We consider the truncated Navier–Stokes (TNS) equations,
 $$\begin{eqnarray}\unicode[STIX]{x2202}_{t}\boldsymbol{u}+\mathbb{P}_{K}[\boldsymbol{u}\boldsymbol{\cdot }\unicode[STIX]{x1D735}\boldsymbol{u}+\unicode[STIX]{x1D735}P]=\boldsymbol{f}+\unicode[STIX]{x1D708}\unicode[STIX]{x0394}\boldsymbol{u},\end{eqnarray}$$
where  $\boldsymbol{u}$ is the incompressible velocity field,
 $P$ is the pressure,
 $\unicode[STIX]{x1D708}$ is the viscosity and
 $\boldsymbol{f}$ is a forcing function. The domain is a
 $2\unicode[STIX]{x03C0}$ periodic cube so that the smallest non-zero wavenumber is
 $k_{0}=1$. The projection operator
 $\mathbb{P}_{K}$ sets to zero all Fourier modes with wavenumbers outside the sphere of radius
 $k_{max}$. In total, there are
 $N\simeq \frac{4\unicode[STIX]{x03C0}}{3}(k_{max}/k_{0})^{3}$ Fourier wavenumbers inside this sphere. In order to proceed, it helps to write the truncated Navier–Stokes equations in Fourier space using the Craya–Lesieur–Herring decomposition (Craya (Reference Craya1958), Lesieur (Reference Lesieur1972), Herring (Reference Herring1974)) where every Fourier mode is written as the sum of two modes, one with positive helicity and one with negative helicity,
 $\tilde{\boldsymbol{u}}_{\boldsymbol{k}}=\tilde{u} _{\boldsymbol{k}}^{+}\boldsymbol{h}_{\boldsymbol{k}}^{+}+\tilde{u} _{\boldsymbol{k}}^{-}\boldsymbol{h}_{\boldsymbol{k}}^{-}$. The two vectors
 $\boldsymbol{h}_{\boldsymbol{k}}^{\pm }$ are given by
 $$\begin{eqnarray}\boldsymbol{h}_{\boldsymbol{k}}^{s}=\frac{\boldsymbol{k}\times (\hat{\boldsymbol{e}}\times \boldsymbol{k})}{\sqrt{2}|\boldsymbol{k}\times (\hat{\boldsymbol{e}}\times \boldsymbol{k})|}+\text{i}\,s\frac{\hat{\boldsymbol{e}}\times \boldsymbol{k}}{\sqrt{2}|\hat{\boldsymbol{e}}\times \boldsymbol{k}|},\end{eqnarray}$$
where  $\hat{\boldsymbol{e}}$ is an arbitrary unit vector. The sign index
 $s=\pm 1$ indicates the sign of the helicity of
 $\boldsymbol{h}_{\boldsymbol{k}}^{s}$. The basis vectors
 $\boldsymbol{h}_{\boldsymbol{k}}^{s}$ are eigenfunctions of the curl operator in Fourier space, such that
 $\text{i}\boldsymbol{k}\times \boldsymbol{h}_{\boldsymbol{k}}^{s}=s|\boldsymbol{k}|\boldsymbol{h}_{\boldsymbol{k}}^{s}$. They satisfy
 $\boldsymbol{h}_{\boldsymbol{k}}^{s}\boldsymbol{\cdot }\boldsymbol{h}_{\boldsymbol{k}}^{s}=0$ and
 $(\boldsymbol{h}_{\boldsymbol{k}}^{s})^{\ast }\boldsymbol{\cdot }\boldsymbol{h}_{\boldsymbol{k}}^{s}=1$, where the complex conjugate of
 $\boldsymbol{h}_{\boldsymbol{k}}^{s}$ is given by
 $(\boldsymbol{h}_{\boldsymbol{k}}^{s})^{\ast }=\boldsymbol{h}_{\boldsymbol{k}}^{-s}=\boldsymbol{h}_{-\boldsymbol{k}}^{s}$. They form a complete base for incompressible zero-mean vector fields. This decomposition has been extensively used and discussed in the literature (Cambon & Jacquin Reference Cambon and Jacquin1989; Waleffe Reference Waleffe1992; Chen, Chen & Eyink Reference Chen, Chen and Eyink2003; Biferale, Musacchio & Toschi Reference Biferale, Musacchio and Toschi2012; Moffatt Reference Moffatt2014; Alexakis Reference Alexakis2017; Sahoo et al. Reference Sahoo, Alexakis and Biferale2017). Note that since every
 $\tilde{\boldsymbol{u}}_{\boldsymbol{k}}$ is described by two complex amplitudes,
 $\tilde{u} _{\boldsymbol{k}}^{\pm }$, that satisfy
 $(\tilde{u} _{\boldsymbol{k}}^{\pm })^{\ast }=\tilde{u} _{-\boldsymbol{k}}^{\pm }$, there are in total
 $2N$ independent degrees of freedom. The truncated Navier–Stokes equations can then be written, using the helical decomposition, as
 $$\begin{eqnarray}\unicode[STIX]{x2202}_{t}\tilde{\boldsymbol{u}}_{\boldsymbol{k}}^{s}={\mathcal{V}}_{\boldsymbol{ k}}^{s}-\unicode[STIX]{x1D708}k^{2}\tilde{\boldsymbol{u}}_{\boldsymbol{ k}}^{s}+\tilde{f}_{\boldsymbol{ k}}^{s},\end{eqnarray}$$
where the nonlinear term  ${\mathcal{V}}_{\boldsymbol{k}}^{s}$ is written as the convolution
 $$\begin{eqnarray}{\mathcal{V}}_{\boldsymbol{k}}^{s}=\mathop{\sum }_{\boldsymbol{p}+\boldsymbol{q}=\boldsymbol{k}}\mathop{\sum }_{s_{p},s_{q}}\unicode[STIX]{x1D63E}_{\boldsymbol{k},\boldsymbol{q},\boldsymbol{p}}^{s,s_{q},s_{p}}\tilde{\boldsymbol{u}}_{\boldsymbol{p}}^{s_{p}}\tilde{\boldsymbol{u}}_{\boldsymbol{q}}^{s_{q}},\end{eqnarray}$$
and the tensor  $\unicode[STIX]{x1D63E}_{\boldsymbol{k},\boldsymbol{q},\boldsymbol{p}}^{s_{k},s_{q},s_{p}}$ is given by
 $\unicode[STIX]{x1D63E}_{\boldsymbol{k},\boldsymbol{q},\boldsymbol{p}}^{s_{k},s_{q},s_{p}}=\frac{1}{2}(s_{q}q-s_{p}p)(\boldsymbol{h}_{-\boldsymbol{k}}^{s_{\boldsymbol{k}}}\boldsymbol{\cdot }\boldsymbol{h}_{\boldsymbol{ q}}^{s_{\boldsymbol{q}}}\times \boldsymbol{h}_{\boldsymbol{ p}}^{s_{\boldsymbol{p}}})$. The nonlinearity
 ${\mathcal{V}}_{\boldsymbol{k}}^{s}$ satisfies the following relations:
 $$\begin{eqnarray}\mathop{\sum }_{s,\boldsymbol{k}}\tilde{\boldsymbol{u}}_{-\boldsymbol{k}}^{s}{\mathcal{V}}_{\boldsymbol{k}}^{s}=0,\quad \mathop{\sum }_{s,\boldsymbol{k}}s\,k\,\tilde{\boldsymbol{u}}_{-\boldsymbol{k}}^{s}{\mathcal{V}}_{\boldsymbol{k}}^{s}=0\end{eqnarray}$$
that correspond to the energy and helicity conservation, respectively, and
 $$\begin{eqnarray}\mathop{\sum }_{s,\boldsymbol{k}}\frac{\unicode[STIX]{x2202}}{\unicode[STIX]{x2202}\tilde{\boldsymbol{u}}_{\boldsymbol{k}}^{s}}{\mathcal{V}}_{\boldsymbol{k}}^{s}=0.\end{eqnarray}$$
This last relation indicates that phase-space volume is conserved by the nonlinearity (i.e. it satisfies a Liouville condition). We will assume that the forcing is written as  $\tilde{f}_{\boldsymbol{k}}^{s}=\unicode[STIX]{x1D716}_{\boldsymbol{k}}^{s}\unicode[STIX]{x1D709}_{\boldsymbol{k}}^{s}$, where
 $\unicode[STIX]{x1D709}_{\boldsymbol{k}}^{s}$ are random complex amplitudes that are statistically independent, normally distributed and delta-correlated in time, such that
 $\langle \unicode[STIX]{x1D709}_{\boldsymbol{k}}^{s}(t)\unicode[STIX]{x1D709}_{-\boldsymbol{q}}^{s\mathbb{p}\prime }(t\mathbb{p}\prime )\rangle =2\unicode[STIX]{x1D6FF}_{s,s\mathbb{p}\prime }\,\unicode[STIX]{x1D6FF}_{\boldsymbol{q},\boldsymbol{k}}$
 $\unicode[STIX]{x1D6FF}(t-t\mathbb{p}\prime )$. With this choice, each forcing mode injects energy to the system on average at the rate
 $\unicode[STIX]{x1D716}_{\boldsymbol{k}}^{s}$. Then the Fokker–Plank equation for the probability density
 ${\mathcal{P}}(\boldsymbol{u})$ in the
 $2N$-dimensional space of all complex amplitudes
 $\tilde{u} _{\boldsymbol{k}}^{\pm }$ is given by
 $$\begin{eqnarray}\frac{\unicode[STIX]{x2202}}{\unicode[STIX]{x2202}t}{\mathcal{P}}+\mathop{\sum }_{s,\boldsymbol{k}}\frac{\unicode[STIX]{x2202}}{\unicode[STIX]{x2202}\tilde{\boldsymbol{u}}_{\boldsymbol{k}}^{s}}({\mathcal{V}}_{\boldsymbol{k}}^{s}{\mathcal{P}})=\unicode[STIX]{x1D708}\mathop{\sum }_{s,\boldsymbol{k}}\frac{\unicode[STIX]{x2202}}{\unicode[STIX]{x2202}\tilde{\boldsymbol{u}}_{\boldsymbol{k}}^{s}}(k^{2}\tilde{\boldsymbol{u}}_{\boldsymbol{ k}}^{s}{\mathcal{P}})+\mathop{\sum }_{s,\boldsymbol{k}}\unicode[STIX]{x1D716}_{\boldsymbol{k}}^{s}\frac{\unicode[STIX]{x2202}}{\unicode[STIX]{x2202}\tilde{\boldsymbol{u}}_{\boldsymbol{k}}^{s}}\frac{\unicode[STIX]{x2202}}{\unicode[STIX]{x2202}\tilde{\boldsymbol{u}}_{-\boldsymbol{k}}^{s}}{\mathcal{P}},\end{eqnarray}$$
where the sum is over all  $2N$ modes
 $\tilde{\boldsymbol{u}}_{\boldsymbol{k}}^{s}$. Multiplying by
 ${\mathcal{E}}=\frac{1}{2}\sum _{s,\boldsymbol{q}}|\tilde{\boldsymbol{u}}_{\boldsymbol{q}}^{s}|^{2}$, integrating over the phase-space volume and using integration by parts, we obtain the energy balance equation
 $$\begin{eqnarray}\frac{\unicode[STIX]{x2202}}{\unicode[STIX]{x2202}t}\left\langle {\mathcal{E}}\right\rangle =-\!\left\langle {\mathcal{D}}_{{\mathcal{E}}}\right\rangle +\left\langle {\mathcal{I}}_{{\mathcal{E}}}\right\rangle ,\end{eqnarray}$$
where  ${\mathcal{D}}_{{\mathcal{E}}}=\unicode[STIX]{x1D708}\sum _{s,\boldsymbol{k}}k^{2}\langle |\tilde{\boldsymbol{u}}_{\boldsymbol{k}}^{s}|^{2}\rangle$ is the energy dissipation,
 ${\mathcal{I}}_{{\mathcal{E}}}=\sum _{s,\boldsymbol{k}}\unicode[STIX]{x1D716}_{\boldsymbol{k}}^{s}$ is the injection rate and the brackets stand for the average
 $\left\langle f\right\rangle \equiv \int f{\mathcal{P}}\text{d}U$, where
 $\text{d}U$ stands for the phase-space volume element
 $\text{d}U=\prod _{s,\boldsymbol{k}}\text{d}\tilde{\boldsymbol{u}}_{\boldsymbol{k}}^{s}$.
We are interested in the limit that the energy injection and dissipation rate are a small perturbation to the thermalized fluctuations. We thus set  $\unicode[STIX]{x1D708}_{k}=\unicode[STIX]{x1D6FF}\unicode[STIX]{x1D708}_{k}^{\prime }$ and
 $\unicode[STIX]{x1D716}_{\boldsymbol{k}}^{s}=\unicode[STIX]{x1D6FF}\unicode[STIX]{x1D716}\mathbb{p}\prime _{\boldsymbol{k}}^{s}$, where
 $\unicode[STIX]{x1D6FF}\ll 1$ is a small parameter. We then expand
 ${\mathcal{P}}$ as a power series of
 $\unicode[STIX]{x1D6FF}$:
 ${\mathcal{P}}={\mathcal{P}}_{0}+\unicode[STIX]{x1D6FF}{\mathcal{P}}_{1}+\ldots \,$. We are going to also consider the long time limit, so we can neglect the time derivative. To zeroth order we then have
 $$\begin{eqnarray}\mathop{\sum }_{s,\boldsymbol{k}}\frac{\unicode[STIX]{x2202}}{\unicode[STIX]{x2202}\tilde{\boldsymbol{u}}_{\boldsymbol{k}}^{s}}({\mathcal{V}}_{\boldsymbol{k}}^{s}{\mathcal{P}}_{0})=0.\end{eqnarray}$$
The equation above implies that  ${\mathcal{P}}_{0}$ is constant along the trajectories in the phase space followed by solutions of the truncated Euler equations. These trajectories are expected to be chaotic for large
 $N$ and, since this is such a high dimensional space, we can also conjecture that these trajectories are space-filling (i.e. ergodic) in the subspace constrained by the invariants of the system. In other words, we assume that the trajectory will pass arbitrarily close to any point that has the same energy and helicity as the initial conditions. In this case,
 ${\mathcal{P}}_{0}$ is determined by the energy and helicity of the system
 ${\mathcal{P}}(\boldsymbol{u})=f({\mathcal{E}},{\mathcal{H}})$. For the present work, however, we are going to neglect the second invariant the helicity and assume dependence only on the energy. We then write the solution of (2.9) as
 $$\begin{eqnarray}{\mathcal{P}}_{0}=f({\mathcal{E}})=f\left(\frac{1}{2}\mathop{\sum }_{s,\boldsymbol{k}}|\tilde{\boldsymbol{u}}_{\boldsymbol{k}}^{s}|^{2}\right).\end{eqnarray}$$
To the next order, we then get
 $$\begin{eqnarray}\mathop{\sum }_{s,\boldsymbol{k}}\frac{\unicode[STIX]{x2202}}{\unicode[STIX]{x2202}\tilde{\boldsymbol{u}}_{\boldsymbol{k}}^{s}}({\mathcal{V}}_{\boldsymbol{k}}^{s}{\mathcal{P}}_{1})=\unicode[STIX]{x1D708}\mathbb{p}\prime \mathop{\sum }_{s,\boldsymbol{k}}\frac{\unicode[STIX]{x2202}}{\unicode[STIX]{x2202}\tilde{\boldsymbol{u}}_{\boldsymbol{k}}^{s}}(k^{2}\tilde{\boldsymbol{u}}_{\boldsymbol{ k}}^{s}{\mathcal{P}}_{0})+\mathop{\sum }_{s,\boldsymbol{k}}\unicode[STIX]{x1D716}\mathbb{p}\prime _{\boldsymbol{k}}^{s}\frac{\unicode[STIX]{x2202}}{\unicode[STIX]{x2202}\tilde{\boldsymbol{u}}_{\boldsymbol{k}}^{s}}\frac{\unicode[STIX]{x2202}}{\unicode[STIX]{x2202}\tilde{\boldsymbol{u}}_{-\boldsymbol{k}}^{s}}{\mathcal{P}}_{0}.\end{eqnarray}$$
Substituting (2.10) and using the chain rule for the derivatives
 $$\begin{eqnarray}\frac{\unicode[STIX]{x2202}}{\unicode[STIX]{x2202}\tilde{\boldsymbol{u}}_{\boldsymbol{k}}^{s}}f({\mathcal{E}})=\frac{\unicode[STIX]{x2202}{\mathcal{E}}}{\unicode[STIX]{x2202}\tilde{\boldsymbol{u}}_{\boldsymbol{k}}^{s}}\frac{\unicode[STIX]{x2202}f}{\unicode[STIX]{x2202}{\mathcal{E}}}=\left(\frac{\unicode[STIX]{x2202}}{\unicode[STIX]{x2202}\tilde{\boldsymbol{u}}_{\boldsymbol{k}}^{s}}\frac{1}{2}\mathop{\sum }_{s_{s},\boldsymbol{q}}\tilde{\boldsymbol{u}}_{-\boldsymbol{q}}^{s_{q}}\tilde{\boldsymbol{u}}_{\boldsymbol{q}}^{s_{q}}\right)\frac{\unicode[STIX]{x2202}f}{\unicode[STIX]{x2202}{\mathcal{E}}}=\tilde{\boldsymbol{u}}_{-\boldsymbol{k}}^{s}\frac{\unicode[STIX]{x2202}f}{\unicode[STIX]{x2202}{\mathcal{E}}},\end{eqnarray}$$
we obtain, for the function  $f({\mathcal{E}})$,
 $$\begin{eqnarray}\displaystyle \mathop{\sum }_{s,\boldsymbol{k}}\frac{\unicode[STIX]{x2202}}{\unicode[STIX]{x2202}\tilde{\boldsymbol{u}}_{\boldsymbol{k}}^{s}}({\mathcal{V}}_{\boldsymbol{k}}^{s}{\mathcal{P}}_{1})=\unicode[STIX]{x1D708}\mathbb{p}\prime \mathop{\sum }_{s,\boldsymbol{k}}\left(f+|\tilde{\boldsymbol{u}}_{\boldsymbol{k}}^{s}|^{2}\frac{\unicode[STIX]{x2202}f}{\unicode[STIX]{x2202}{\mathcal{E}}}\right)k^{2}+\left(\left[\mathop{\sum }_{s,\boldsymbol{k}}\unicode[STIX]{x1D716}\mathbb{p}\prime _{\boldsymbol{k}}^{s}\right]\frac{\unicode[STIX]{x2202}f}{\unicode[STIX]{x2202}{\mathcal{E}}}+\left[\mathop{\sum }_{\boldsymbol{k}}\unicode[STIX]{x1D716}\mathbb{p}\prime _{\boldsymbol{k}}^{s}|\tilde{\boldsymbol{u}}_{\boldsymbol{k}}^{s}|^{2}\right]\frac{\unicode[STIX]{x2202}^{2}f}{\unicode[STIX]{x2202}{\mathcal{E}}^{2}}\right).\phantom{\mathop{\sum }_{\sum }}\hspace{-24.0pt} & & \displaystyle \nonumber\\ \displaystyle & & \displaystyle\end{eqnarray}$$
To obtain a closed equation for  $f({\mathcal{E}})$, we average (2.13) over the volume
 $\text{d}U_{{\mathcal{E}}}$ of all points in phase space of energy between
 ${\mathcal{E}}$ and
 ${\mathcal{E}}+\text{d}{\mathcal{E}}$. This consists of a spherical shell in the
 $2N$-dimensional phase space of radius
 $\sqrt{2{\mathcal{E}}}$. Averaging over this volume leads the sum in the left-hand side to drop out because it is a divergence and the trajectories determined by
 ${\mathcal{V}}_{\boldsymbol{k}}^{s}$ stay inside the shell. The volume integrals of terms independent of
 $\tilde{\boldsymbol{u}}_{\boldsymbol{k}}^{s}$ are proportional to the shell volume
 $\text{d}U_{{\mathcal{E}}}=S_{2N}(2{\mathcal{E}})^{N-1}\,\text{d}{\mathcal{E}}$, where
 $S_{2N}$ is the surface of an unit radius
 $2N$-dimensional sphere. Terms proportional to
 $|\tilde{\boldsymbol{u}}_{\boldsymbol{k}}^{s}|^{2}$ result due to symmetry:
 $\int _{\text{d}U_{{\mathcal{E}}}}|\tilde{\boldsymbol{u}}_{\boldsymbol{k}}^{s}|^{2}\,\text{d}U=(2N)^{-1}\int _{\text{d}U_{{\mathcal{E}}}}\sum _{s,\boldsymbol{k}}|\tilde{\boldsymbol{u}}_{\boldsymbol{k}}^{s}|^{2}\,\text{d}U=(2N)^{-1}S_{2N}(2{\mathcal{E}})^{N}$. This leads to
 $$\begin{eqnarray}\unicode[STIX]{x1D708}\mathbb{p}\prime \left(\mathop{\sum }_{\boldsymbol{k}}|\boldsymbol{k}|^{2}\right)\left(f+\frac{{\mathcal{E}}}{N}\frac{\unicode[STIX]{x2202}f}{\unicode[STIX]{x2202}{\mathcal{E}}}\right)+\left[\mathop{\sum }_{s,\boldsymbol{k}}\unicode[STIX]{x1D716}\mathbb{p}\prime _{\boldsymbol{k}}^{s}\right]\left(\frac{\unicode[STIX]{x2202}f}{\unicode[STIX]{x2202}{\mathcal{E}}}+\frac{{\mathcal{E}}}{N}\frac{\unicode[STIX]{x2202}^{2}f}{\unicode[STIX]{x2202}{\mathcal{E}}^{2}}\right)=0.\end{eqnarray}$$
If we set  ${\mathcal{I}}_{{\mathcal{E}}}^{\prime }=\left[\sum _{s,\boldsymbol{k}}\unicode[STIX]{x1D716}\mathbb{p}\prime _{\boldsymbol{k}}^{s}\right]$ and
 $K^{2}=\sum _{s,\boldsymbol{k}}|\boldsymbol{k}|^{2}\simeq 8\unicode[STIX]{x03C0}k_{max}^{5}/(5k_{0}^{3})$ (where the last equality comes from approximating the sum with a three-dimensional integral), then, by multiplying by
 ${\mathcal{E}}^{N-1}$, the equation simplifies to
 $$\begin{eqnarray}\frac{\unicode[STIX]{x2202}}{\unicode[STIX]{x2202}{\mathcal{E}}}\left(\unicode[STIX]{x1D708}\mathbb{p}\prime K^{2}{\mathcal{E}}^{N}f+{\mathcal{I}}_{{\mathcal{E}}}^{\prime }{\mathcal{E}}^{N}\frac{\unicode[STIX]{x2202}f}{\unicode[STIX]{x2202}{\mathcal{E}}}\right)=0\end{eqnarray}$$
that has the bounded solution
 $$\begin{eqnarray}f({\mathcal{E}})={\mathcal{Z}}^{-1}\exp \left(-\frac{\unicode[STIX]{x1D708}K^{2}}{{\mathcal{I}}_{{\mathcal{E}}}}{\mathcal{E}}\right),\end{eqnarray}$$
where  ${\mathcal{Z}}$ is a normalization constant that imposes
 $\int {\mathcal{P}}(\boldsymbol{u})\,\text{d}\boldsymbol{u}=1$ and is given by
 $$\begin{eqnarray}{\mathcal{Z}}=S_{2N}2^{N-1}\left(\frac{{\mathcal{I}}_{{\mathcal{E}}}}{\unicode[STIX]{x1D708}K^{2}}\right)^{N}\unicode[STIX]{x1D6E4}(N)\end{eqnarray}$$
with  $\unicode[STIX]{x1D6E4}$ being the Gamma function. We have thus recovered the Kraichnan distribution of (1.4) with
 $\unicode[STIX]{x1D6FD}=0$ and inverse temperature given by
 $\unicode[STIX]{x1D6FC}=\unicode[STIX]{x1D708}K^{2}/{\mathcal{I}}_{{\mathcal{E}}}$. Note that
 $\unicode[STIX]{x1D6FC}$ depends only on the ratio of
 $\unicode[STIX]{x1D708}\mathbb{p}\prime$ and
 ${\mathcal{I}}\mathbb{p}\prime _{{\mathcal{E}}}$ and thus is independent of
 $\unicode[STIX]{x1D6FF}$ and we have thus dropped the primes.
It is worth restating that  ${\mathcal{P}}(\boldsymbol{u})=f(\frac{1}{2}\sum _{s,\boldsymbol{k}}|\tilde{\boldsymbol{u}}_{\boldsymbol{k}}^{s}|^{2})$ given in (2.16) expresses the probability that the system finds itself in the particular state
 $\boldsymbol{u}$ with energy
 ${\mathcal{E}}=\frac{1}{2}\sum _{s,\boldsymbol{k}}|\tilde{\boldsymbol{u}}_{\boldsymbol{k}}^{s}|^{2}$. If we would like to find the probability
 $P({\mathcal{E}})$ of finding the system in any state
 $\boldsymbol{u}$ of energy
 ${\mathcal{E}}$, we need to average over all states
 $\boldsymbol{u}$ that have energy
 ${\mathcal{E}}$. This leads to the chi-distribution for the energy:
 $$\begin{eqnarray}P({\mathcal{E}})=\frac{S_{2N}(2{\mathcal{E}})^{N-1}}{{\mathcal{Z}}}\exp \left(-\frac{\unicode[STIX]{x1D708}K^{2}}{{\mathcal{I}}_{{\mathcal{E}}}}{\mathcal{E}}\right).\end{eqnarray}$$
For large  $N$, the distribution
 $P({\mathcal{E}})$ in (2.18) is highly peaked at the mean energy:
 $$\begin{eqnarray}\langle {\mathcal{E}}\rangle =\frac{N{\mathcal{I}}_{{\mathcal{E}}}}{\unicode[STIX]{x1D708}K^{2}}.\end{eqnarray}$$
As  $N$ tends to infinity,
 $P({\mathcal{E}})$ becomes asymptotically a delta function centred at
 $\langle {\mathcal{E}}\rangle$. The mean energy of any mode
 $\tilde{\boldsymbol{u}}_{\boldsymbol{k}}^{s}$ is given by
 $\frac{1}{2}\langle |\tilde{\boldsymbol{u}}_{\boldsymbol{k}}^{s}|^{2}\rangle =\langle {\mathcal{E}}\rangle /2N$. Averaging over spherical shells then leads to the thermal equipartition spectrum
 $$\begin{eqnarray}E(k)=\frac{4\unicode[STIX]{x03C0}{\mathcal{I}}_{{\mathcal{E}}}}{\unicode[STIX]{x1D708}K^{2}k_{0}^{3}}k^{2}.\end{eqnarray}$$
Finally, using (2.16), one can calculate the energy dissipation as
 $$\begin{eqnarray}\displaystyle \langle {\mathcal{D}}_{{\mathcal{E}}}\rangle & = & \displaystyle \unicode[STIX]{x1D708}{\mathcal{Z}}^{-1}\mathop{\sum }_{s,\boldsymbol{q}}q^{2}\int |\tilde{\boldsymbol{u}}_{\boldsymbol{q}}^{s}|^{2}\exp \left(-\frac{1}{2}\unicode[STIX]{x1D6FC}\mathop{\sum }_{s,\boldsymbol{k}}|\tilde{\boldsymbol{u}}_{\boldsymbol{k}}^{s}|^{2}\right)\,\text{d}U\nonumber\\ \displaystyle & = & \displaystyle \frac{\unicode[STIX]{x1D708}}{2N{\mathcal{Z}}}\left(\mathop{\sum }_{s,\boldsymbol{q}}q^{2}\right)\int (2{\mathcal{E}})\exp (-\unicode[STIX]{x1D6FC}{\mathcal{E}})\,\text{d}U\nonumber\\ \displaystyle & = & \displaystyle \frac{\unicode[STIX]{x1D708}K^{2}}{N}\langle {\mathcal{E}}\rangle ={\mathcal{I}}_{{\mathcal{E}}}\end{eqnarray}$$
and verify that the energy balance relation in (2.8) is satisfied. The results indicate, therefore, that, for small viscosity, the truncated system will converge to the absolute equilibrium solutions of such ‘temperature’  $1/\unicode[STIX]{x1D6FC}$ so that the viscous dissipation balances the energy injection rate!
3 Numerical simulations
In this section, we test the results of the previous section and extend our investigation beyond the asymptotic limit, using direct numerical simulations of the TNS system of (2.1). The simulations were performed using the ghost code (Mininni et al. Reference Mininni, Rosenberg, Reddy and Pouquet2011), which is a pseudospectral code with 2/3 de-alliasing and a second order Runge–Kutta. For all runs, the energy injection rate was fixed to unity and the integration times were sufficiently long so that steady states were reached. The forcing used is random and white in time as the one discussed in the previous section. It is limited to a spherical shell of wavenumbers satisfying  $k_{_{F}}\leqslant |\boldsymbol{k}|\leqslant k_{_{F}}^{\prime }$.
Three cases were examined. In the first case, small resolution runs were performed on a cubic domain with  $N_{G}=32$ grid points in each direction. Due to their small size, these runs allow, to some extent, a direct investigation of probability distribution function
 ${\mathcal{P}}(\boldsymbol{u})$. In the second case, the simulations were performed on a larger grid (
 $N_{G}=256$ numerical grid) that, after de-aliasing, leads to
 $k_{max}=85$ and was forced at large scales
 $(k_{_{F}}=1,k_{_{F}}^{\prime }=2)$. These simulations demonstrate the transition from a forward cascade to a quasi-equilibrium state predicted in the section before. In the third case, the simulations were designed to demonstrate the presence of an inverse flux in the thermalized state. A smaller grid was used with
 $N_{G}=128$ with
 $k_{max}=42$. The energy injection was at large wavenumbers
 $(k_{_{F}}=31,k_{_{F}}^{\prime }=35)$, while we replaced
 $\unicode[STIX]{x1D708}\unicode[STIX]{x1D6FB}^{2}\boldsymbol{u}$ by the modified viscous term
 $\unicode[STIX]{x1D708}\unicode[STIX]{x1D6FB}^{2}\mathbb{P}_{Q_{_{D}}}[\boldsymbol{u}]$ that acts only on a particular spherical set of small wavenumbers
 $Q_{_{D}}$ satisfying
 $1\leqslant |\boldsymbol{k}|\leqslant 4$. With this set-up, energy is forced to be transported inversely from the forced wavenumbers to the dissipation wave numbers.
3.1 Small resolution runs
For these small resolution runs, the energy injection rate was fixed to unity and the viscosity was set to  $\unicode[STIX]{x1D708}=10^{-4}$. The maximum wavenumber for the grid
 $N_{G}=32$ that was used was
 $k_{max}=10$. Despite the small value of
 $k_{max}$, the total number of Fourier modes in this system is still quite high:
 $N=5040$. It is thus still impossible to verify the predictions for
 ${\mathcal{P}}(\boldsymbol{u})$ in full detail for such a high dimensional space. Nonetheless, we can compare the predictions of (2.18) with the probability distribution function
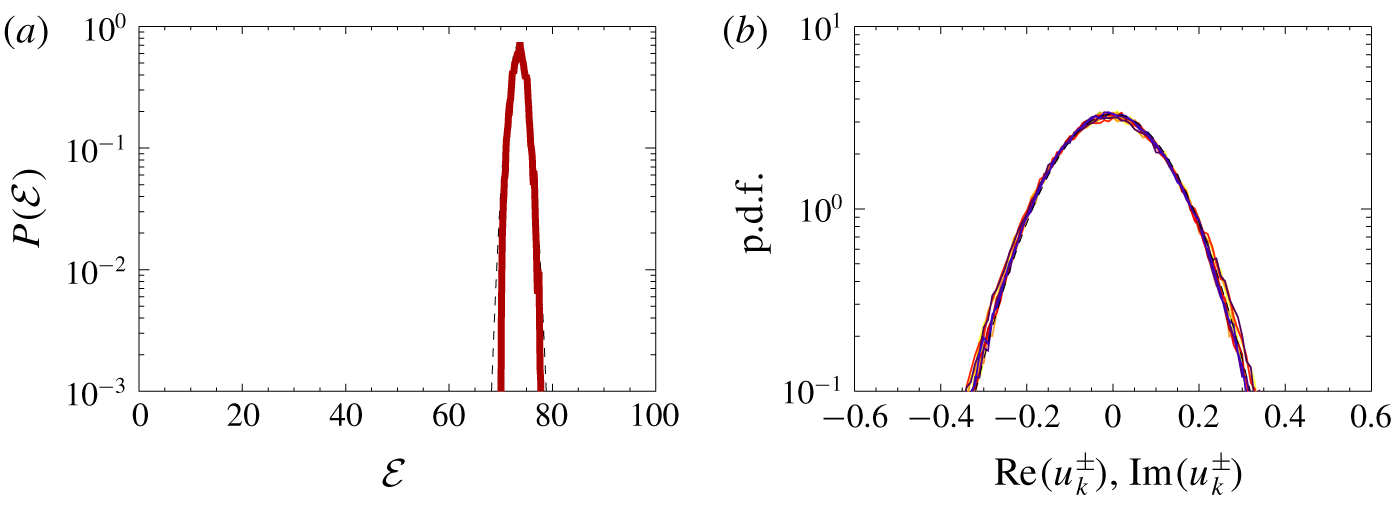
 $P({\mathcal{E}})$ measured directly from the numerical simulations. In figure 1(a), we plot with the solid brown line
 $P({\mathcal{E}})$ obtained from the numerical simulations and with the black dashed line we give the prediction of (2.18). The two curves overlap indicating that both the mean value and fluctuations around it are correctly captured. Note that for this large value of
 $N$, the distribution is highly peaked; however, there is still a finite variance of
 ${\mathcal{E}}$, indicating that
 ${\mathcal{E}}$ is a fluctuating quantity at difference with the TEE, where
 ${\mathcal{E}}$ is fixed by the initial conditions.
(a) The probability distribution functions  $P({\mathcal{E}})$ from the results of the
 $32^{3}$-grid numerical simulations compared with the theoretical prediction. (b) The probability distribution functions for the amplitudes of
 $\boldsymbol{u}_{\boldsymbol{k}}^{s}$ (real and imaginary part) for
 $\boldsymbol{k}=(0,2,0)$,
 $(0,4,0),(0,8,0)$ and for
 $s=\pm 1$.

To further explore the validity of result (2.16), on figure 1(b), we plot the probability distribution function (p.d.f.) of the real and imaginary parts of the modes  $\tilde{\boldsymbol{u}}_{\boldsymbol{k}}^{s}$ for each of the three wavenumbers
 $\boldsymbol{k}=(0,2,0),(0,4,0),(0,8,0)$ and for
 $s=\pm 1$. The results of the previous section predict that these amplitudes follow a Gaussian distribution with the same variance. There are 16 curves in total in figure 1(a) that have the same variance and perfectly overlap with the Gaussian distribution shown by the dashed line, in agreement with the prediction of (2.16). Furthermore, we calculated the elements of the covariance matrix for these modes,
 $\unicode[STIX]{x1D6F4}i,j=\langle X_{i}X_{j}\rangle$, where
 $X_{i}$ stands for the mode amplitudes
 $\text{Re}(\tilde{\boldsymbol{u}}_{\boldsymbol{k}}^{s})$ and
 $\text{Im}(\tilde{\boldsymbol{u}}_{\boldsymbol{k}}^{s})$. The off-diagonal elements
 $i\neq j$ are two orders of magnitude smaller than the diagonal elements
 $i=j$. This indicates that the Fourier amplitudes
 $\tilde{\boldsymbol{u}}_{\boldsymbol{k}}^{s}$ are independent variables with Gaussian distribution, further verifying the predictions of the previous section.
3.2 Quasi-equilibrium state and forward flux
In the previous case, although it was possible to verify some of the predictions of the previous section on  ${\mathcal{P}}(\boldsymbol{u})$, the limited range of wavenumbers did not allow us to test the predictions on the energy spectrum. To that end, we used a series of simulations on a larger grid (
 $N_{G}=256$) with
 ${\mathcal{I}}_{{\mathcal{E}}}=1$, varying the viscous coefficient
 $\unicode[STIX]{x1D708}$ from
 $\unicode[STIX]{x1D708}=2\times 10^{-1}$ to
 $\unicode[STIX]{x1D708}=10^{-10}$. We must note here that the time
 $T$ to reach saturation from zero initial conditions is proportional to the energy over the injection rate,
 $T\propto {\mathcal{E}}/{\mathcal{I}}_{{\mathcal{E}}}$, and can be very large for small values of
 $\unicode[STIX]{x1D708}$. For this reason, the runs with small
 $\unicode[STIX]{x1D708}$ started with random initial conditions, with energy close to the one predicted. The same runs were repeated with slightly smaller or larger energy to make sure all runs converged to the same point.
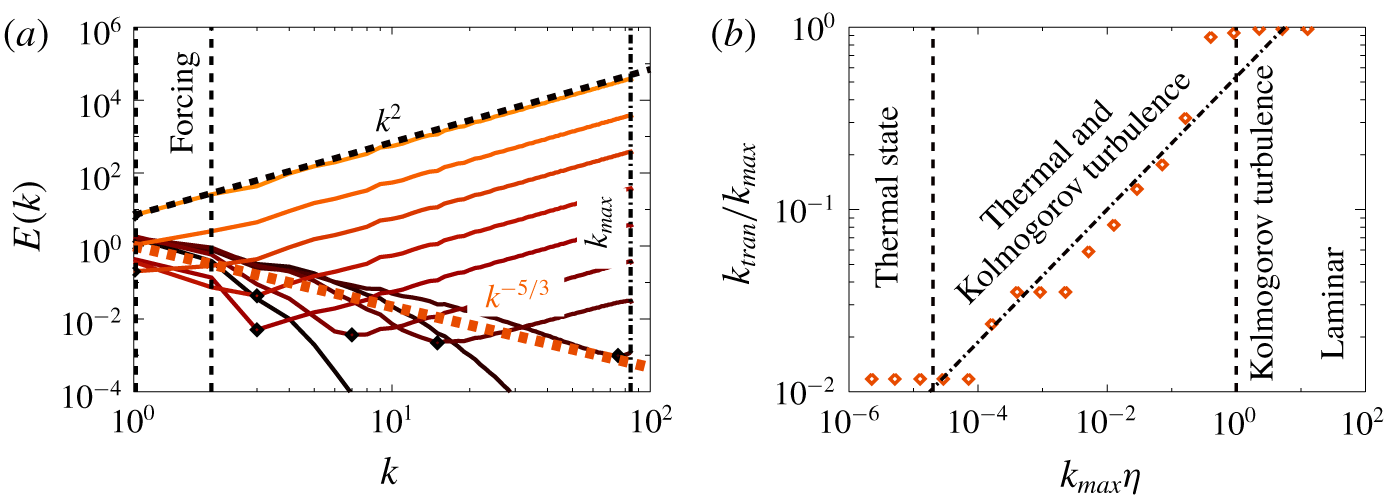
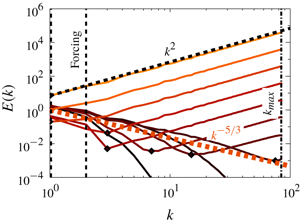
(a) Energy spectra for six different runs of the TNS equations with  $k_{max}=85$,
 ${\mathcal{I}}_{{\mathcal{E}}}=1$ and, from dark to bright,
 $\unicode[STIX]{x1D708}=10^{-1},\unicode[STIX]{x1D708}=10^{-2},\unicode[STIX]{x1D708}=10^{-3},\unicode[STIX]{x1D708}=10^{-4},\unicode[STIX]{x1D708}=10^{-5},\unicode[STIX]{x1D708}=10^{-6},\unicode[STIX]{x1D708}=10^{-7},\unicode[STIX]{x1D708}=10^{-8},\unicode[STIX]{x1D708}=10^{-9},\unicode[STIX]{x1D708}=10^{-10}.$ The forcing was restricted in the small wavenumbers and the dissipation in the large wavenumbers as indicated. (b) The wavenumber
 $k_{tran}$ where the Kolmogorov spectrum
 $k^{-5/3}$ transitions to the thermal spectrum
 $k^{2}$ as a function of the Kolmogorov length scale
 $\unicode[STIX]{x1D702}=(\unicode[STIX]{x1D708}^{3}/{\mathcal{I}}_{{\mathcal{E}}})^{1/4}$. Here
 $k_{tran}$ for the simulations (diamonds) is estimated as the wavenumber that
 $E(k)$ obtains its minimum. The dashed line gives the prediction in (3.1).

The resulting energy spectra are shown in figure 2(a) for 10 values of  $\unicode[STIX]{x1D708}$. Dark colours indicate large values of
 $\unicode[STIX]{x1D708}$, while bright values indicate small values of
 $\unicode[STIX]{x1D708}$. For the large values of
 $\unicode[STIX]{x1D708}$, the simulations are well resolved in the sense that one can observe clearly the dissipation range where there is an exponential decrease of the energy spectrum. For
 $\unicode[STIX]{x1D708}=0.01$ and
 $\unicode[STIX]{x1D708}=0.001$ (second and third dark line from the bottom), one can also see the formation of an inertial range that displays a negative power-law close to the Kolmogorov prediction
 $E(k)=C_{K}{\mathcal{I}}_{{\mathcal{E}}}^{2/3}k^{-5/3}$, where
 $C_{K}\simeq 1.6$ is the Kolmogorov constant (Sreenivasan (Reference Sreenivasan1995), Donzis & Sreenivasan (Reference Donzis and Sreenivasan2010)). As the value of
 $\unicode[STIX]{x1D708}$ is decreased, a bottleneck at large wavenumbers appears and energy starts to pile up at the smallest scales of the system. As the value of
 $\unicode[STIX]{x1D708}$ is decreased further, this bottleneck appears to take the form of a positive power-law, close to the thermal equilibrium prediction,
 $E(k)={\mathcal{A}}\,k^{2}$. This thermal spectrum occupies more wavenumbers as the viscosity is decreased, until all wavenumbers follow this scaling. At the smallest value of
 $\unicode[STIX]{x1D708}$, the result is compared with the asymptotic result obtained in the previous section. The proportionality coefficient
 ${\mathcal{A}}$ can be estimated from (2.20) to be
 ${\mathcal{A}}=5{\mathcal{I}}_{{\mathcal{E}}}/(2\unicode[STIX]{x1D708}k_{max}^{5})$, which guarantees that the energy balance condition
 $2\unicode[STIX]{x1D708}\int _{0}^{k_{max}}k^{2}E(k)\text{d}k={\mathcal{I}}_{{\mathcal{E}}}$ is satisfied. Matching the thermal with the Kolmogorov spectrum we obtain that the transition occurs at the wavenumber
 $$\begin{eqnarray}k_{tran}=k_{max}\left(\frac{2C_{K}}{5}\right)^{3/11}(k_{max}\unicode[STIX]{x1D702})^{4/11},\end{eqnarray}$$
where  $\unicode[STIX]{x1D702}=(\unicode[STIX]{x1D708}^{3}/{\mathcal{I}}_{{\mathcal{E}}})^{1/4}$ is the Kolmogorov length scale. Figure 2(b) shows a comparison of this estimate with
 $k_{tran}$ measured from the spectra as the wavenumber at which
 $E(k)$ obtains its minimum. The scaling agrees very well with the results from the simulations.
Turbulence behaviour as a function of  $k_{max}\unicode[STIX]{x1D702}$.

In summary, for values of  $k_{max}\unicode[STIX]{x1D702}$ larger than
 $k_{0}/k_{max}$ (i.e.
 $k_{0}\unicode[STIX]{x1D702}\gg 1$), the flow is laminar, displaying an exponential spectrum. For
 $1\ll k_{max}\unicode[STIX]{x1D702}\ll k_{0}/k_{max}$, there is the formation of an inertial range where the Kolmogorov spectrum dominates, followed by the dissipation range. If
 $(k_{0}/k_{max})^{11/4}\ll k_{max}\unicode[STIX]{x1D702}\ll 1$ (so that
 $k_{tran}\gg k_{0}$), then the dissipative range no longer exists, and there is coexistence of the Kolmogorov spectrum, followed by a thermalized spectrum at large wavenumbers. Finally, for
 $k_{max}\unicode[STIX]{x1D702}\ll (k_{0}/k_{max})^{11/4}$, the system is in the quasi-equilibrium thermal state predicted in the previous section. These results are summarized in figure 3.
The transition from a Kolmogorov spectrum to a thermal one closely resembles the time evolution of the TEE studied in Cichowlas et al. (Reference Cichowlas, Bonaïti, Debbasch and Brachet2005). At early times, for the TEE, a  $k^{-5/3}$ energy spectrum develops as energy is transferred to larger and larger wavenumbers. When the maximum wavenumber
 $k_{max}$ is reached, the thermalized energy spectrum starts to develop, displaying at intermediate times both spectral slopes
 $k^{-5/3}$ and
 $k^{2}$. The difference with the present runs is that in the Euler case the transition occurs as time is increased, while in the present case we only consider the steady state and vary the value of
 $k_{max}\unicode[STIX]{x1D702}$.
Similarities can also be found with the recent work on a time-reversible version of the Navier–Stokes equations (Gallavotti Reference Gallavotti1996). Using shell models (Biferale et al. (Reference Biferale, Cencini, De Pietro, Gallavotti and Lucarini2018)) and three-dimensional simulations (Shukla et al. (Reference Shukla, Dubrulle, Nazarenko, Krstulovic and Thalabard2019)) of the time-reversible Navier–Stokes equations, other authors found similar transitions from a Kolmogorov to a thermal quasi-equilibrium with the formation of both spectra depending on the parameter regime. The results were interpreted in terms of a phase transition, a possibility that could be further explored for the present work as well.
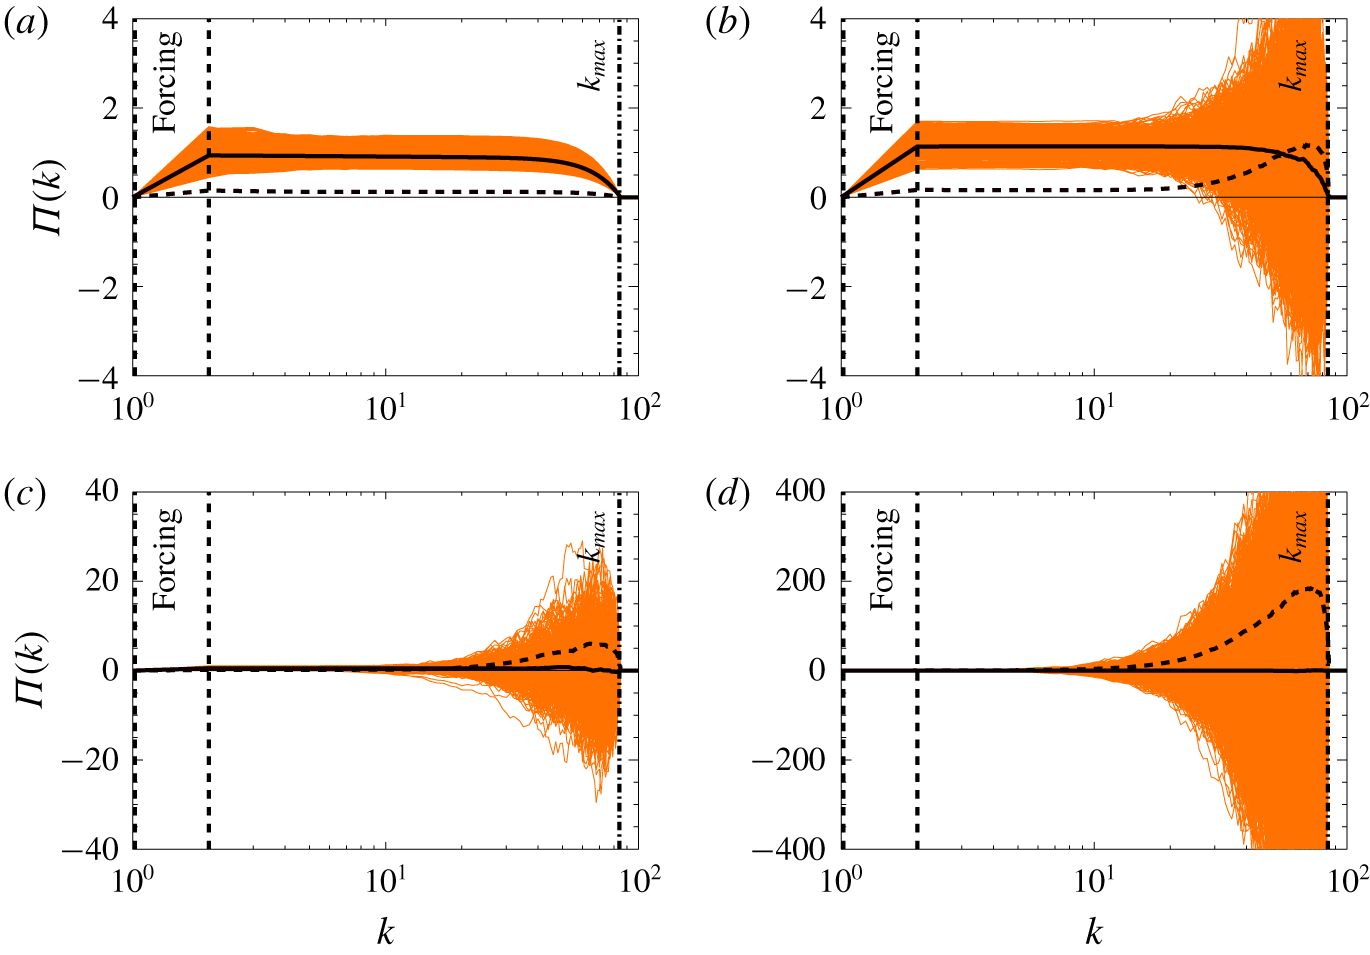
Time average energy fluxes (dark line) and instantaneous energy fluxes (bright lines) for four different values of the viscosity. (a)  $\unicode[STIX]{x1D708}=10^{-3}$. (b)
 $\unicode[STIX]{x1D708}=10^{-5}$. (c)
 $\unicode[STIX]{x1D708}=3\times 10^{-5}$. (d)
 $\unicode[STIX]{x1D708}=3\times 10^{-6}$. The dashed line shows the variation amplitude of the flux. (Note the change in scale of the
 $y$-axis in (c and d).)

We note that the time-averaged flux from large scales to small scales is constant in the inertial range. What varies as we change the value of  $k_{max}\unicode[STIX]{x1D702}$ is the amplitude of the fluctuations of the flux around this mean value of the flux. This is displayed in figure 4, where the mean flux is shown with a dark line, and the instantaneous fluxes at different times for four different values of
 $\unicode[STIX]{x1D708}$ are shown with bright colours. For
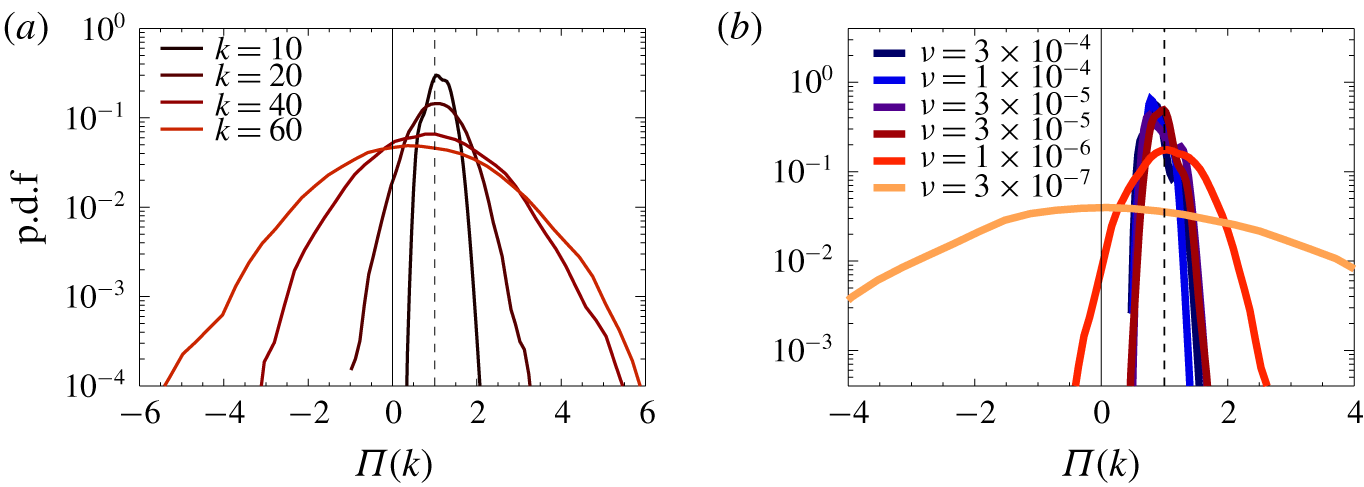
 $\unicode[STIX]{x1D708}$ in the Kolmogorov turbulence regime, the fluctuations of the flux are concentrated around the mean value without large deviations from it. As the value of the viscosity is decreased, the fluctuations at large wavenumbers are increased until, finally, the fluctuations of the mean flux are orders of magnitude larger than the averaged flux for all wavenumbers. The p.d.f.s of the energy flux for different wavenumbers and values of viscosity are shown in figure 5. Note that for a flow in equilibrium, all third-order quantities, such as the flux, have zero value. In this case, the mean value of the flux remains fixed, but the variance of the fluctuations increases as
 $\unicode[STIX]{x1D708}$ is decreased (figure 5b) or
 $k$ is increased (figure 5a). Thus, compared to the variance of the fluctuations, the mean flux becomes negligible and thus the flow is in quasi-equilibrium.
(a) Probability distribution function of the energy flux for  $\unicode[STIX]{x1D708}=10^{-5}$ at four different wavenumbers. (b) Probability distribution function of the energy flux at
 $k=20$ and different values of viscosity. The dashed line shows the variation amplitude of the flux.

3.3 Quasi-equilibrium state and inverse flux
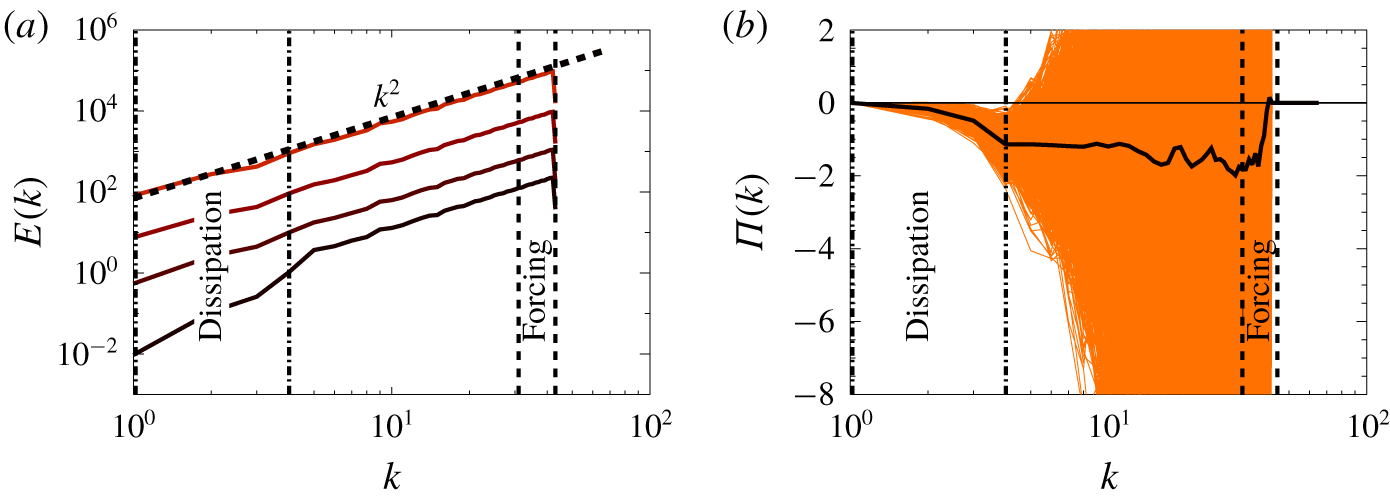
(a) Energy spectra from simulation forced at small scales and dissipated at large scales as indicated. For all runs  ${\mathcal{I}}_{{\mathcal{E}}}=1$ and, from dark to bright,
 $\unicode[STIX]{x1D708}=10,\unicode[STIX]{x1D708}=1,\unicode[STIX]{x1D708}=0.1$,
 $\unicode[STIX]{x1D708}=0.01$. (b) Time average energy flux (dark line) and instantaneous energy fluxes (bright lines) for
 $\unicode[STIX]{x1D708}=1$.

In most three-dimensional turbulent flows, the scales that are larger than the forcing scale are close to an equilibrium state (Alexakis & Brachet Reference Alexakis and Brachet2019). In many instances, however, there is a change of dynamics at large enough scales, and the flow is constrained to two-dimensional dynamics (similar to, for example, turbulence in thin layers or in rotating flows) where energy tends to cascade inversely (Alexakis & Biferale Reference Alexakis and Biferale2018). There is thus a transition from a thermal state with zero energy flux to a state that has a finite inverse flux of energy. Close to such a transition (unless the transition is discontinuous), the system has to be close to the equilibrium state with an inverse energy flux. With this motivation, we examine the case where the forcing is located at small scales, while the dissipation is limited in the large scales so that there is an net inverse transfer of energy.
We have thus performed simulations on a  $N_{G}=128$ numerical grid that leads to a
 $k_{max}=48$ forcing at wavenumbers in the range
 $(k_{_{F}}=31\text{ to }k_{_{F}}^{\prime }=45)$ with unit energy injection rate. In contrast to the previous simulations, the dissipation is limited only to small wavenumbers that satisfy
 $1\leqslant |\boldsymbol{k}|\leqslant k\mathbb{p}\prime =4$. The energy is thus injected at small scales and dissipated at large scales, forcing an inverse transfer of energy.
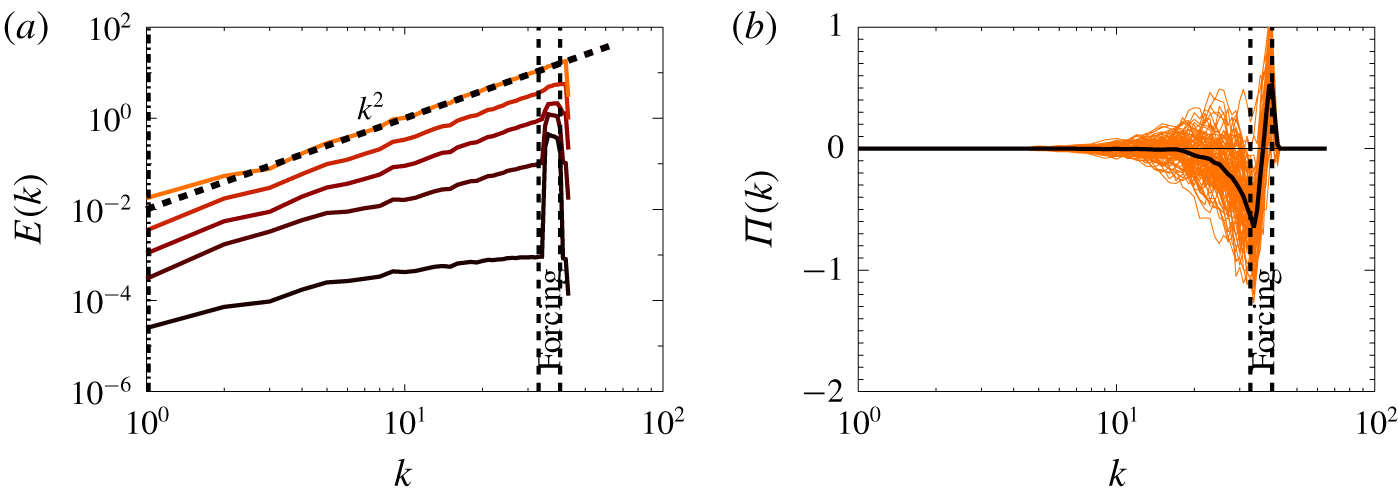
(a) Energy spectra from simulation forced at small scales and dissipated by regular viscosity. For all runs  ${\mathcal{I}}_{{\mathcal{E}}}=1$ and, from dark to bright,
 $\unicode[STIX]{x1D708}=0.01,\unicode[STIX]{x1D708}=0.003,\unicode[STIX]{x1D708}=0.001,\unicode[STIX]{x1D708}=0.0003,\unicode[STIX]{x1D708}=0.00001$. (b) Time average energy flux (dark line) and instantaneous energy fluxes (bright lines) for
 $\unicode[STIX]{x1D708}=0.00001$.

The spectra for four different values of  $\unicode[STIX]{x1D708}$ are shown in figure 6(a). The forcing and dissipation shells are indicated in the graph. In this case, a spectrum
 $E(k)={\mathcal{A}}k^{2}$ forms for all values of
 $\unicode[STIX]{x1D708}$, with small changes at the dissipation wavenumbers for large values of
 $\unicode[STIX]{x1D708}$. For small values of
 $\unicode[STIX]{x1D708}$, the amplitude of the spectrum
 ${\mathcal{A}}$ is such that the energy balance is satisfied, which leads to
 ${\mathcal{A}}\simeq 5{\mathcal{I}}_{{\mathcal{E}}}/(2\unicode[STIX]{x1D708}k\mathbb{p}\prime ^{5})$, where
 $k\mathbb{p}\prime$ is the maximum wavenumber where the dissipation acts. The dashed line shows this prediction for the smallest value of
 $\unicode[STIX]{x1D708}$. The flux fluctuations shown in the right panel of the same figure figure 6(b) are always dominant. We note, however, that their averaged value leads to a constant negative flux in the
 $k^{2}$ inertial range, where no forcing or dissipation are present. It is worth noting that in these quasi-equilibrium states the direction of the transfer of energy is not determined by the nonlinear term, as in Kolmogorov turbulence, but only by the location of the energy source and sink. If regular viscosity is used, although a thermalized state is still reached as predicted by the previous section, there is no net inverse flux of energy. This is demonstrated in figure 7 where the energy spectra and the energy flux are shown for simulations with regular viscosity forced at small scales.
4 Conclusions
In this work, we examined the spectrally truncated Navier–Stokes equations flows that are close to equilibrium. We showed analytically that in the limit of small viscosity the statistically steady state of these flows converge to the Kraichnan (Reference Kraichnan1973) solutions. We note that our prediction is not just for the spectrum in (2.20) but for the full probability distribution  ${\mathcal{P}}(\boldsymbol{u})$ in order for the system to find itself in a state
 $\boldsymbol{u}$ given in (2.16).
The derivation was based on two major assumptions. First, we assumed ergodicity for the solutions of the TEE. This assumption appears in most calculations of classical statistical physics, and, although it can only be proved in very few systems, it appears to be a plausible one for many systems with large numbers of degrees of freedom. For the TEE, it appears at least to be in agreement with the results of numerical simulations. The second assumption we made was to neglect the effect of the second invariant: the helicity. This assumption was made in order to simplify the (rather involved) calculation. Had we kept the effect of helicity, then the zeroth order solution  ${\mathcal{P}}_{0}(\boldsymbol{u})$ would have been reduced to a function of two variables,
 $f({\mathcal{E}},{\mathcal{H}})$, and we would have ended up with an elliptic partial differential equation to solve for
 $f$. However, the presence of helicity would break the spherical symmetry in phase space that allowed us to calculate the involved integrals. The calculation is still feasible, but much more lengthier and we leave it for future work.
The numerical investigation verified our analytical results and demonstrated that the Fourier amplitudes  $\tilde{\boldsymbol{u}}_{\boldsymbol{k}}^{s}$ indeed become independent Gaussian variables, and that the energy distribution and energy spectrum approach that of the analytic predictions as the asymptotic limit is reached. Furthermore, the numerical investigation also sheds light on how the TNS system transitions from the classical Kolmogorov turbulence state to the thermalized solutions of Kraichnan (Reference Kraichnan1973) as the
 $k_{max}\unicode[STIX]{x1D702}$ is varied, and led to precise predictions on when the transition takes place. The transitions are compactly summarized in figure 3, where the three different states ‘laminar’, ‘turbulent’ and ‘thermal’, as well as the transitions from one state to the other, are clearly marked. Finally, it was also demonstrated that these quasi-equilibrium states are present when the dissipation is localized in the small wavenumbers and the forcing at large wavenumbers forms an inverse flux of energy.
It is worth noting that a fixed amplitude flux (positive or negative) was always present in our simulations and that it was determined by the injection rate. However, as the quasi-equilibrium state is approached, the amplitude of the velocity fluctuations increases. These velocity fluctuations then lead to fluctuations of the energy flux to have variance that is much larger than the mean value, making this mean flux a subdominant. Furthermore, the mean energy in the quasi-equilibrium state scales as  $\langle {\mathcal{E}}\rangle \propto 1/\unicode[STIX]{x1D708}$ (see (2.19)) and therefore in the small viscosity limit the energy dissipation normalized by
 $u_{rms}^{3}k_{0}$,
 $$\begin{eqnarray}\lim _{\unicode[STIX]{x1D708}\rightarrow 0}\frac{\langle {\mathcal{I}}_{{\mathcal{E}}}\rangle }{\langle 2{\mathcal{E}}\rangle ^{2/3}k_{0}}=0\end{eqnarray}$$
becomes zero. Thus, as opposed to Kolmogorov turbulence, there is no finite (normalized) energy dissipation rate in the zero viscosity limit. We have thus to distinguish the processes of energy transfer in these quasi-equilibrium states (sometimes referred to as ‘warm cascades’) from the energy cascade that is met in classical turbulent flows. These states are dominated by fluctuations, and the direction of the energy transfer is not determined by the properties of the nonlinearity but only by the location of the sources and sinks of energy, and in general is a non-local process (see figure 14 in Alexakis & Brachet (Reference Alexakis and Brachet2019)).
There are many directions in which the present results can be pursued further. First of all, including the effect of helicity is crucial to have a complete description of the system. Moreover, carrying out the calculation at the next order so that statistics of the fluxes can also be calculated would be equally desirable. Finally, extending these results to two-dimensional flows, where the equilibrium states can take the form of large scale condensates, is another possible direction. Such calculations, although considerably longer than the ones presented here, should still be feasible and we hope to address them in our future work.
Acknowledgements
This work was granted access to the HPC resources of MesoPSL financed by the Region Ile de France and the project Equip@Meso (reference ANR-10-EQPX-29-01) of the programme Investissements d’Avenir supervised by the Agence nationale de la recherche and the HPC resources of GENCI-TGCC & GENCI-CINES (project no. A0050506421), where the present numerical simulations have been performed. This work has also been supported by the Agence nationale de la recherche (ANR DYSTURB project no. ANR-17-CE30-0004). This work was also supported by the research grant no. 6104-1 from Indo-French Centre for the Promotion of Advanced Research (IFCPAR/CEFIPRA).
Declaration of interests
The authors report no conflict of interest.