I
The modernization of early modern England was facilitated by large-scale monetary injections, which resulted from the discovery of precious metals in America. These injections interacted positively with certain characteristics of the northwestern European economies. In this article, I explain how the increased monetization and liquidity made possible by the arrival of precious metals from America buttressed early growth patterns in England.
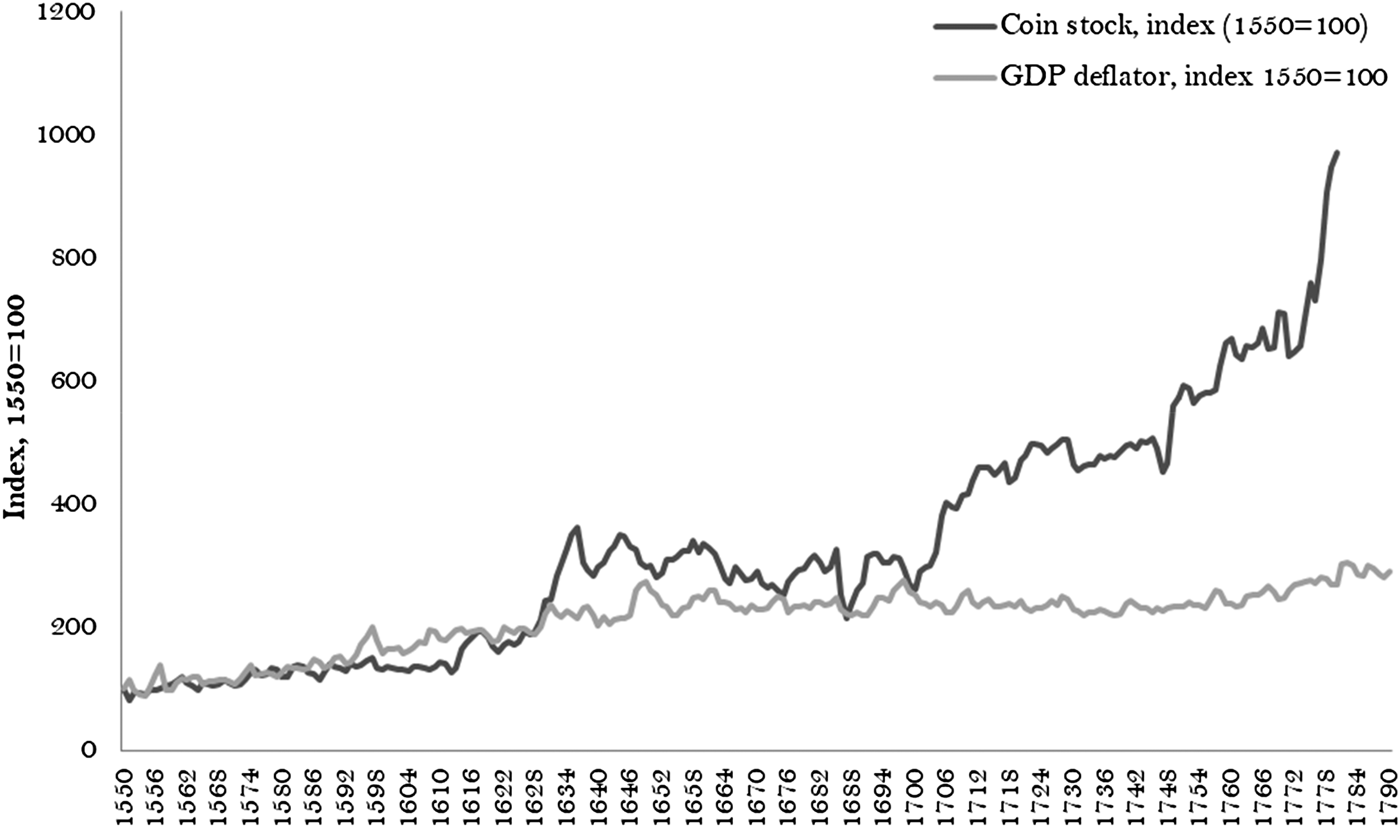
Figure 1 illustrates the scale of the English monetary injection in aggregate terms.Footnote 1 The figure shows that prices simply failed to keep up with the enormous increase in per capita coin supply.Footnote 2 The long-run evidence for England clearly contradicts a quantity-theory interpretation of the evolution of prices over the long run. The nominal coin stock increased by a factor of 22, from about £2 million in 1550 to £44 million by 1790, but the price level failed to keep up with even such a narrow measure of the money supply, having less than tripled over the same period. Consequently, real coin supply per capita increased from £1 to £1.5 in the 1550s to nearly £5 by the early 1790s (at constant prices of 1700).
Coin supply and price level, 1550–1790

The increased monetization of the English economy combined with other historical developments over the early modern period to decrease the cost of participating in markets. This in turn led to more specialization through division of labor, and to labor expansion on the intensive and extensive margins. The greater ease in making and receiving payments meant that it became easier for firms to pay the wage bill and for people to work additional days – one feature of the early modern industrious revolution.Footnote 3
Why was expanding the money supply historically difficult? The early modern monetary system was a commodity money system.Footnote 4 In this system, monetary authorities had only two ways of expanding the official (legal tender) money supply, which during the early modern period was by far the most important component of high-powered money supply (M0). The first was to debase the currency.Footnote 5 This policy tool was constrained by the equilibrium responses of private agents to mint policy, as well as competition with foreign mints (Sargent and Velde Reference Sargent and Velde2002). The only remaining possibility was to have access to new sources of bullion, through either mining or trade, as this was the critical input in the production of specie.Footnote 6 Monetary policy was conducted by means of the monetary authority setting the mint price at which private agents could coin currency from bullion, after payment of a seigniorage fee. For this, precious metals needed to be available.
As the major input in the production of specie was bullion, and since the latter was offered in inelastic supply, money supply was inelastic as well. The limited availability of precious metals meant that mint policies were restricted by equilibrium in the international bullion market. Furthermore, each coin's face value was greater than the market value of its metal content, because of the extra exchange service that each coin provided. Assaying costs were also relatively higher for smaller denominations. These restrictions, together with the indivisibility problem generated by the physical properties of commodity money (discussed in Section ii), constrained the issue of low-denomination specie.
Taken together, these restrictions led to a higher bound in the effective money that could be supplied by a monetary authority at a given moment, indexed by the availability of precious metals. From the mid fifteenth century to about 1520, the exploration of the West African coast by the Portuguese brought gold to Europe at a lower cost than had been previously possible with the trans-Saharan caravan trade. This can reasonably be described as an endogenous development and it is hard to say whether or not the increase in supply through this means was offset by relative decline in the North African caravan route. These gold injections were also of moderate quantities when measured at a European level. During the early fifteenth century there was also increasing production of silver in Burgundy, Saxony and Bohemia, and associated technical change made silver available at a lower cost than had been previously possible (Cipolla Reference Cipolla1993, pp. 174–5). But during the early modern period, Europe experienced monetary injections of unprecedented magnitude.
The availability of great quantities of precious metals in America was critical in allowing the European money supply to expand as it did in the early modern period. In their counterfactual absence, forms of ‘inside’ money including fiat, bank deposits, bills of exchange or other forms of credit could not have compensated for the relative decrease in coin supply anywhere in Europe before 1790.Footnote 7 The decrease in transaction costs encouraged people who were not already involved in the formal market economy – or were only marginally so in rural areas – to become involved, both while staying in the countryside, and, importantly, by moving to cities, hence contributing to structural change and agglomeration returns.
In England about 40 per cent of households lived mainly on wages in 1524–5, a ratio which had been approximately constant since the thirteenth century (Dyer Reference Dyer2002, p. 364).Footnote 8 But by the early 1780s few people were not directly involved in the cash economy, especially in towns (Porter Reference Porter1990, p. 187). I argue that this would not have been possible without the enormous increase in money supply. In this article I document the large-scale increase in the availability of precious metals which followed from the discovery of America, and consider in detail its effects on the English economy. I discuss a variety of channels through which it affected economic growth and modernization. I also present some comparative remarks on the effects on the continental economies.
The very large monetary injections that were the result of the discovery of America, I argue, mattered a great deal in making the English industrious and industrial revolutions possible, by alleviating the restrictions imposed on money supply by the availability of precious metals. In order for my argument to be valid, two conditions were necessary: first, money (or its substitutes) would not have expanded anyway, even if precious metals in America were not available; second, modernization would not have happened anyway, had the money supply not expanded. That is, monetization must have been a causal effect of modernization.Footnote 9 I consider the first of these conditions in Section ii, and in Section iii I address the second. Then in Section iv, I show that the English economy became deeply monetized during the early modern period. Finally, in Section v, I conclude.
II
There are three reasons why money or credit would not have expanded anyway, without the injections of precious metals from America. First, there are constraints on the power of debasement policies and how small denominations can become. Second, due to credibility problems, higher forms of money (e.g. government-supplied paper) were not a feasible alternative to coin supply at that time. And third, inside money (most credit) was a complement to, not a substitute for, coin in early modern England. These reasons are discussed in turn below.
The first alternative way to expand the money supply that I consider was the use of debasements. In principle, debasements do not require access to new metal sources. However, there are multiple problems with this policy. First, debasements could be politically unpopular. Second, if the currency was too debased, people would use foreign currency, and governments' seigniorage revenue would diminish. In addition, systematic debasements could lead to a denominational problem related to the physical property of currency as an object to facilitate exchange and liquidity – namely, either the alloy with intrinsic value would become too small relative to the overall size and weight of the coin, making it difficult to verify, or small-denomination coins would become too small to be practical. Finally, additional problems with debasements were their effects on the amount of money in circulation and the price level. As Redish (Reference Redish1990, p. 795) writes:
The political unpopularity of calling down the money and the costs of reminting meant that the adjustment was most frequently made by calling up the undervalued coin. If this were done on an annual basis to correct the coin ratings, however, the currency would have a persistent tendency to depreciate – that is, for the amount of specie per unit of account to decrease.
Irrespective of the matters of strategic considerations related to competition with foreign mints, debasements had limits. If economic growth was taking place but the supply of precious metals was not increasing, there was only one way to keep a given denomination proportional to other denominations in relative weight of precious metal content, which was to make the smaller denominations quite small in physical size.Footnote 10 Doing so had obvious disadvantages to trade, and further made assaying harder, amplifying the uncertainty of accepting any given coin in a random and non-repeatable transaction where reputation was not relevant.Footnote 11 It also amplified the ‘big problem of small change' (Sargent and Velde Reference Sargent and Velde2002), since smaller denominations became even more liquid relative to their value.
Despite these disadvantages, the policy of introducing small change was nevertheless sometimes attempted. For instance, a quarter-guinea coin weighing 2.09 grams was launched in 1718, but failed: ‘A piece so tiny, and so readily lost, was entirely unacceptable to the British public’ (Craig Reference Craig2011, p. 21). Nevertheless, the need for credible small change to support trade was pressing enough that it led essayists in mid-eighteenth-century England to continue recommending the minting of this coin (Redish Reference Redish1990).
Constrained by the limits of debasement as a policy tool, states were obliged to find new sources of precious metals if they wished to expand money supply while maintaining convertibility.Footnote 12 The good fortune of the early modern precious metals discoveries is that they alleviated these problems.
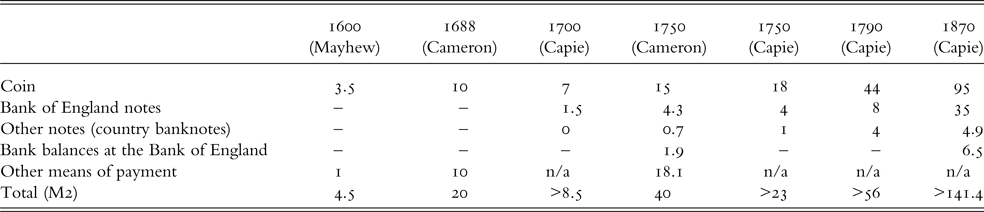
A second reason money supply might have increased even without the appearance of precious metals is that, in principle, higher forms of money could have made specie less necessary. However, it is important not to exaggerate the relevance of inside money during the early modern period. Paper money only became prevalent in Europe in the nineteenth century.Footnote 13 In England, as late as 1790, the monetary base was composed of £44 million of commodity-based coin and only £12 million in notes (£8 million of Bank of England notes and £4 million of all other notes; Capie Reference Capie and Prados de la Escosura2004; see Table 1).
Estimates for the components of English nominal money supply (unit: millions of £)
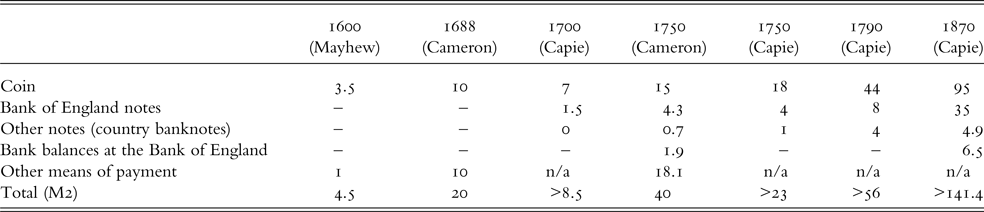
Sources: Mayhew (Reference Mayhew2013); Capie (Reference Capie and Prados de la Escosura2004); Cameron (Reference Cameron1967). The category ‘other means of payment’ includes Cameron's £6 m in government tallies and £2 m in inland bills in 1688 and £3.1 m in deposits in private banks in 1750.
The timing of the growth of fiat and other means of payment can be paralleled with the increase in the size of government. One of the most remarkable aspects of the evolution of the English economy since the mid seventeenth century was the persistent growth of the government sector, which accelerated during the eighteenth century, more than quadrupling between 1700 and 1790. The growth of government happened through a ratchet effect, with expansion during times of war not fully reversed when peace came along (Brewer Reference Brewer1989; O'Brien Reference O'brien1988).
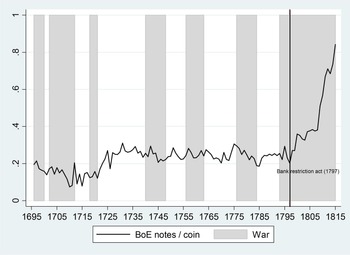
This ratchet effect was absent in the case of money supply. This is true for both coin supply and higher forms of money supply, measured either by notes of the Bank of England or broader measures that include bills of exchange and notes of provincial banks (Figure 2). The fact that until the last decade of the eighteenth century government expanded in tandem with warfare, but money supply did not, is telling as to why in earlier periods the expansion of coin supply was conditional on the availability of precious metals. The Bank of England and other financial intermediaries had the capacity to expand higher forms of money, but, concerned with their reputation and solvency, chose not to do so (O'Brien and Palma Reference O'brien and Palmaforthcoming).
The ratio between Bank of England notes and coin supply, 1694–1815
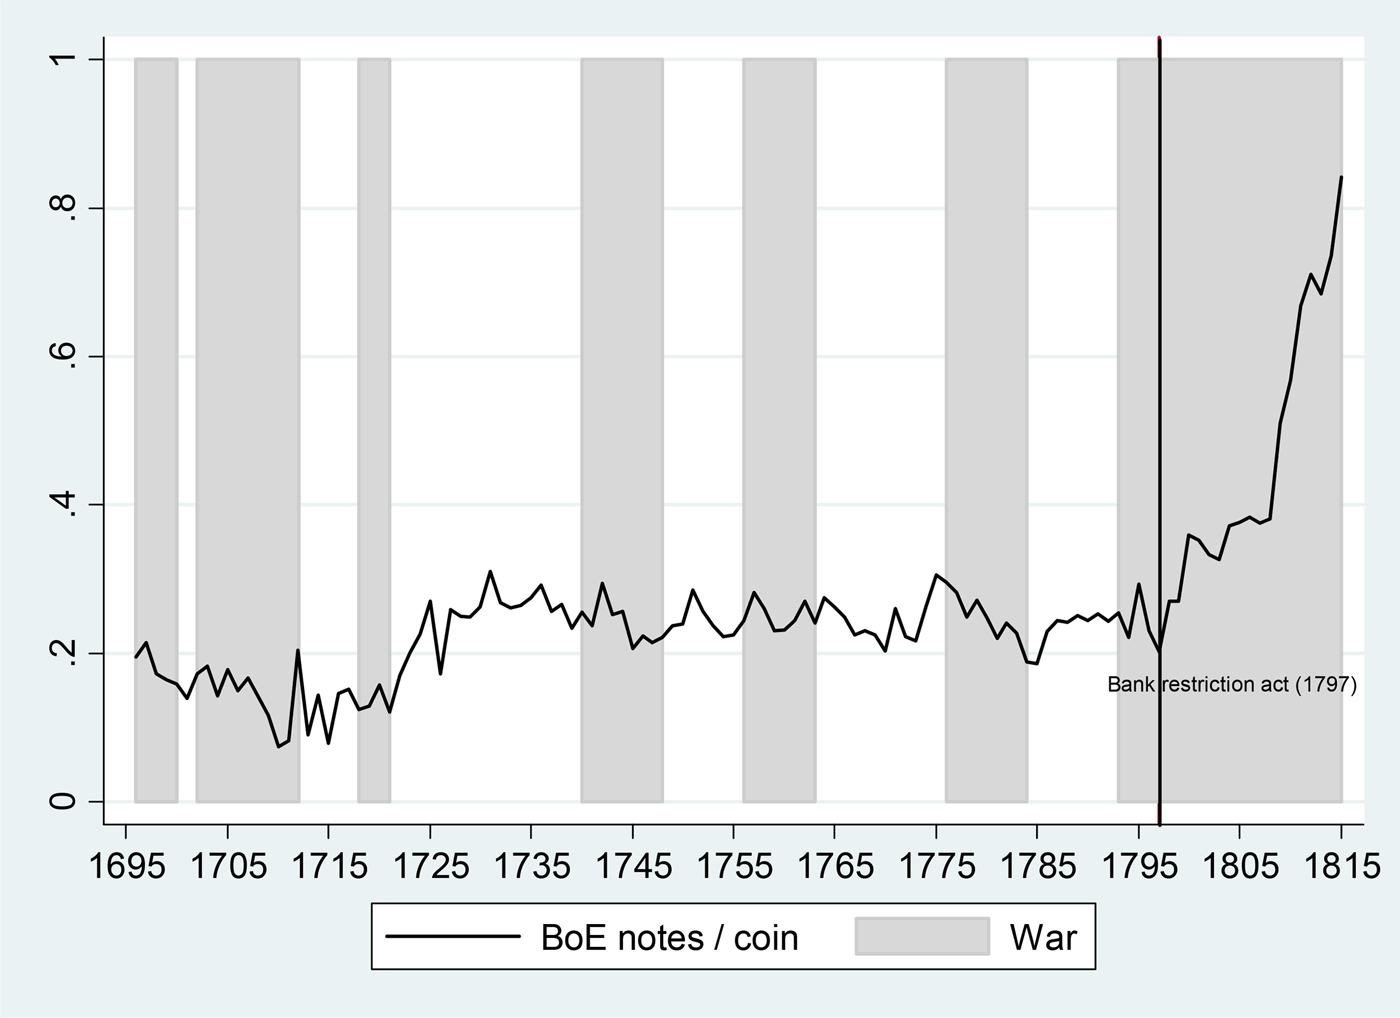
All notes of the Bank of England (and of provincial banks) were fully convertible until the Act of 1797. Only after that period was it possible for the Bank of England to expand notes significantly without running into credibility problems (Figure 2; O'Brien and Palma Reference O'brien and Palmaforthcoming). The same is true for provincial banks: ‘the arrival of country banking, combined with the note issues of the Bank of England, was not an answer to the shortage of silver in England and Wales even by the end of the eighteenth century’ (Clancy Reference Clancy1999, p. 30).
Indeed, Redish plainly states that ‘it was not possible to establish a stable token coinage prior to the nineteenth century’ (Redish Reference Redish1990). Notes both of the Bank of England and of provincial banks enjoyed limited circulation before the last decade of the century; people did not use these for retail purchases or other regular transactions (Clancy Reference Clancy1999, pp. 28–9; Feavearyear Reference Feavearyear1944; Clapham Reference Clapham1944). According to one estimate by the Board of Stamps, as late as 1812–16 the value of country banknotes annually in circulation was under £16 million (Clancy Reference Clancy1999, p. 29). Finally, it was also the case that until 1793 the lowest denomination for a banknote was £10, and until 1797 it was £5, both of which were well above the unskilled weekly wage (Schwarz Reference Schwarz1985). Only in 1797 were £2 and £1 notes issued by the Bank, which could be used as a means of exchange at the retail level. As for other English banks, until 1797 all were prohibited from issuing bearer notes of less than £5 (Feavearyear Reference Feavearyear1944).
Finally, I argue that coin and credit were complements, not substitutes. It has long been argued that an English ‘financial revolution’ had been in operation at least since the 1660s (Dickson Reference Dickson1993). This consisted of the increased usage of credit instruments such as bills of exchange and promissory notes,Footnote 14 as well as privately issued tokens, and after 1694, banknotes of the Bank of England (O'Brien and Palma Reference O'brien and Palmaforthcoming) and of provincial banks (Pressnell Reference Pressnell1956).
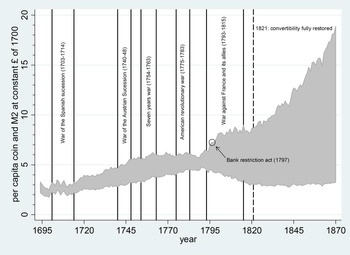
It is true that in the second half of the seventeenth century, the expansion of the English economy was supported by an expansion of credit. But as Table 1 and Figure 3 suggest, by the late seventeenth century M2 (as defined by Palma Reference Palma2018) was still quite close to coin supply. The seventeenth century's expansion of credit was not sufficient to compensate for the economic growth which was also occurring at both the extensive (population growth) and intensive (per capita) margins. This trend was only reversed in the eighteenth century, in tandem with an increase in the availability of precious metals, due to the discovery of gold in Brazil and to the shifting of mining priorities in the Spanish empire from Peru to Mexico.
British per capita coin supply and M2 at constant prices of 1700. The area in grey can be interpreted as the approximate size of inside money in circulation and held as store of value.
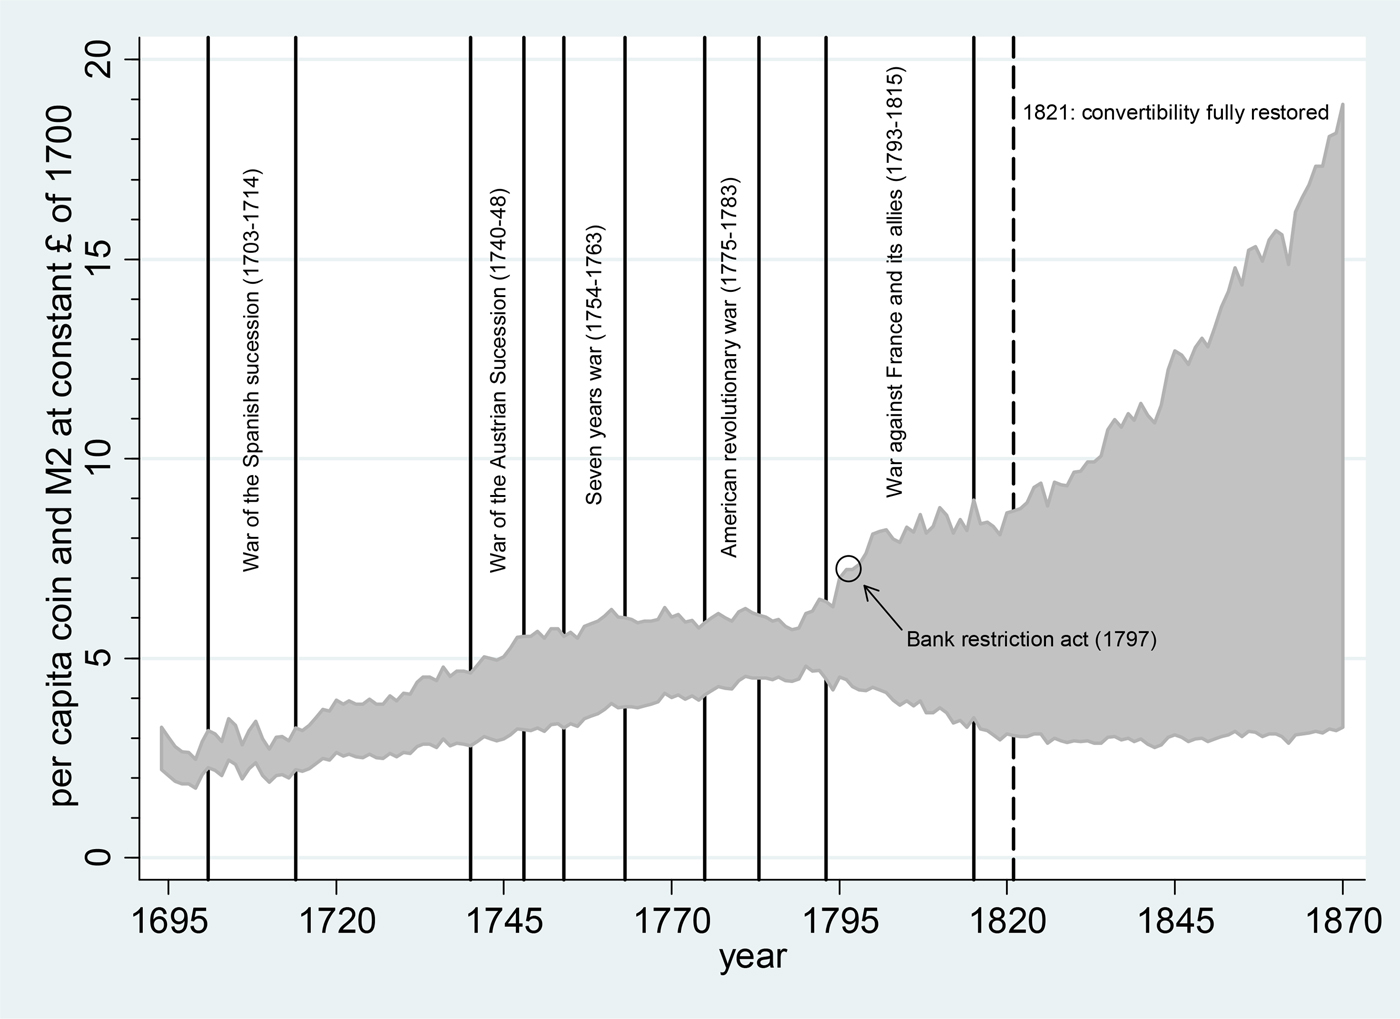
Further, the conditions of the second half of the seventeenth century in England may have been special, as they corresponded to what can essentially be described as financial sector catch-up with the best practices of the continent (Coffman, Leonard and Neal Reference Coffman, Leonard and Neal2013). Hence, while credit did expand without an increase in coin in the second half of the century, this process should be seen as a delayed response.
For the better part of the early modern period, credit and coin have been complements, not substitutes. Forms of exchange based on informal credit had been developing since the sixteenth century, but were inadequate as a substitute for coin: ‘the primary hindrance was that personal credit instruments did not circulate, at least not nearly enough to make a real difference. For commerce, agriculture and manufacturing to flourish, new sources of [outside] money had to be discovered’ (Wennerlind Reference Wennerlind2011, p. 19).Footnote 15
Hence, commodity-based coin and inside money (such as banknotes) were complements, not substitutes.Footnote 16 It is clear that ‘in the international economy of the sixteenth and seventeenth centuries, the arrival and distribution of bullion … was enough to set in motion a series of credit transactions' (Spooner Reference Spooner1972, p. 3). That is the view that modern economic theory also suggests (Holmström and Tirole Reference Holmström and Tirole2011). Credit was, additionally, subject to usury restrictions that were binding, especially for those without exemptions or access to collateral (Temin and Voth Reference Temin and Voth2008). The perceived need for means to expand currency in order to buttress commercial expansion is reflected in several contemporaneous intellectual and political debates, which I discuss in the Appendix.
A final argument supports the idea that money and credit were complements. The decision to issue credit was often based on people's anticipation of whether the debtor would have the liquidity to honor the bill, and that in turn depended on the overall availability of money (Nightingale Reference Nightingale2010). With regards to the medieval economy, peasants did use coin and were involved in market activity, to some extent, but they also faced persistent liquidity problems (Dyer Reference Dyer1997, pp. 32, 44). Credit operations in the medieval countryside involved coined money at some stage. Credit was used in lieu of coin particularly during periods of coin shortage such as the final decades of the fourteenth century along with the fifteenth, and transaction costs involved in making payments using credit networks were higher than in using coin (Mayhew Reference Mayhew and Wood2004, p. 80; Briggs Reference Briggs, Allen and Coffman2015; Spufford Reference Spufford2002, pp. 42–4).
In sum, there were only two ways by which people could issue credit, and both critically depended on reputation in the face of repeated relationships. First, richer merchants with established businesses could write bills of exchange, even internationally. Second, at the local village level, people could and did at times informally borrow small amounts from each other (Muldrew Reference Muldrew1998).Footnote 17 But this required personal and repeated relationships that necessarily limited the scope of credit – it created complications for the advancement of structural change and division of labor, which require the availability of an anonymous and liquid means of exchange for one-off transactions in cities. The lack of an easily accessible liquid means of payment meant that in medieval economies payments often had to be made on a quarterly basis or through the ‘chalking up by local tradesmen of small debts for later settlement’ (Mayhew Reference Mayhew1995, p. 239), which surely increased credit risks and transaction costs, leading to a reduced number of equilibrium transactions.
III
Why did the early modern monetary injections matter? Research has shown that in England much of the occupational migration from agriculture to industry happened during the early modern period (Broadberry et al. Reference Broadberry, Campbell and van Leeuwen2013, p. 369; Leigh Shaw-Taylor and Wrigley Reference Shaw-Taylor, Wrigley, Floud, Humphries and Johnson2014, p. 59). The industrial and service sectors already accounted for 40 per cent of the labor force in 1381, and by 1759 agriculture's share of the labor force had shrunk to 37 per cent and industry's grown to 34 per cent (Broadberry et al. Reference Broadberry, Campbell and van Leeuwen2013). Wallis et al. (Reference Wallis, Colson and Chilosi2018) show that by the early eighteenth century, only around 45 per cent of the male labor force was in agriculture. Structural transformation became particularly rapid in the decades surrounding the mid seventeenth century (Wallis et al. Reference Wallis, Colson and Chilosi2018, p. 29), which also witnessed the beginnings of sustained economic growth (Broadberry et al. Reference Broadberry, Campbell, Klein, Overton and van Leeuwen2015; Humphries and Weisdorf Reference Humphries and Weisdorfforthcoming).
From the 1630s the gradual increase in availability of real coin supply per capita allowed cash payments to become more frequent, structural change to beginFootnote 18 and income growth to occur. Higher monetization mattered directly, by making payments easier to make and receive, decreasing transaction costs and inducing specialization. The result was thicker markets and structural change. Higher liquidity also mattered indirectly, via spillover and general equilibrium effects. I now cover each of these effects separately, although they interacted with each other.
As far as transaction costs are concerned, the evidence we have is that making and receiving payments in cash was difficult even as late as the early seventeenth century. For example, an early seventeenth-century yeoman for whom we have detailed accounting information wished to rely on wage labor rather than provide food and other in-kind payment to his servants. But he decided against it upon realizing that ‘he simply did not have access to enough ready money to pay regular cash wages' (Muldrew Reference Muldrew and Lucassen2008, p. 401).Footnote 19
A number of factors mattered for the growth of urbanization during the early modern period, such as the growth of international trade (Allen Reference Allen2009 and Palma Reference Palma2016). But it is undeniable that in-kind payment is more difficult in cities, and that the lack of ready money was a reason why so much industry was traditionally located in the countryside (Muldrew Reference Muldrew and Lucassen2008, pp. 405, 410). Once liquidity became available, agglomeration economies could take place. This in turn led to more urbanization, creating a positive feedback loop with higher specialization (division of labor), the spacial concentration of specialized human capital and further urbanization.
The provision of more liquidity also had important indirect effects. The inflow of American silver meant that new goods such as tea, porcelain and silk could be imported by the East India Company, and these are widely believed to have caused an industrious revolution. But the most important effects were dynamic. These can be separated into learning externalities, industrial expansion effects and related demand effects. The new goods from Asia induced demand towards import substitutes, which spilled over into industrial development. In England, it is hard to conceive of important porcelain centres such as Worcester or Derby appearing if the early modern Euro-Asian trade had not happened.Footnote 20 There was also additional demand for English products from first-order receivers of the silver and gold, Spain and Portugal.Footnote 21
Tax collection was made easier by a more monetized and urbanized economy collection, raising the fiscal capacity of the state (Capie Reference Capie and Prados de la Escosura2004; Desan Reference Desan2014, p. 256). In turn, higher fiscal capacity meant that investment conditions were more attractive, and England could be a provider of transport trade services as a result of the establishment of the Royal Navy – itself a result of comparatively high fiscal capacity.
Monetary injections also helped in avoiding deflation. If the price level could adjust immediately to changes in money supply, then any change of unit of account or the overall quantity of money would not matter. As it was, whether due to social norms, menu costs, or other factors, price and especially wage rigidity was a reality (Palma Reference Palma2016).Footnote 22 In early modern England, despite the price revolution which occurred prior to the eighteenth century, customary rents were normally fixed in nominal terms. Contracts often covered a number of generations, and there were substantial benefits for tenants who were able to defeat their landlords' attempts to raise rents (Holt Reference Holt and Whittle2013). Indeed, not only was price adjustment persistently absent or incomplete for long periods of time, but it was also asymmetric – in eighteenth-century France, for instance, following changes in the unit of account, upward price adjustments were much faster and less penalizing for the real economy than downward adjustments (Velde Reference Velde2009).
Several recessionary mechanisms associated with deflation can be posited. Despite the relatively small size of financial intermediation, debt-deflation might have been a serious concern in the absence of the monetary injections.Footnote 23 For a given country, as the internal price level falls, the real exchange rate will appreciate and the economy will become less competitive. Furthermore, if deflation is avoided for a group of countries as a whole, this can be beneficial for all (Eichengreen and Sachs Reference Eichengreen and Sachs1985). Expectations about continued falling prices may also lead people to delay consumption expenditures.
As I have argued, in England monetary injections mattered in part because the additional liquidity avoided persistent deflation.Footnote 24 In the Middle Ages, supply of precious metals was quasi-fixed and hence deflation was a persistent phenomenon. According to the Broadberry et al. (Reference Broadberry, Campbell, Klein, Overton and van Leeuwen2015) price deflator, it took until the 1530s for the price level to recover to the pre-Black Death level. This episode of persistent deflation from the fifteenth century onwards is associated with the late medieval bullion famine (Day Reference Day1978; Spufford Reference Spufford1989, pp. 340, 343; Dyer Reference Dyer2002, pp. 266, 384). Although some elements of the original story were subsequently criticized (Sussman Reference Sussman1998), the lack of availability of precious metals was in fact at this time an important element in preventing growth (Miskimin Reference Miskimin1964; Nightingale Reference Nightingale1990, Reference Nightingale1997, Reference Nightingale2010; Desan Reference Desan2014; Le Goff Reference Le Goff2012, p. 143).
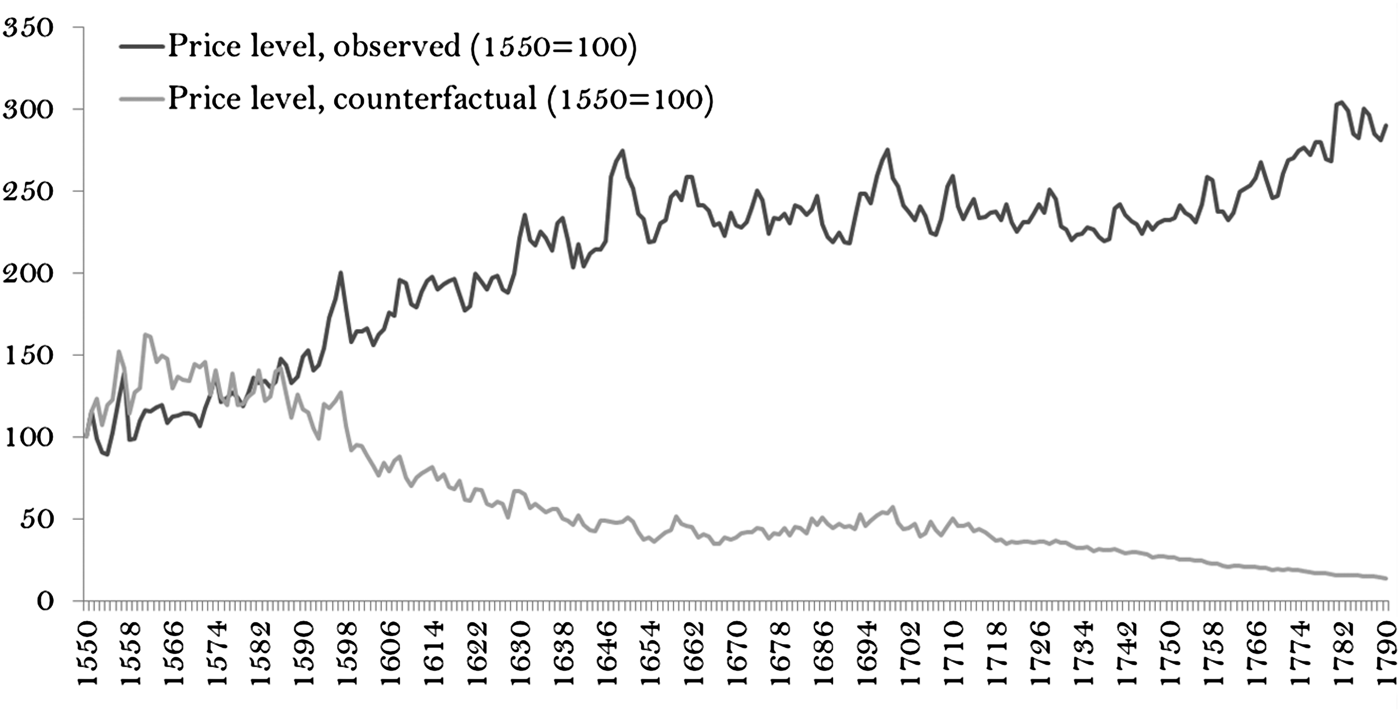
Recent data suggest that England suffered from persistent secular deflation from the early fourteenth century to the first decade of the 1530s (Broadberry et al. Reference Broadberry, Campbell, Klein, Overton and van Leeuwen2015).Footnote 25 Figure 4 shows the evolution of the price level from the mid sixteenth century until 1790.Footnote 26 The figure shows the observed price level and a counterfactual price level where the money supply is fixed at the 1550 level. The counterfactual evolution of the price level is calculated using the equation of exchange, MV = PY, and using the orthodox assumption that Y and V are independent of M in the long run.Footnote 27
Observed and counterfactual price levels
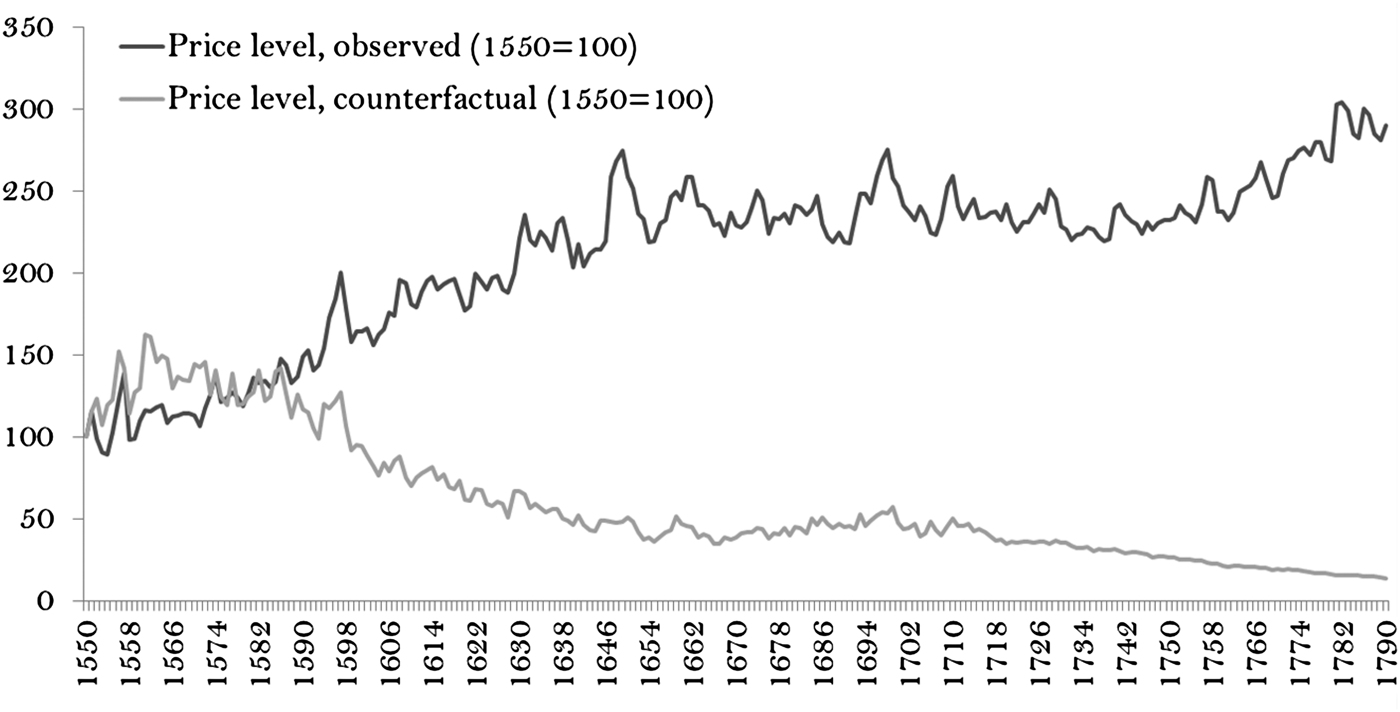
A short macroeconomic history of early modern England in relation to monetary history can hence be told as follows. The sixteenth century was a century of stagnation for England, in terms of both per capita real GDP and money supply. While silver from South America was arriving in Spain in significant quantities (and, by extension, the territories of modern Belgium and the Netherlands, as well as Italy), English nominal coin supply increased, but these increases were outweighed by increases in population and the price level. The increase in coin supply did lead to some inflation, which eventually terminated the previous status quo of stagnating nominal wages.Footnote 28 Inflation may have encouraged wage-labor share growth, and may have had other distributional consequences,Footnote 29 but it did not lead to observable per capita income growth.Footnote 30
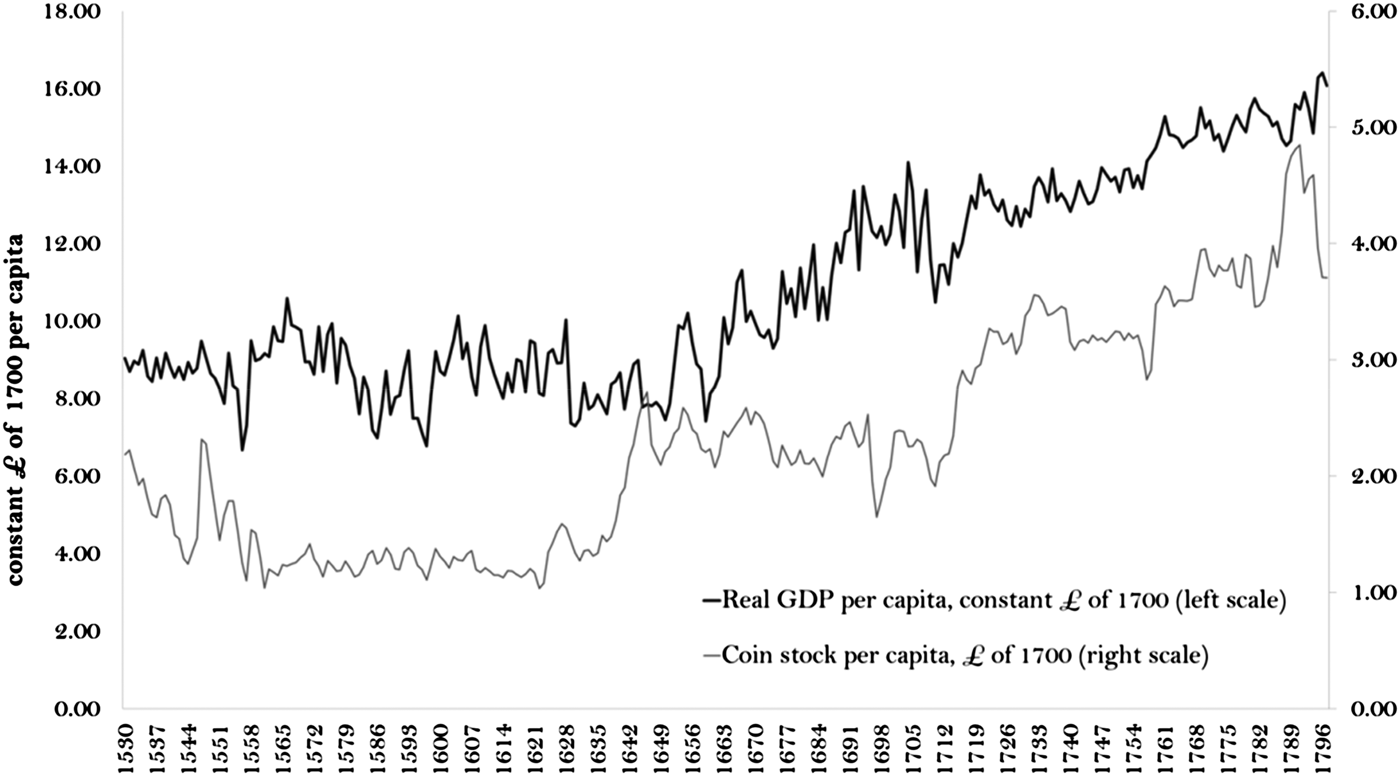
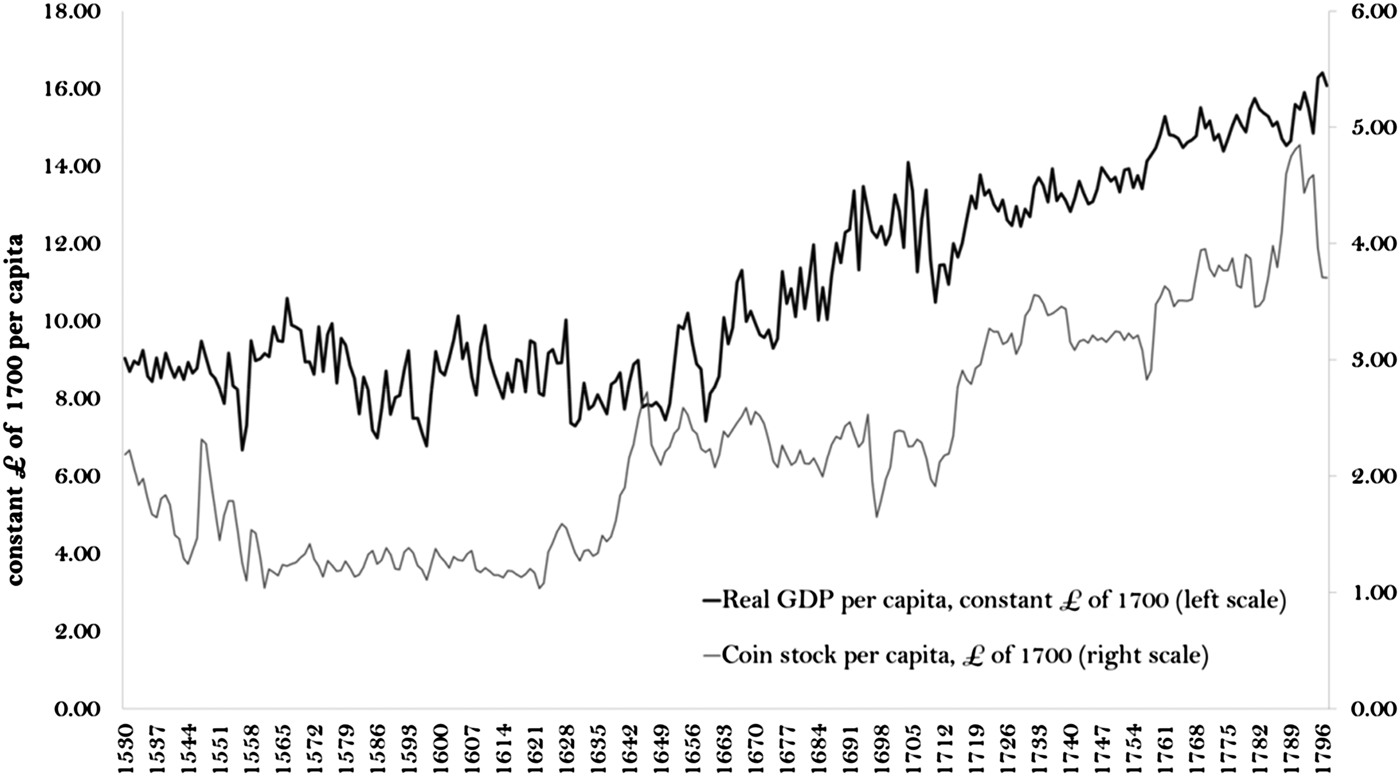
It took until the early seventeenth century for precious metals from America to start having a significant effect on England's money supply. This effect pre-dates the very significant (for the standards of the time) growth which then occurred (Figure 5). From the Cottington Treaty of 1631 onwards, both private merchants and asentistas in Spain sent silver bullion and coin to Flanders aboard English vessels.Footnote 31 These would first stop in Dover where two-thirds of the silver would be transported to the Tower mint in London to be turned into English coinage. These agents would then ‘use the coined silver to buy bills of exchange from English merchants redeemable in Flanders' (Kepler Reference Kepler1976, p. 37).Footnote 32
Real income and coin supply per capita
After 1639, a decisive defeat of the Spanish fleet by the Dutch Republic meant that ‘Spain became even more dependent upon English carriers than she had been previously’ (Kepler Reference Kepler1976, p. 65). After this date, the Spanish placed ‘vital importance … on cultivating good relations with England’ (Kepler Reference Kepler1976, p. 66). But conversely, the volume of imported Spanish silver ‘explains why parliament, which was almost totally dependent upon the City for liquid funds … was anxious to give all possible guarantees of State protection to the Spanish silver factors and their principals' (Kepler Reference Kepler1976, p. 85).Footnote 33 The Dover entrepôt and the Cottington Treaty operated for 16 years, from 1631 to 1647. From then onward, the Dutch took over much of this carrying trade (Kepler Reference Kepler1976, p. 90).
Figure 5 contrasts per capita coin supply and real income, focusing on the period after the Great Debasement of 1542–52. As we can see, in the second half of the sixteenth century, real per capita coin supply was essentially trendless. It then rose sharply in the period 1620–40, slightly anticipating the persistent growth in per capita output.Footnote 34 Coin supply then slowly decreased (in per capita terms), always staying well above the pre-1620s level.Footnote 35 These changes over time illustrate well the limitation of the monetary approach to the balance of payments (McCloskey and Zecher Reference McCloskey, Zecher, Frenkel and Johnson1976), because they show that geopolitical changes often mattered more for explaining net flows of silver than variation in income or productivity (for an example, see Kepler Reference Kepler1976, p. 72).
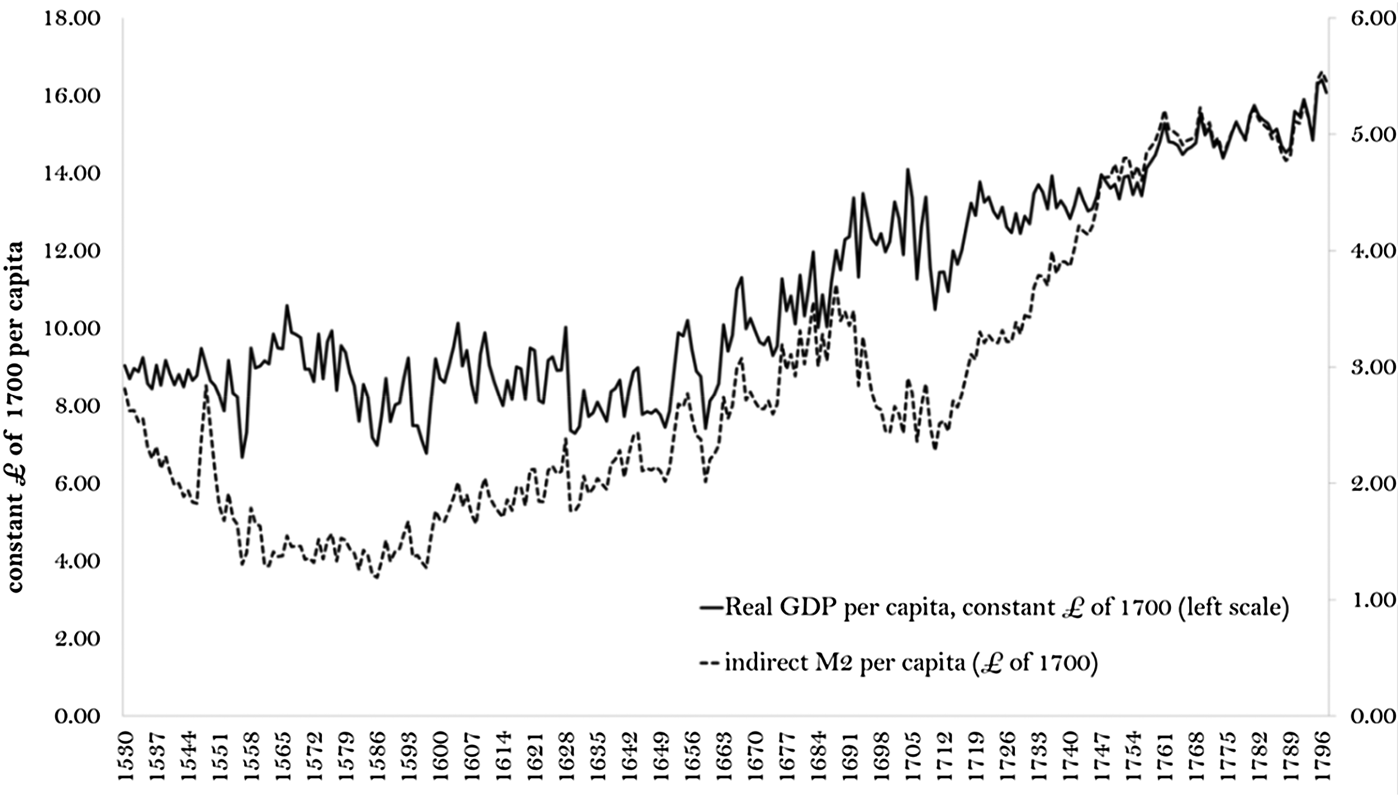
Stagnation in coin supply during the second half of the seventeenth century led to coin of increasingly bad quality until the Great Recoinage of 1696, but this was largely compensated for by circulation of inside money (Figure 6).Footnote 36 Finally, in the eighteenth century, there was an increased availability of gold and a rise in per capita coin supply in association with the discovery of Brazilian gold and the Methuen Treaty,Footnote 37 as well as with the Spanish Bourbon shift of the American empire towards the Mexican mines.
Real income and indirect M2 per capita

IV
Several scholars claim that the early modern period was characterized by a dramatic lack of liquidity, and in particular a lack of small denominations (e.g. Muldrew Reference Muldrew and Lucassen2008).Footnote 38 But these studies present no systematic quantitative evidence that allows either a temporal or cross-sectional perspective. How can we in fact know which denominations circulated at different times?
Studying hoards is not ideal for this purpose, because people hoard at particular times, usually times of unrest – which explains why so many hoards exist for the civil war period (Besly Reference Besly2003, p. 123). Accordingly, it is not surprising that large denominations dominate hoards even for periods when petty coins may have been much more important than the hoards suggest. A better option is the study of individual (stray) finds. These are coins that appear isolated because they were lost. They may appear in urban or rural contexts, often in the middle of rural fields most likely due to having been lost on the floor of a home, swept away during cleaning and then released in the fields together with other domestic refuse which served as fertilizer (Dyer Reference Dyer1997, p. 36).
These individual coins are currently being found by metal detectors at a growing rate of several per year. In order to study denominations systematically, I rely on a UK government programme, called the Portable Antiquities Scheme, which records findings of archaeological interest by members of the public, often metal detectorists.Footnote 39 Over 16,000 post-medieval coins have been recorded on the database; for this study I consider only single-coin finds.Footnote 40
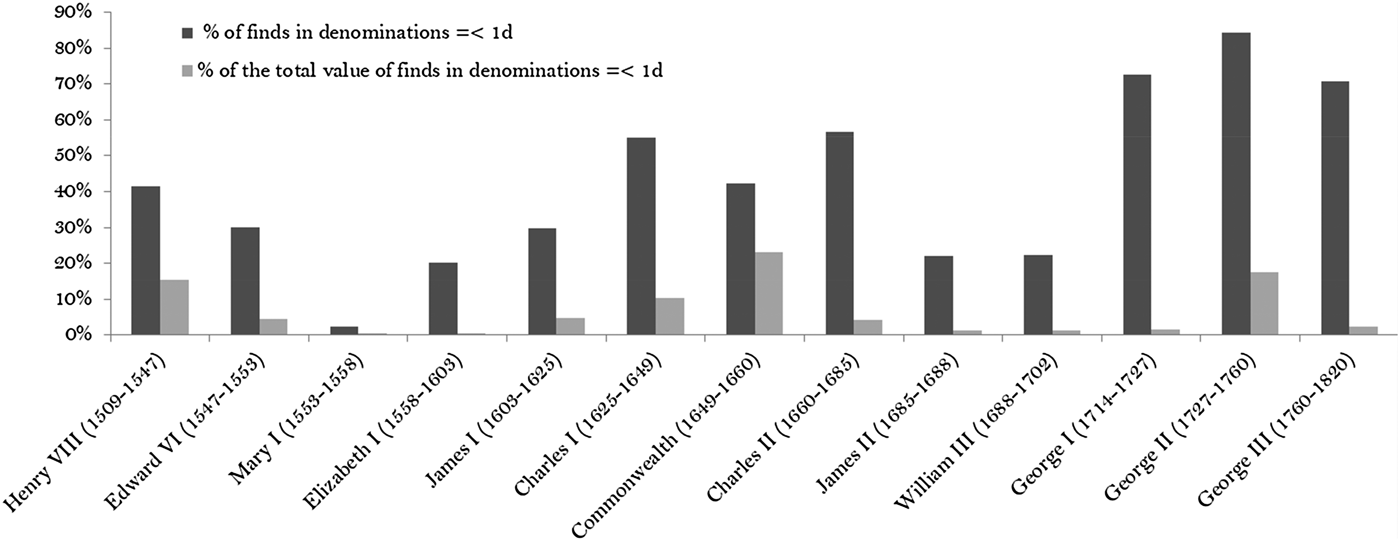
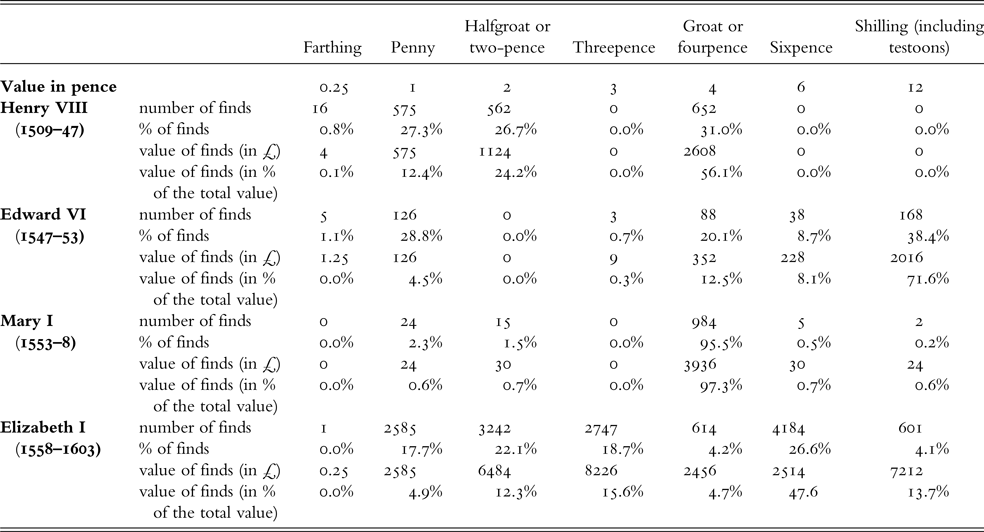
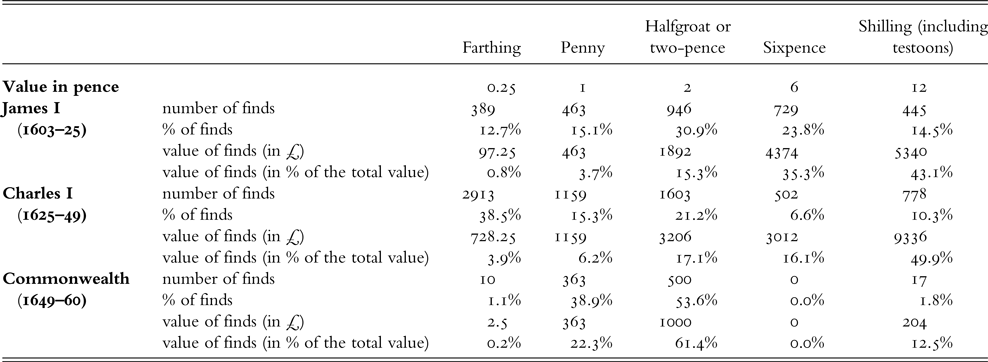
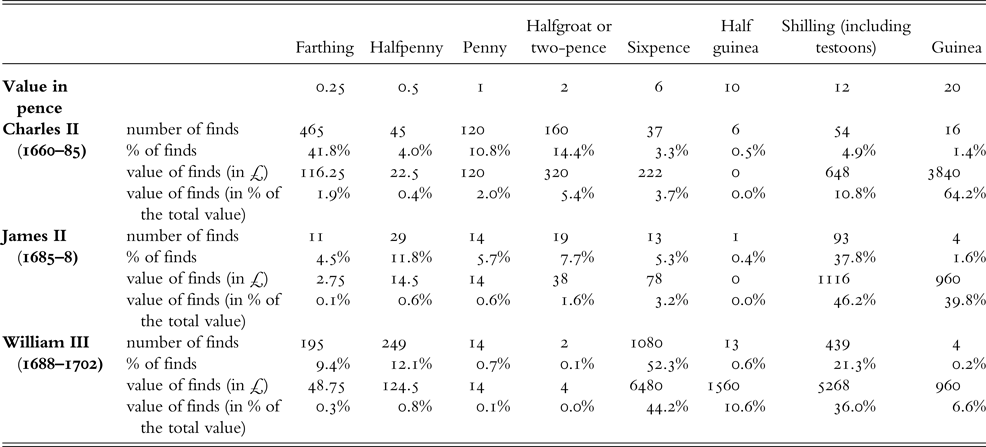
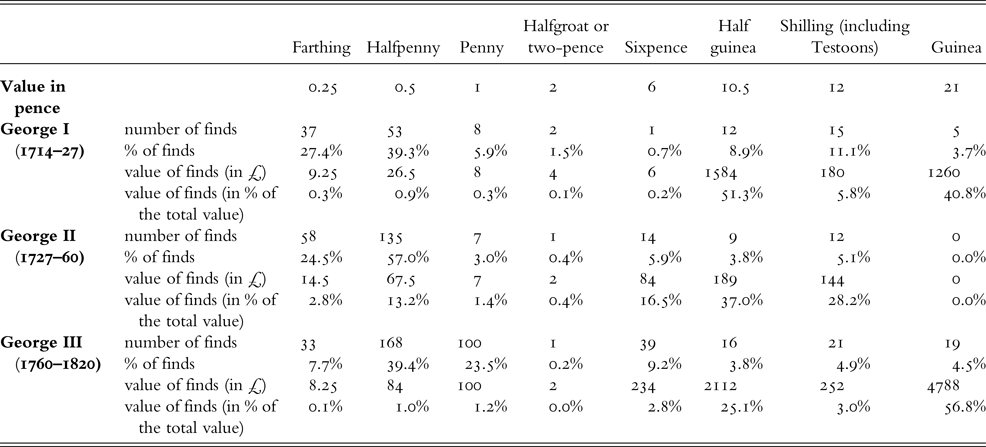
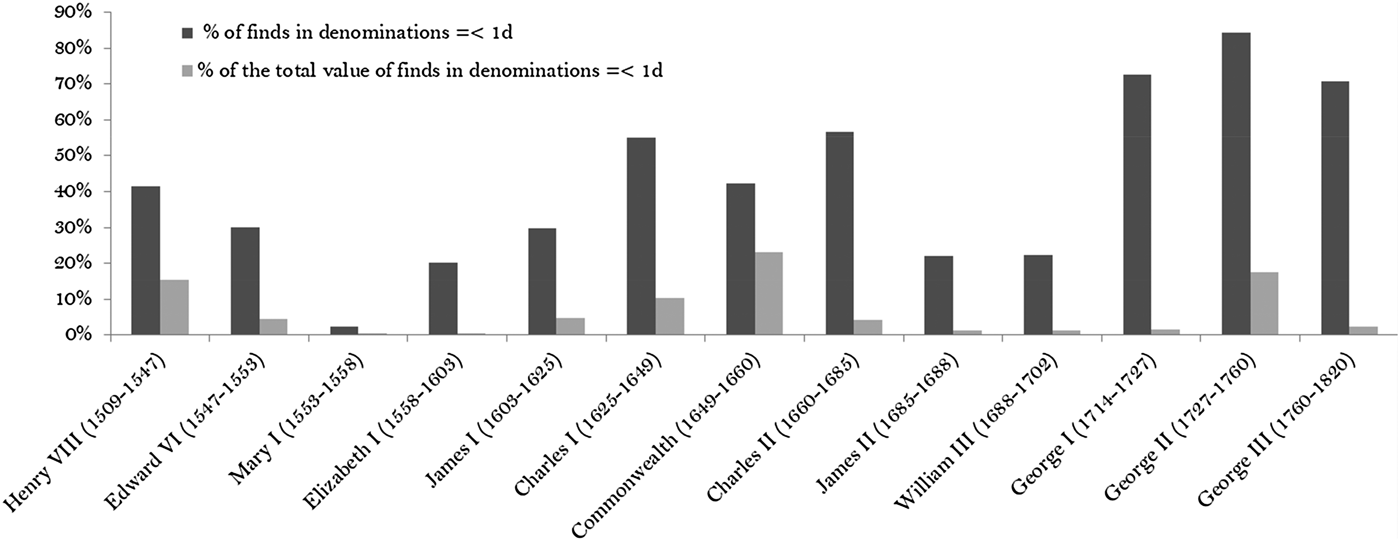
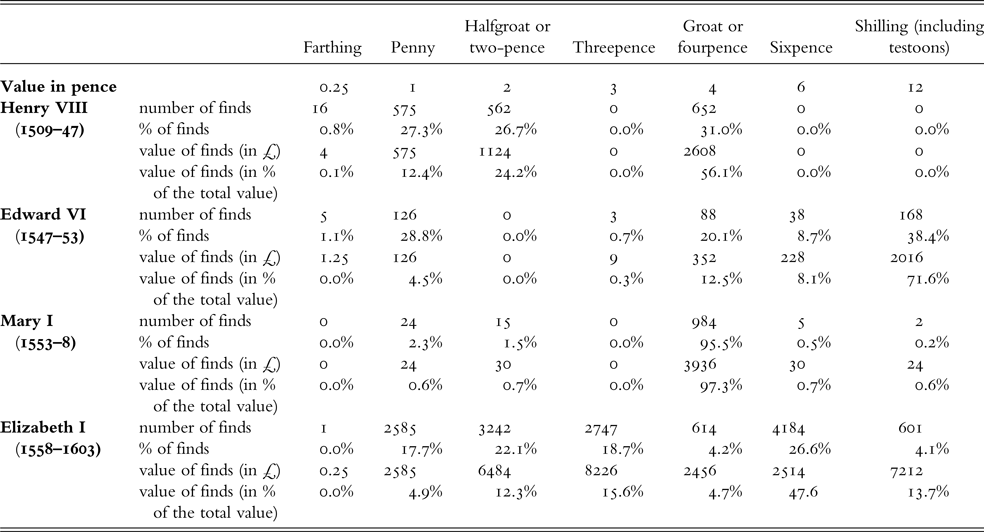
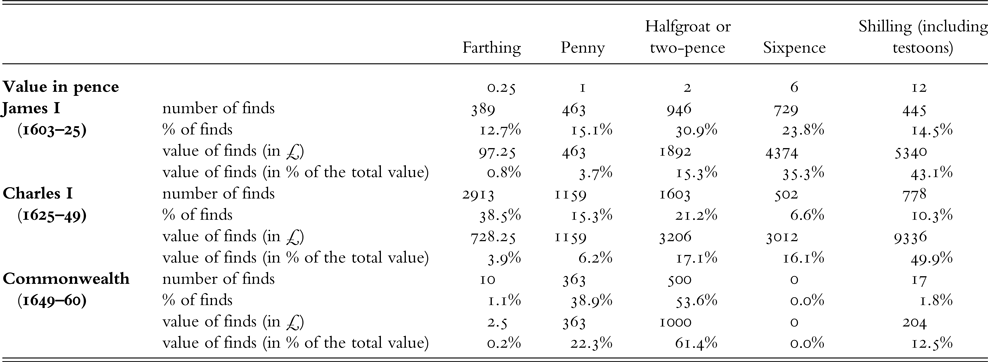
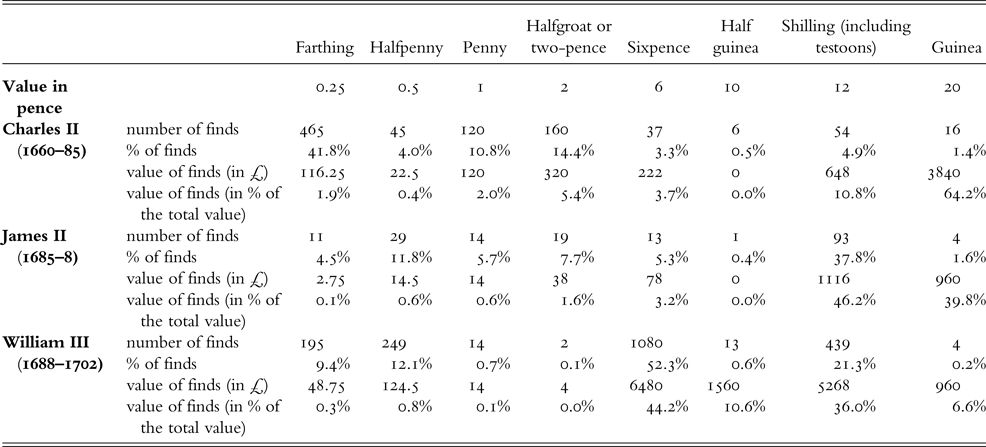
Coin periods are identified by reigns. For each reign, I have counted the number of coins of each denomination as well as their total value. Tables A1–A4 in the Appendix show the full details, and Figure 7 summarizes the results. As the figure shows, denominations of 1 penny or less become common – more than 50 per cent of finds – only from the period of Charles I onward.Footnote 41
Distribution of denominations for different periods
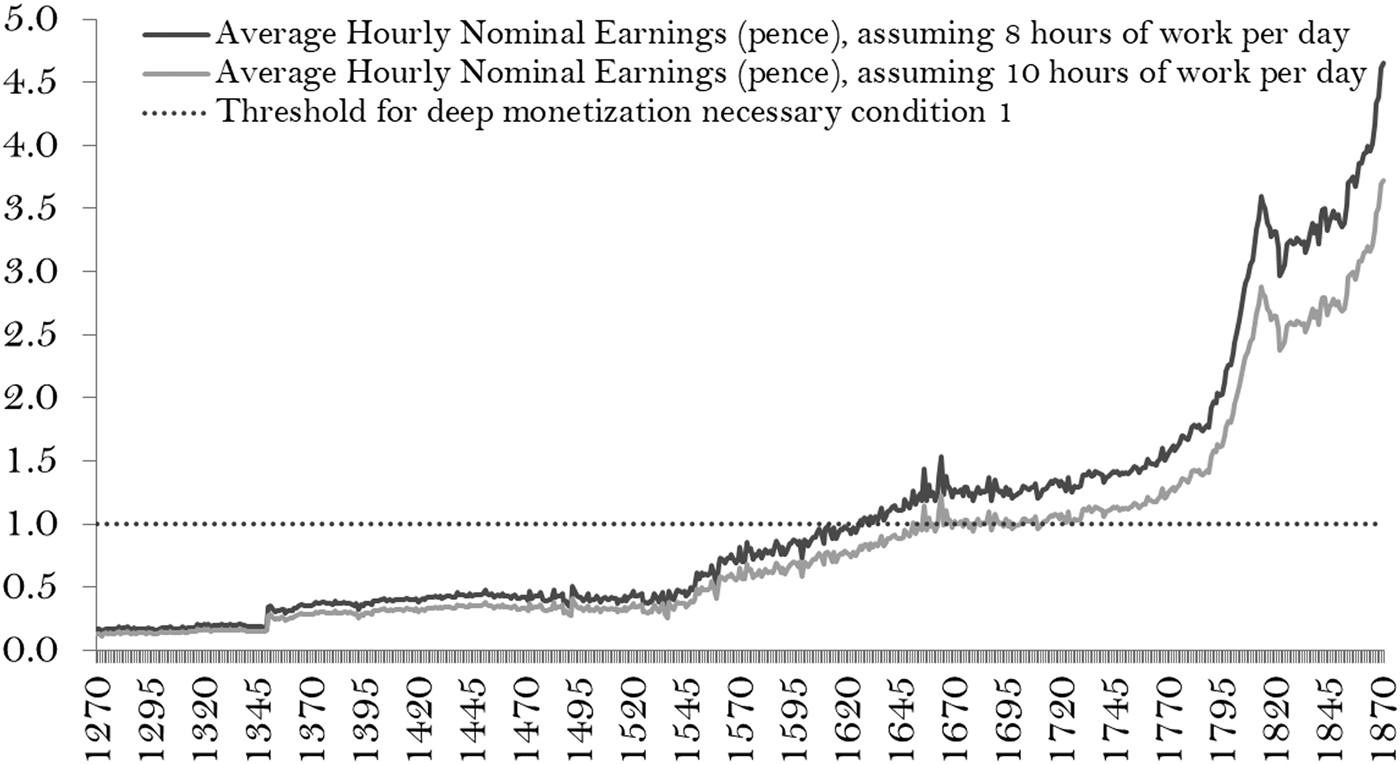
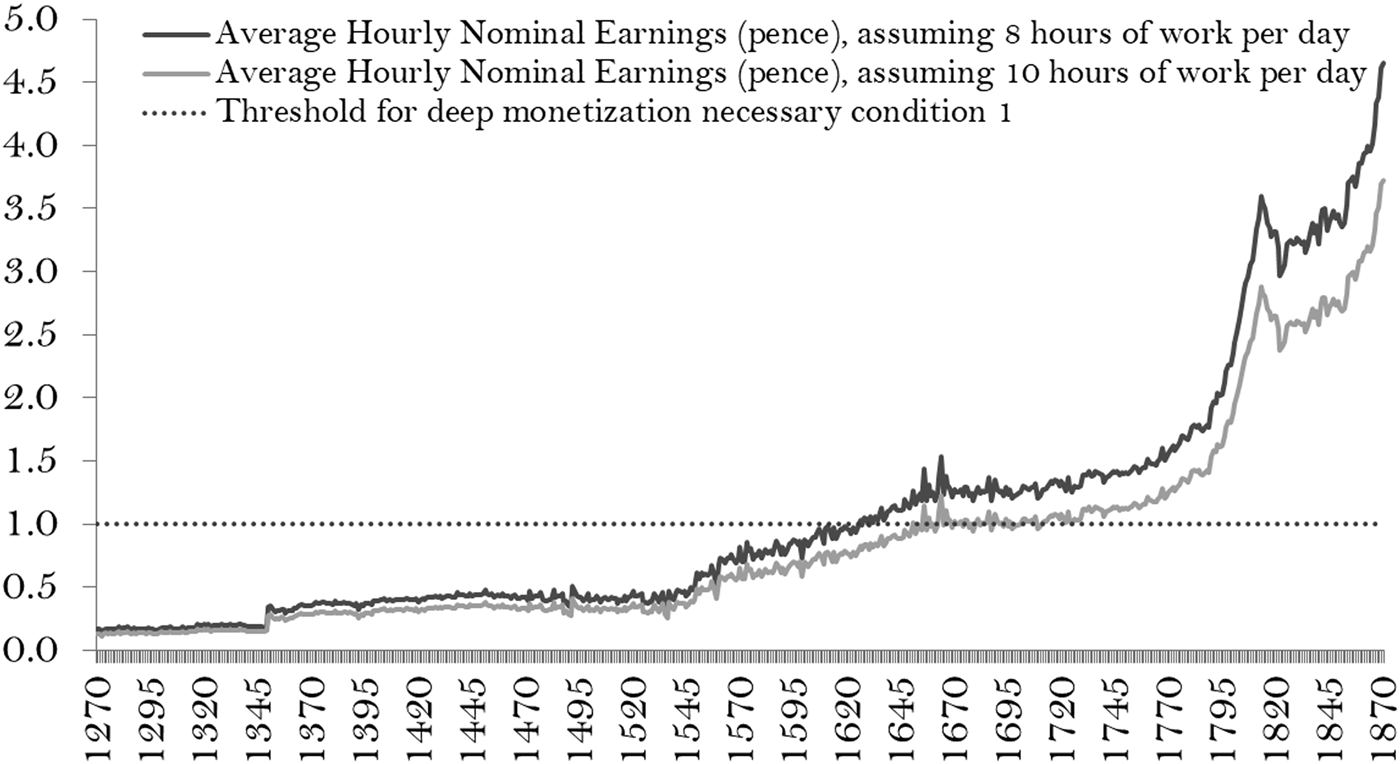
Lucassen (Reference Lucassen2014, p. 74) defines deep monetization as the intersection of two conditions which are jointly sufficient for a society to be considered as such. First, denominations must exist which are equal to one hour or less of waged work. Second, these must exist in sufficiently large quantities, defined as a per capita quantity equal to five or more hours of waged work. If these conditions hold, a society can be considered to have a substantial stock of small change. He identified deep monetization as being present in the Netherlands in parts of the early modern period, as well as after 1840. Using this concept, I show here that the English economy was deeply monetized since at least 1630–60.
Figure 8 considers the first of Lucassen's conditions. We can safely choose the penny as the smallest candidate denomination because the only other denomination which appears in significant quantities, the farthing, or a quarter of a penny, would certainly not fulfill the second necessary condition – see Tables A1–A4 in the Appendix. As Figure 8 shows, the period after 1630/1660 fulfills the first deep monetization condition.Footnote 42
Deep monetization necessary condition 1: existence of small denominations
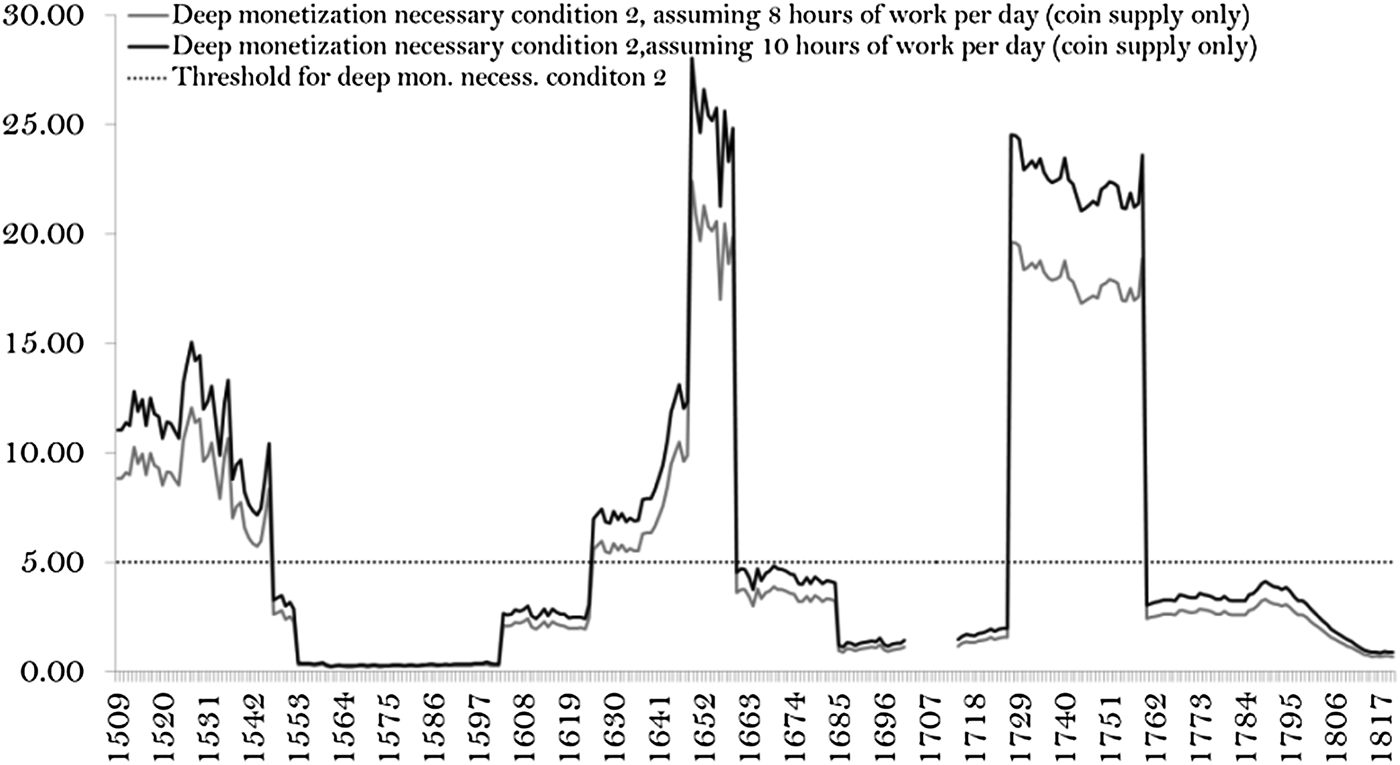
In turn, Figure 9 considers the second deep monetization condition. For which periods does small cash exist in sufficiently large quantities? Lucassen defines sufficiently large as a per capita quantity equal to five or more hours of waged work. Hence, I use the percentages in value equal or smaller than a penny from Tables A1–A4 in the Appendix, and I multiply this by the coin supply from Palma (Reference Palma2018).Footnote 43 This gives me a measure of small cash available per capita, which I then divide by the average hourly nominal wages from Clark (Reference Clark2018).Footnote 44 The result is shown in Figure 9; notice that I can only show this for the periods for which I have the denomination shares breakdown, hence 1509–1820.
Deep monetization necessary condition 2: availability of sufficient cash

If we intersect the necessary conditions of both figures, we can then conclude that only the periods 1630–60 and again from the late 1720s to about 1760 were deeply monetized in England.Footnote 45 However, we should not be too quick to conclude that the second halves of the seventeenth and eighteenth centuries were not well monetized. First, notice that a large subset of these periods, 1660–85 and 1760–95, were below, but close, to the threshold. But more importantly, the figure only refers to coin supply availability. Since outside money such as inland bills of exchange and other forms of creditFootnote 46 were also used, actual money supply was surely higher.Footnote 47 O'Brien and Palma (Reference O'brien and Palmaforthcoming), for instance, document how after 1797 the Bank of England issued large quantities of banknotes of denominations low enough to pay wages, but this is not represented in Figures 8 and 9. Overall, I find strong evidence against Muldrew's claim that ‘liquidity was no better in the eighteenth and early nineteenth century’ than in earlier periods (Muldrew Reference Muldrew and Lucassen2008, p. 393).
V
Noting that in the Netherlands payment in kind was of secondary importance to cash during the early modern period, De Vries and Van der Woude (Reference de Vries and van der Woude1997, pp. 81–9, 714) write that ‘[m]onetization is clearly a critical factor in the spread of the calculating, rational conduct that we associate with a modern society’. There is little I can disagree with in this statement, though the evidence for England does not support their later claim that ‘not until the nineteenth century did Europe raise up an equal in this respect’.
American precious metals permitted a dramatic increase in English monetization, which in turn generated Smithian growth, supported state-building and facilitated the transition into modern economic growth. From a comparative perspective, one important question is why this did not happen elsewhere, namely in the first-order receiving countries – Spain for the entire early modern period, and Portugal after about 1700. One possibility is that these two countries suffered from the ‘Dutch disease’ and institutional resource curses (Hamilton Reference Hamilton1970 [1934]; Drelichman Reference Drelichman2005a, Reference Drelichman2005b). But the Iberian path towards backwardnessFootnote 48 should not distract us from the possibility that those monetary injections led to positive – not only persistent, but permanent – long-run effects for England and the Netherlands.Footnote 49 This has not been emphasized in the recent literature, but it did not go unnoticed by some contemporaries:
[S]ince the discovery of the mines in America, industry has increased in all the nations of Europe, except in the possessors of those mines; and this may justly be ascribed, amongst other reasons, to the increase of gold and silver … [T]he prices of all things have only risen three, or at most, four times, since the discovery of the West Indies … But will anyone assert, that there is not much more than four times the coin in Europe, that was in the fifteenth century, and the centuries preceding it? … And no other satisfactory reason can be given, why all prices have not risen to a much more exorbitant height, except that which is derived from a change of customs and manners. Besides that more commodities are produced by additional industry, the same commodities come more to market, after men depart from their ancient simplicity of manners. (Hume Reference Hume1987 [1742], p. 33)
Appendix
Improvement to the Palma (Reference Palma2018) coin supply data
Royalist recoinage. With the return of the Stuarts to the throne in the person of Charles II, mint output temporally peaked due to the demonetization of the Commonwealth issues. This recoinage was announced in September 1661 and lasted until 1663; which leads to unusually high coin output during 1662–3 (Challis Reference Challis1992, pp. 338–9). I had not corrected for this recoinage in Palma (Reference Palma2018), but I do so here, using the figures Challis calls the lion's share: £500,000 (rounded up from £489,157+£6,496), which I divide equally among 1662–3. This correction leads to normal-looking nominal mint figures for 1662–3, considering that in 1662 there was also the minting of a large quantity of French coin received in payment for Dunkirk: £327,726 (Challis Reference Challis1992, p. 339).
Sources and methodological notes for Tables A1 to A4
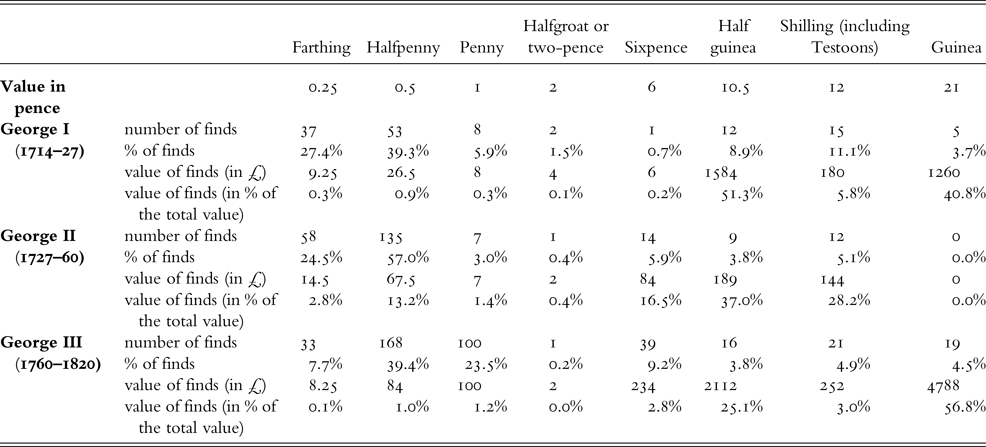
The main denominations are shown out of the denominations for which at least 10 coins have been found for any of the periods. Accordingly, percentages shown in the tables do not sum to 100. Foreign coinage is generally excluded; some Scottish coins may be included, but when a denomination is known to have been exclusively Scottish (e.g. 20 pence under Charles I) it is excluded. Counterfeits are included, though rare. Guineas are assumed to be worth 20 shillings (1 pound) until George I, and 21 shillings (252 pence) from then onwards. I do not show statistics for the reign of Queen Anne because only a few coins have been found for that short reign. The source is the Portable Antiques Scheme website, last accessed September 2018.
Main denominations issued 1509–1603
Main denominations issued 1603–60
Main denominations issued 1660–1702
Main denominations issued 1714–1820
Coin and credit: intellectual and political debates
Conventionally classified under the mercantilist umbrella, contemporary intellectuals, such as Malynes, Miselden and Mun and their disciples, were unanimous that the scarcity of bullion was a problem, hence the emphasis on access to bullion under a favorable trade balance.Footnote 50 In the case of Paterson, Godfrey and Mackworth, paper money was advocated as a solution, but always making clear that the extent of expansion was indirectly constrained by access to bullion.Footnote 51
In fact, the common denominator of the mercantilist literature seems to have been the preoccupation with the capacity of money to encourage economic growth. Adam Smith was mistaken in accusing these mercantilists of confusing money with wealth, because in fact the limitations of credit expansion meant that ‘there was no other way to expand the money stock than to attract silver and gold from abroad’ (Wennerlind Reference Wennerlind2011, p. 40).Footnote 52
Wennerlind (Reference Wennerlind2011) argues that restrictions on endogenous money creation were over once the law allowed the current holder of the debt instrument to sue the initial debtor. This is where my position differs. By itself, this would have been unable to support the subsequent eighteenth-century growth. As the end of the seventeenth century approached, the fall of the average silver content of coin to 50 per cent of the official weight meant a serious monetary crisis, in part because silver coin served as security for the notes of the Bank of England (Wennerlind Reference Wennerlind2011, p.11). This suggests that, later on, the lack of gold would have presented an obstacle.Footnote 53
As contemporaries recognized, the feasibility of taking credit was all about reputation. Even though the lack of currency in the face of expanding commerce provided an incentive for the development of forms of inside money, these could only be sustained as long as merchants were convinced of the buyer's ‘Integrity and Ability for Payment’, and more generally, the ‘honourable Performance of contracts and Covenants' (Defoe Reference Defoe1709).Footnote 54 This was, in fact, representative of the position of the intellectual elite of the time. Even Wennerlind (Reference Wennerlind2011, p. 241) recognizes that David Hume, while open to the notion that under appropriate levels of trust credit could flourish, insisted that currency based on silver and gold was ‘more practical’. Adam Smith advocated a similar position. Inside money could be created, but it led to higher transaction costs. As modern theory suggests, ‘A shortage of liquidity induces the private sector to try and create more stores of value, albeit at a cost’ (Holmström and Tirole Reference Holmström and Tirole2011, p. 5).Footnote 55