





Around two-thirds of US adults reported past-year alcohol use in 2024 and 6 % were heavy drinkers(1), meaning they exceeded the 2020–2025 Dietary Guidelines for Americans’ (DGA) recommendations for moderate drinking(2). The 2020–2025 DGA recommend daily limits of ≤2 standard drinks per day for men and ≤1 standard drink per day for women, with standard drink defined as containing 14 g (0·6 fluid ounces) of pure alcohol(3). Other health authorities recommend lower limits(4). Even moderate alcohol consumption increases one’s risk of certain cancers(5). Excess alcohol consumption contributes to additional health harms and safety risks, ranging from liver disease to motor vehicle accidents, resulting in 178 000 US deaths annually(6). International surveys reveal low public awareness of government drinking guidelines(Reference Jackson, Guo and Holmes7,Reference McNally, Noonan and Cameron8) .
Alcoholic beverages primarily cause harm because of their alcohol content but also contain other potentially harmful nutrients and ingredients. For example, they can contain significant amounts of calories, carbohydrates (including sugars) and fat. On average, among US adults who drink, alcohol accounts for 9 % of daily energy intake(2). Many US adults exceed recommended daily limits for calories, added sugars and saturated fat, contributing to weight gain and related diseases such as type 2 diabetes and heart disease(2). Alcoholic beverages can also contain allergens, posing a risk to the millions of US adults with food allergies(Reference Gupta, Warren and Smith9). And they can contain animal-derived ingredients and other additives that certain people choose to avoid for ethical or religious reasons.
Information about the alcohol, nutrition and ingredient content of these beverages allows consumers to make safer and more informed choices(Reference Jané-Llopis, Kokole and Neufeld10). Some countries encourage or require labelling to allow consumers to more easily monitor their adherence to drinking guidelines. For example, the UK encourages companies to use labels for communicating the UK Chief Medical Officer’s low-risk drinking guidelines(11). Australia and New Zealand require standard drink labelling (e.g. ‘2 standard drinks per can’)(12). Some countries also require ingredients lists, allergen disclosures, calories and nutrition labelling on alcoholic beverages(13,14) . None of this information is required on alcoholic beverage labels in the USA.
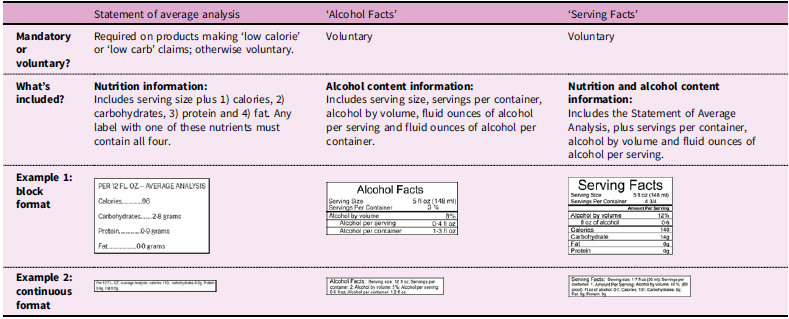
In the USA, while most food and beverage labelling is regulated by the Food and Drug Administration (FDA), most beer, spirits and wine labelling is regulated by the Alcohol and Tobacco Tax and Trade Bureau (TTB) of the Treasury Department. TTB only requires calorie and nutrient labelling (referred to as a Statement of Average Analysis (SAA), see Table 1) on products that make ‘low calorie’ or ‘low carb’ claims(15) and only requires the disclosure of a few select ingredients (e.g. sulfites) as opposed to full ingredients lists(16). TTB allows companies to highlight specific ingredient-related information on labels for marketing purposes (e.g. All natural ingredients, Nothing artificial, Made with real juice) without providing full nutrition or ingredient disclosures. Previous studies from Australia and Canada have found that nutrition- and ingredient-related claims are common on alcohol products, especially beers and ready-to-drink cocktails(Reference Demers-Potvin, Gaucher-Holm and Hobin17,Reference Barons, Mann and Orellana18) . Such claims have been associated with increased perceptions of product healthfulness and could lead to misperceptions that alcoholic beverages are healthful(Reference Haynes, Ilchenko and Dixon19,Reference Yusoff, Jones and Strauli20) .
Examples of calorie and nutrition labels required or permitted by the Alcohol and Tobacco Tax and Trade Bureau

Table 1. Long description
A table comparing different types of labels for alcohol products, including mandatory and voluntary information. The table has three columns: Statement of average analysis, Alcohol Facts, and Serving Facts. Each column describes the mandatory or voluntary nature of the information, what is included, and examples of formats. Row 1: Mandatory or voluntary? Statement of average analysis: Required on products making low calorie or low carb claims; otherwise voluntary. Alcohol Facts: Voluntary. Serving Facts: Voluntary. Row 2: What’s included? Statement of average analysis: Nutrition information including serving size, calories, carbohydrates, protein, and fat. Alcohol Facts: Alcohol content information including serving size, servings per container, alcohol by volume, and fluid ounces of alcohol per serving and per container. Serving Facts: Nutrition and alcohol content information including Statement of Average Analysis, servings per container, alcohol by volume, and fluid ounces of alcohol per serving.
Even alcohol content – arguably the information most relevant to a product’s potential health risks – is not currently required on all US alcoholic beverages. While some states have additional requirements, TTB only requires alcohol content – in the form of a percent alcohol by volume (%ABV) disclosure – on distilled spirits, wines containing more than 14 % ABV and malt beverages containing alcohol derived from added flavours or other added non-beverage ingredients.(21)
Consumers have been calling for more transparent alcohol labelling since the 1970s(22). In 2003, the Center for Science in the Public Interest (CSPI) and sixty-eight other organisations petitioned TTB to require standardised Serving Facts statements on all beer, spirits and wine labels (including %ABV, serving size, servings per container, calories and ingredients)(23). In 2006–2007, TTB issued proposed rulemakings with new serving facts and allergen labelling requirements but never finalised the proposals(24,25) . An interim rule from 2006 now allows voluntary allergen labelling(26), and in 2013, TTB began allowing the voluntary use of ‘Serving Facts’ or ‘Alcohol Facts’ statements (Table 1), pending the completion of the mandatory rulemakings(15). In 2016, several beer companies – Anheuser-Busch, MillerCoors (now Molson Coors), Heineken USA, Constellation Brands Beer Division, North American Breweries (now FIFCO USA) and the Craft Brew Alliance – joined the Beer Institute’s Brewers’ Voluntary Disclosure Initiative (BVDI). They committed to provide calorie, carbohydrate, protein, fat and %ABV information ‘on all labels in the form of a Serving Facts statement consistent with TTB’s guidelines’ and to disclose ingredients on either labels or secondary packaging via an ingredients list, reference to a website with the information or a QR code, all by the end of 2020(27).
To our knowledge, no previous study has assessed the uptake of TTB’s voluntary alcohol labels among beer, spirits and wine brands, or BVDI members’ compliance with their commitments to adopt Serving Facts labels by the end of 2020. There is also limited data on the format in which this information is most commonly displayed, which is important to assess because previous research has found that label formatting affects attention to and usability of alcohol and nutrition information(Reference Pham, Rundle-Thiele and Parkinson28,Reference Ma and Zhuang29) . Therefore, the purpose of this study is to assess the prevalence and formatting of key information related to alcohol content, nutrition and ingredients on the labels of TTB-regulated beers, spirits and wines sold in the USA in 2021. This study also assesses characteristics of alcoholic beverages that are associated with the presence of alcohol, nutrition and ingredient information, such as the presence of nutrition- and ingredient-related claims. Such information could inform policy decisions about whether voluntary labelling is sufficient to ensure consumer access to product information or whether a mandatory approach is necessary.
Methods
We conducted a cross-sectional content analysis to assess the prevalence and formatting of information on labels of TTB-regulated beer, spirits and wine sold in the USA. We pre-registered our protocol with AsPredicted(30).
Content analysis
We ascertained the top 150 brands in each beverage category by purchasing lists of the top brands by 2020 sales volume from EPG Specialty Information(31). The beer list included standard beers as well as hard seltzers, malt liquors and flavoured malt beverages. The wine list included table wine, sparkling/champagne, dessert/fortified and vermouth/aperitif. The spirits list included standard spirits as well as cordials/liqueurs and ready-to-drink cocktails. According to those lists, the top 150 beer brands (e.g. Budweiser, Bud Light and Bud Light Lime) accounted for 90 % of total 2020 sales volume in the beer category; the top 150 spirit brands (e.g. Seagram’s Gin and Seagram’s Vodka) accounted for 82 % of total 2020 spirits sales; and the top 150 wine brands (e.g. Barefoot Cellars and Barefoot Bubbly) accounted for 77 % of total 2020 wine sales.
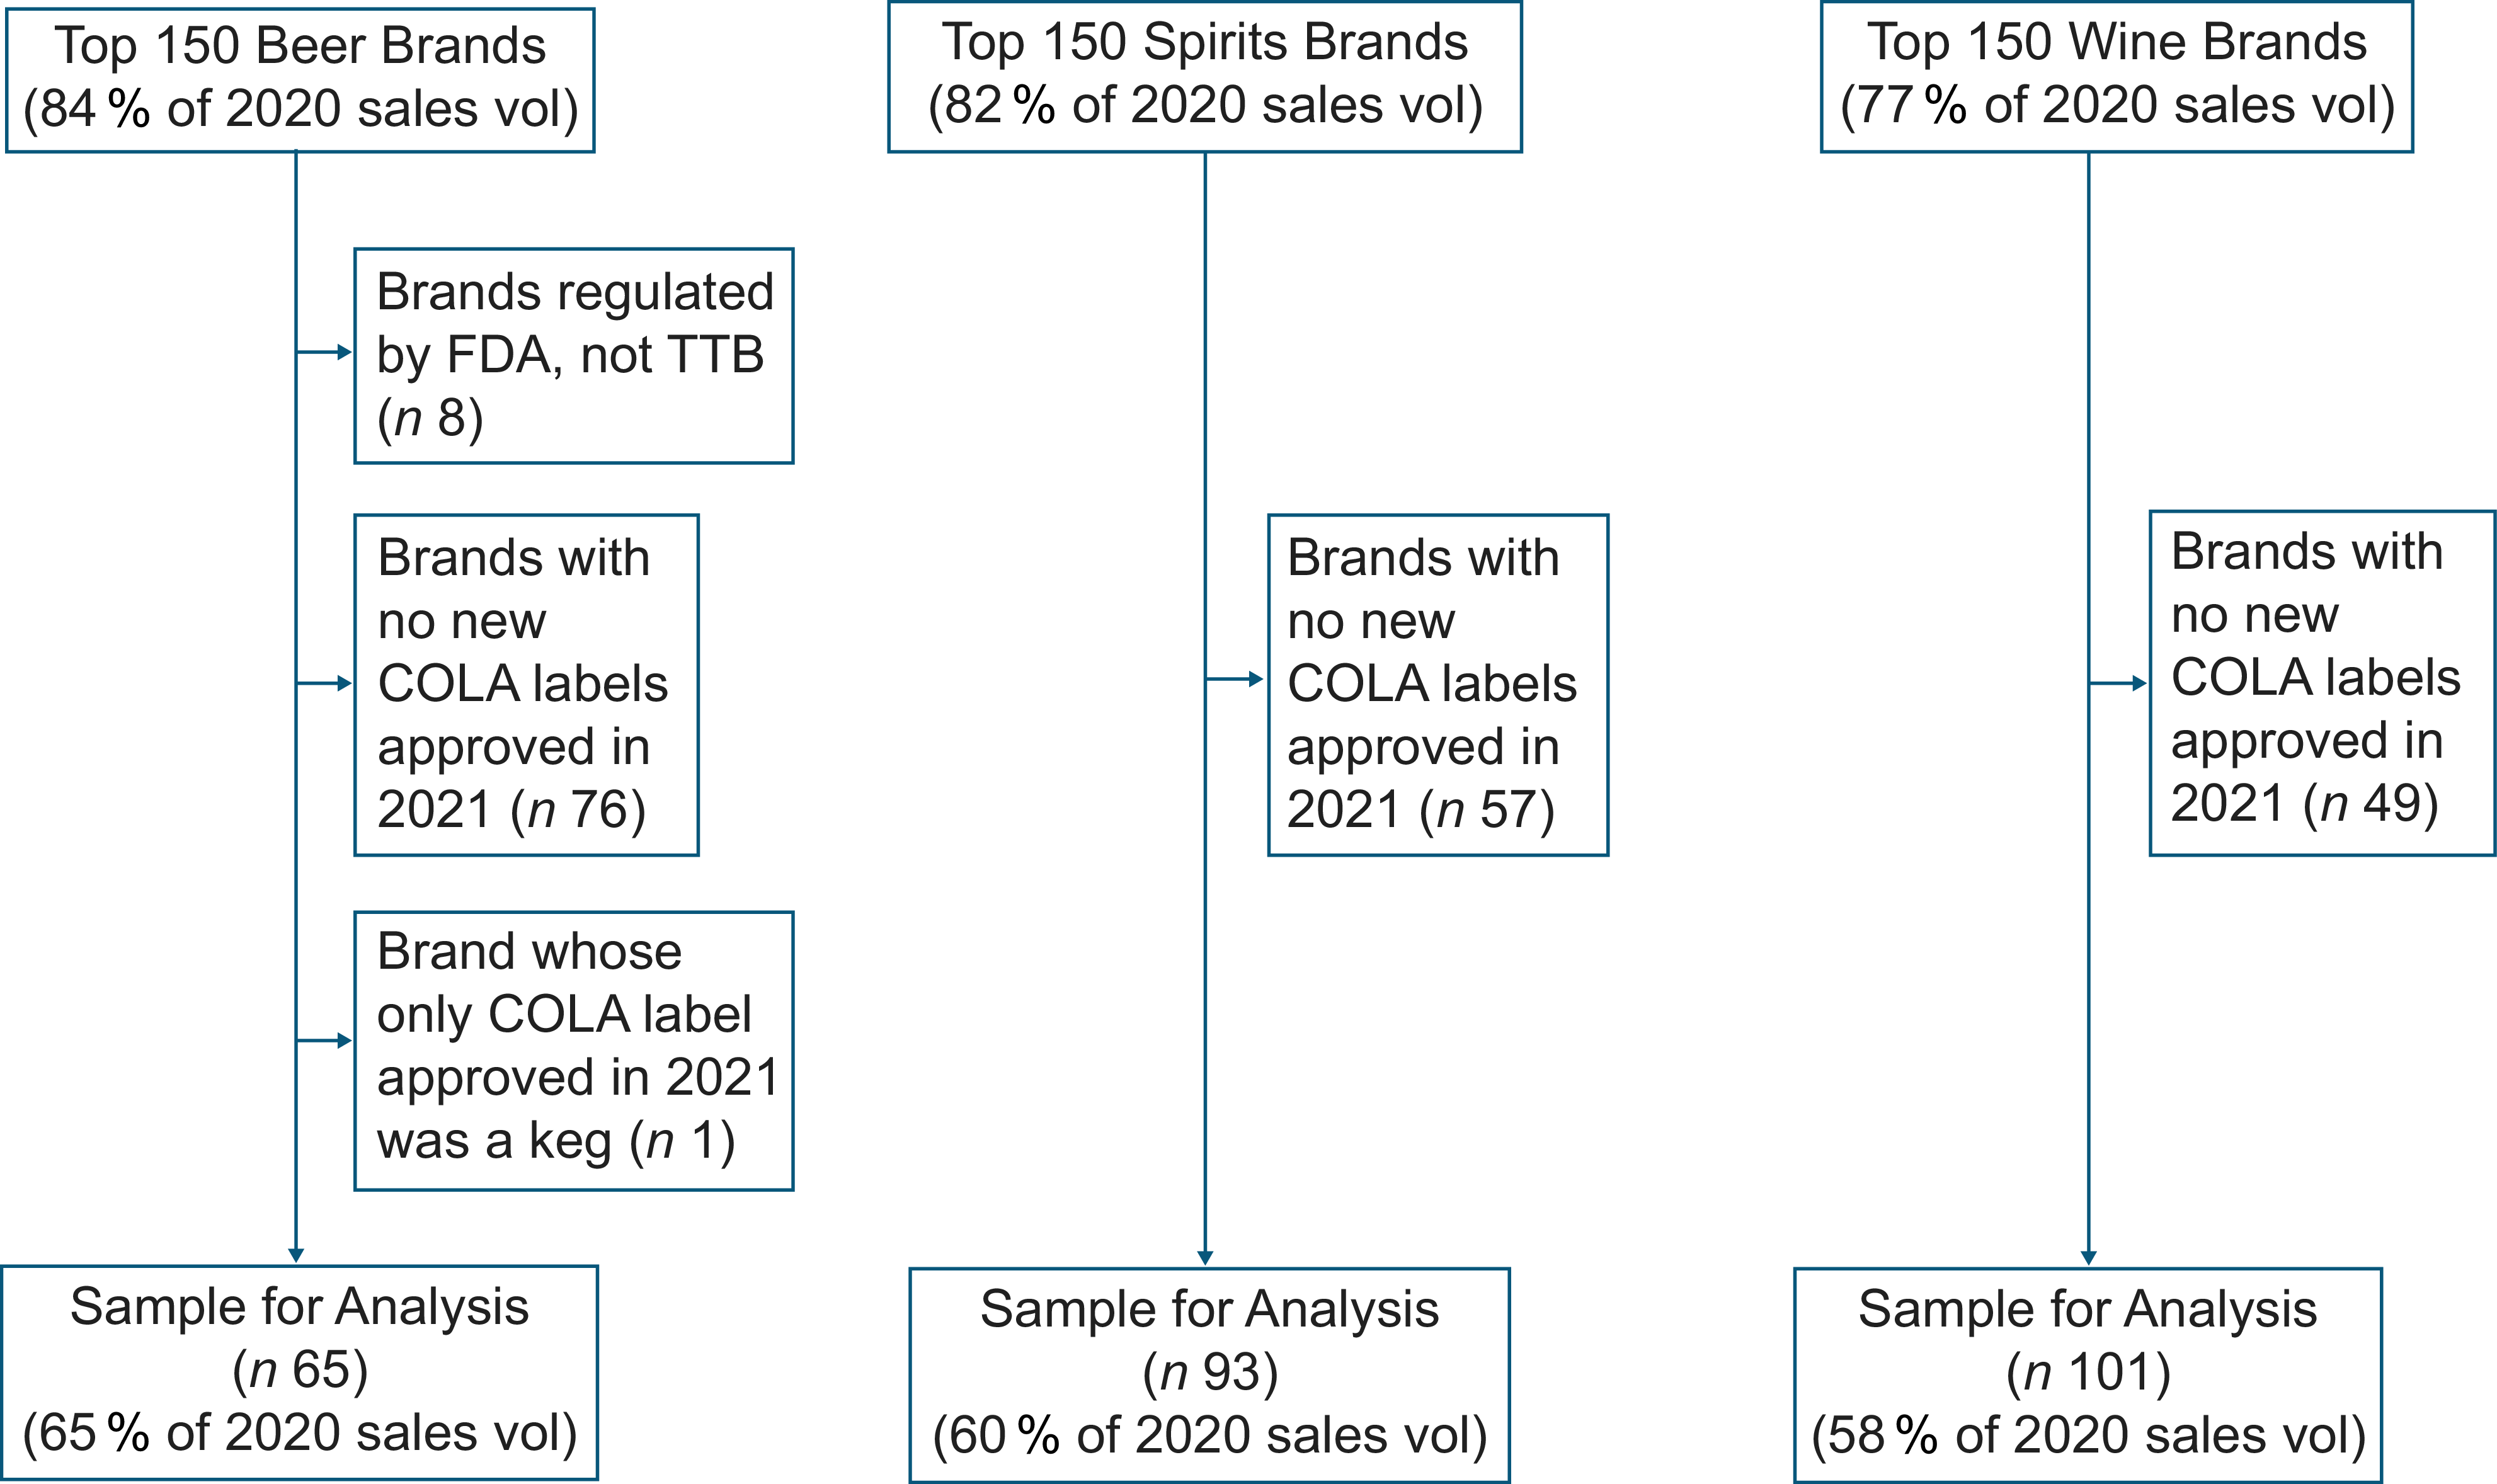
Labels of all TTB-regulated alcoholic beverages must be pre-approved by TTB and are available in a public Certificate of Label Approval (COLA) database(32). Companies are required to submit labels for approval anytime they want to introduce a new product, create a new label or make certain changes to an existing label. We searched the COLA database for labels from each of the top 150 beer, 150 spirits and 150 wine brands approved between 1 January and 31 December 2021 (Figure 1).
Inclusion and exclusion of beer, spirits and wine brands. TTB, Alcohol and Tobacco Tax and Trade Bureau; COLA, Certificate of Label Approval.

The unit of analysis in our study was beer, spirits and wine brands, and we assessed each brand by reviewing at least one label from that brand. We looked at brands with the largest market share to capture the products that US consumers are most likely to encounter. From the initial samples of 150 beer, spirits and wine brands, we excluded brands that were lacking at least one new label that was approved in 2021 (n 76 beer brands, 57 spirits brands and 49 wine brands). We further excluded beer brands that were regulated by FDA instead of TTB because they were made with sugar rather than malt (e.g. White Claw Hard Seltzer) (n 8); and brands whose only COLA labels from 2021 represented products larger than 5 litres (kegs) (n 1). This resulted in a total sample of sixty-five beer brands representing 65 % of 2020 US beer sales; ninety-three spirits brands representing 60 % of 2020 US spirits sales; and 101 wine brands representing 58 % of 2020 US wine sales.
We developed and tested a codebook on dozens of labels, refined it and then trained five research assistants (RA) to review labels, follow the codebook and record information about each label in Microsoft Excel. Brands were divided across the five coders who coded all labels within each assigned brand. Ten per cent of labels coded by each RA were double-coded by another RA and reviewed for percent agreement and inter-rater reliability. Raw agreement was 95 % or higher for all comparisons, and the mean Krippendorff’s α was high at 0·89 (95 % CI 0·82–0·95). Any differences in coding were reconciled through consensus.
In many cases, the COLA database contained multiple labels from the same brand representing the same or similar products (e.g. different container sizes/types; different wine varieties; different vodka flavours). In such cases, labels were coded in reverse chronological order, starting with the most recently approved label. All labels were coded for each brand if the COLA database contained exactly 1 label (73 brands), 2 labels (36 brands) or 3 labels (53 brands) from that brand. For brands with more than three labels (ninety-seven brands), each label was coded starting with the most recently approved until three labels showed the same container size and label dimensions with the goal of ensuring we captured any label containing a voluntary disclosure of interest. In total, we coded 171 beer labels from the COLA database (mean = 2·6 per brand), 369 spirits labels (mean = 4·0 per brand) and 358 wine labels (mean = 3·5 per brand).
RA visually inspected labels for the presence of alcohol, nutrition and ingredient content information, including %ABV, serving size, alcohol per serving, SAA, ‘Serving Facts’ statement, ‘Alcohol Facts’ statement, servings per container and ingredients list (starting with ‘Ingredients:…’). If present, RA recorded the labelled %ABV, serving size, alcohol per serving and number of calories, carbohydrates, fat and protein. The presence of additional claims and statements were also coded, including Mandatory ingredient disclosures, Voluntary ingredient claims, Calorie or Carbohydrate claims, Responsible drinking statements and Specific drinking guidelines. Mandatory ingredient disclosures include the FD&C Yellow No. 5/certified colour, cochineal extract or carmine, caramel colour, sulfites and aspartame, based on TTB regulations(33). Voluntary ingredient claims included any other claims regarding the presence or absence of ingredients, except for ingredients included in a beverage’s ‘Statement of Composition’, which fall into a grey area between mandatory and voluntary because such statements are mandatory, but TTB provides flexibility surrounding the level of detail necessary to ensure the statement is ‘adequate and truthful’(34). Calorie or Carbohydrate claims included terms such as light, lite, low calorie, low-cal, low carb or disclosure of the number of calories or grams of carbohydrates or sugars somewhere other than the SAA or ‘Serving Facts’ statement.
If labels included an SAA, ‘Alcohol Facts’ or ‘Serving Facts’, RA also assessed formatting characteristics including: Format (block/continuous, see examples in Table 1), Border (yes/no), Orientation (horizontal /vertical), Font (upper and lowercase/all uppercase), Crowding (not crowded/crowded with other text) and Color Contrast (measured using the TPGi Color Contrast Analyzer; a contrast ratio of 4·5 or higher was considered High, less than 4·5 was considered Low). We selected these characteristics based on label attributes associated with improved readability in previous studies(Reference Yazar, Seimyr and Novak35,36) and design attributes of the Nutrition Facts panel required by FDA.
Data analysis
We used descriptive statistics to characterise the prevalence of each type of label attribute, the alcohol and nutritional content of beverages, and the formatting of alcohol and nutrition information for brands within alcoholic beverage categories (beer, spirits and wine). We considered a label attribute to be present for a brand if it appeared on the label of at least one product coded for that brand (even if it did not appear on all labels from that brand). We also reported inconsistencies within brands (i.e. whether our primary attributes of interest were present sometimes, v. consistently present or absent, across a brand’s coded labels).
We used Fisher’s exact tests to examine whether type of beverage (beer, spirits or wine) was associated with the presence of three label attributes (SAA, ‘Serving Facts’ and ingredients list) and to assess the association between the presence of these attributes and specific characteristics within the beer and spirits categories (not wine because few brands displayed any of the three attributes). These characteristics included presence or absence of a calorie or carbohydrate claim, % ABV above or below the category median and smaller or larger market share in 2020 (≥1 % v. <1 %). Within the beer category, we also examined whether the three attributes were associated with the brand being domestic or imported and a member or non-member of the BVDI. Within the spirits category, we examined whether the three attributes were associated with spirit type (whiskey, gin, vodka, tequila, rum or other).
For brands where we coded multiple labels with a range of %ABV, we used the lowest %ABV coded, except in two cases where only a higher %ABV product had an SAA in which case we used the %ABV for those products. For brands that did not label %ABV, we searched for their %ABV on company websites. All statistical tests were conducted with StataMP 17.0 software.
Results
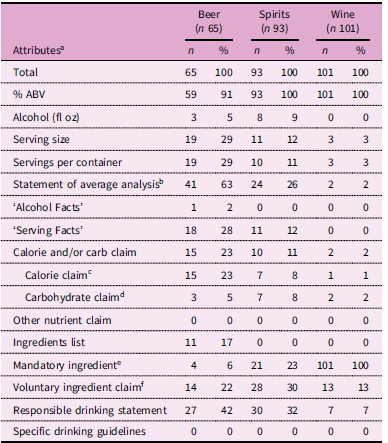
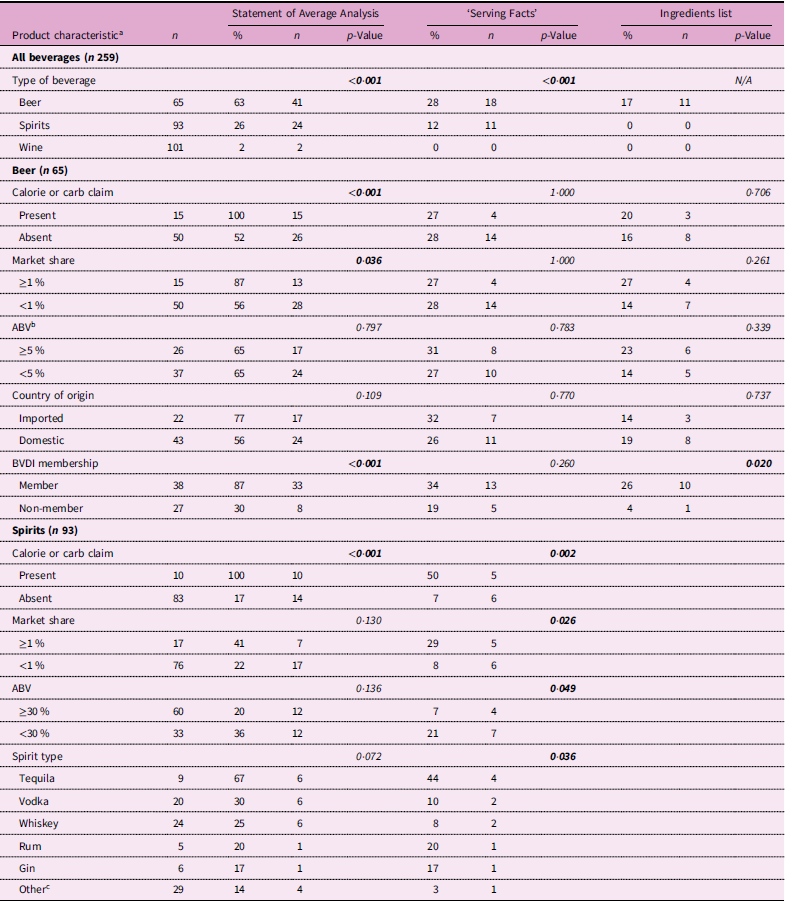
Overall, 63 % of beer brands (n 41), 26 % of spirits brands (n 24) and 2 % of wine brands (n 2) had an SAA on at least one product; 28 % of beer brands (n 18), 12 % of spirits brands (n 11) and 0 wine brands had ‘Serving Facts’ on at least one product; and 17 % of beer brands (n 11) and 0 spirits or wine brands had ingredients lists on at least one product (Table 2). Beer brands contained SAA and ‘Serving Facts’ on their labels more often than spirits and wine brands (p < 0·001) (Table 3).
Prevalence of information attributes on product labels from beer, spirits and wine brands in 2021

Table 2. Long description
A table comparing the prevalence of information attributes on product labels from beer, spirits, and wine brands in 2021. The table has 20 rows and 7 columns. Column headers are Attributes, Beer (n 65), %, Spirits (n 93), %, Wine (n 101), %. Row 1: Total, 65, 100, 93, 100, 101, 100. Row 2: % ABV, 59, 91, 93, 100, 101, 100. Row 3: Alcohol (fl oz), 3, 5, 8, 9, 0, 0. Row 4: Serving size, 19, 29, 11, 12, 3, 3. Row 5: Servings per container, 19, 29, 10, 11, 3, 3. Row 6: Statement of average analysis, 41, 63, 24, 26, 2, 2. Row 7: Alcohol Facts, 1, 2, 0, 0, 0, 0. Row 8: Serving Facts, 18, 28, 11, 12, 0, 0. Row 9: Calorie and/or carb claim, 15, 23, 10, 11, 2, 2. Row 10: Calorie claim, 15, 23, 7, 8, 1, 1. Row 11: Carbohydrate claim, 3, 5, 7, 8, 2, 2. Row 12: Other nutrient claim, 0, 0, 0, 0, 0, 0. Row 13: Ingredients list, 11, 17, 0, 0, 0, 0. Row 14: Mandatory ingredient, 4, 6, 21, 23, 101, 100. Row 15: Voluntary ingredient claim, 14, 22, 28, 30, 13, 13. Row 16: Responsible drinking statement, 27, 42, 30, 32, 7, 7. Row 17: Specific drinking guidelines, 0, 0, 0, 0, 0, 0.
ABV, alcohol by volume.
a Attributes were considered present for a brand if they appeared on the label of at least one product from that brand (even if it did not appear on all labels from that brand).
b Calories, carbohydrates, fat and protein; none of these are permitted to be declared on the label without the others.
c Light, lite, low calorie or a standalone statement of calorie content.
d Low carbohydrate, low carb, no sugar, no added sugar or a standalone statement of carbohydrate content.
e FD&C Yellow No. 5, certified colour, caramel colour, cochineal extract or carmine and sulfites.
f Absence of an ingredient (high-fructose corn syrup, gluten, dairy products, coffee, sugar, added sugar, artificial sweeteners); presence of an ingredient (wheat, shellfish, natural flavours, real juice, milk casein, gold flakes); derived from an ingredient (grain, agave); vegan; percent juice.
Relationship between brand characteristics and Statement of Average Analysis, ‘Serving Facts’, and ingredients disclosures on product labels from beer, wine and spirits brands in 2021

Table 3. Long description
The table presents data on the presence of Statement of Average Analysis (SAA), Serving Facts, and ingredients lists on product labels for beer, wine, and spirits brands. It includes columns for product characteristics, Statement of Average Analysis, Serving Facts, and ingredients list, with rows detailing the type of beverage, calorie or carb claim, market share, alcohol by volume (ABV), country of origin, and BVDI membership. For beer brands, 63% have an SAA, 28% have Serving Facts, and 17% have ingredients lists. For spirits brands, 26% have an SAA, 12% have Serving Facts, and 0% have ingredients lists. Wine brands have 2% with an SAA and 0% with Serving Facts or ingredients lists. The table also includes p-values to indicate statistical significance. Notable trends include the higher prevalence of SAA and Serving Facts on beer labels compared to spirits and wine labels.
ABV, alcohol by volume; BVDI, Brewers’ Voluntary Disclosure Initiative.
p-Values reflect results of Fisher’s exact tests.
a Statement of Average Analysis, ‘Serving Facts’ and ingredients disclosures were considered present for a brand if they appeared on the label of at least one product from that brand (even if it did not appear on all labels from that brand).
b ABV missing two values in the beer category.
c Brandy and cognac, cordials and liqueurs, and ready-to-drink.
Our primary attributes of interest (SAA, ‘Serving Facts’ and ingredients lists) were consistently present or absent across a brand’s labels in most cases, but the presence of an SAA was inconsistent for twelve brands (10 spirits, 2 wines), ‘Serving Facts’ was inconsistent for four brands (all spirits) and ingredients lists were inconsistent for three brands (all beers).
Beer
Ninety-one per cent of beer brands labelled %ABV (n 59), which ranged from 3·2 % to 14 % (Table 2). The %ABV was missing from six brands: Pabst Blue Ribbon, Guinness Stout, Old Milwaukee, Sapporo, Old Milwaukee Light and Rainier. Only 5 % of beer brands (n 3) – Four Loko, Smirnoff Spiked Sparkling Seltzer and Smirnoff Ice – labelled alcohol content, which ranged from 0·5 to 0·7 fluid ounces of ethanol per serving.
Twenty-nine per cent of beer brands (n 19) voluntarily labelled serving size and servings per container: 2 % (n 1) contained voluntary ‘Alcohol Facts’ and 28 % (n 18) contained voluntary ‘Serving Facts’. No brand had a serving size or servings per container disclosure without ‘Alcohol Facts’ or ‘Serving Facts’. Serving sizes ranged from 5 fluid ounces of 8·1 % ABV beer to 25·4 fluid ounces of 5·2 % ABV beer. The latter was not compliant with TTB regulations, which specify that a serving of beer with up to 7 % ABV should be 12 fluid ounces.(15) Forty-two per cent of beer brands (n 27) had responsible drinking statements such as ‘Enjoy responsibly’, ‘Celebrate responsibly’ or ‘Drink responsibly’, but no brand had specific drinking guidelines on its label.
In total, 63 % (n 41) of beer brands contained nutritional information: 28 % (n 18) with voluntary ‘Serving Facts’ (which includes an SAA) and 35 % (n 23) with only an SAA. Among the thirty-five brands that labelled nutrition information per 12 fluid ounces, calorie content ranged from 90 to 330 (mean 138), carbs ranged from 2·6 to 43·7 grams (mean 10·3), fat was always 0 grams and protein ranged from 0 to 2·4 grams (mean 1·0).
Of the forty-one beer brands with nutrition information, 23 % also had a calorie claim (n 15) or carb claim (n 3, all of which also had calorie claims). Products with these claims are required to display an SAA on the label, and our analysis found that all fifteen brands complied with this requirement, so only 40 % of beer brands in our sample (n 26) displayed nutritional information voluntarily. We did not identify any other nutrient claims on the beer labels.
Seventeen per cent of beer brands (n 11) had ingredients lists, with ingredients including water, barley malt/malted barley, corn syrup/dextrose/maltose, sugar, yeast, hops/hop extract and cereal grains/non-malted cereals. Six per cent of beer brands (n 4) had mandatory ingredient disclosures for select ingredients required on labels by TTB (all FD&C Yellow #5). Twenty-two per cent of beer brands (n 14) had voluntary ingredient claims. The most common ingredient claim was about corn syrup, appearing on six brands, all of which were owned by Molson Coors Beverage Company and had ingredients lists that included corn syrup. The voluntary claim stated: ‘Corn Syrup is used as part of the brewing process only. [brand] never uses high fructose corn syrup’. The other eight included three with the statement ‘Crafted to remove gluten. Product fermented from grains that contain gluten and crafted to remove gluten. The gluten content cannot be verified, and this product may contain gluten’; two with allergen disclosures (‘Contains: wheat’ and ‘Contains: shellfish’); and two declaring the absence of specific ingredients (‘Does not contain dairy or coffee’ and ‘No added sugar’/‘Gluten free’/‘No high fructose corn syrup’/‘No artificial flavours’).
Having a calorie or carb claim, larger market share (≥1 %) and being a member of BVDI were positively associated with beer brands having an SAA (Table 3). Being a member of BVDI was the only factor significantly associated (positively) with brands displaying ingredients lists. Among the thirty-eight brands in our sample that were part of the BVDI, only 34 % (n 13) had ‘Serving Facts’ statements and 26 % (n 10) had ingredients lists. Thirteen per cent of these brands (n 5) did not have an SAA (Seagram’s Escapes by FIFCO USA, Pacifico by Constellation Brands, Goose Island and Presidente by Anheuser-Busch InBev and Henry Weinhard by Molson Coors).
Spirits
All ninety-three spirit brands (100 %) labelled %ABV, ranging from 4·5 % to 62·1 % (Table 2). Eight brands labelled alcohol per serving, ranging from 0·1 to 0·8 fluid ounces. Twelve per cent of spirits brands (n 11) voluntarily labelled serving size, all using voluntary ‘Serving Facts’ statements (Smirnoff, Crown Royal, Captain Morgan, Jose Cuervo, Ketel One, Bailey’s, 1800, Tanqueray, Don Julio, Johnnie Walker Black and Casamigos) (Table 2). Only one brand (1800) disclosed servings per container as part of its Servings Facts label. Thirty-two per cent of spirits brands (n 30) had responsible drinking statements, and none had specific drinking guidelines.
Twenty-six per cent of spirits brands (n 24) contained nutrition information: 12 % (n 11) with ‘Serving Facts’ statements (which includes an SAA) and 14 % (n 13) with only an SAA. Ten of these twenty-four brands with nutrition information had a calorie claim (n 3), a carb claim (n 3) or both (n 4). Products with these claims are required to display an SAA, and our analysis found that all ten brands complied with this requirement, so only 15 % of spirits brands (n 14) displayed nutrition information voluntarily.
No spirits brands had ingredient lists, 23 % had mandatory ingredient disclosures (n 21, all FD&C Yellow #5/certified colour or caramel colour) and 30 % (n 28) had voluntary ingredient claims: seventeen declaring they contain or derive from specific ingredients like natural flavours, real juice, grain or agave; thirteen ‘Gluten free’; eight declaring the absence of specific ingredients like artificial sweeteners, sugar or high-fructose corn syrup; and three declaring percent juice or juice concentrate (some brands had multiple types of voluntary ingredient claims).
Having a calorie or carb claim and larger market share (≥1 %) were positively associated with spirits brands having an SAA and/or ‘Serving Facts’, while higher ABV (≥30 %) was negatively associated with ‘Serving Facts’ (Table 3). The presence of ‘Serving Facts’ also varied significantly by spirit type (most common for tequila brands).
Wine
One hundred per cent of wine brands (n 101) labelled %ABV, which ranged from 5 % to 18 %. None labelled alcohol per serving. Three per cent of brands (n 3) labelled serving size and servings per container. Serving sizes included 5·6 ounces of a 12·5 %–14·1 % ABV wine (0·7–0·8 fl. oz. ethanol), 6 ounces of 13 %–13·5 % ABV wine (0·8 fl. oz. ethanol) and 5 ounces of 7 % ABV wine (0·4 fl. oz. ethanol). No wines had ‘Serving Facts’ or ‘Alcohol Facts’ statements. Seven per cent of brands (n 7) had responsible drinking statements, and none had specific drinking guidelines.
Only 2 % of wine brands (n 2) disclosed nutrition information, exclusively using Statements of Average Analysis labels: Colombia Crest (140 calories, 4·5 g carbs, 0 g fat, 0 g protein) and Starborough (90 calories, 4·7 g carbs, 0 g fat, 0 g protein). Starborough also had a calorie and a carb claim (90 calories; <1 g sugar per 5 oz serving). One other brand (Veuve de Vernay) had a carb claim (Sugar at harvest: 170 g per litre; Residual sugar: 45 g per litre) but no SAA. There were no other nutrient claims. No wines had ingredient lists, and all (100 %) had a mandatory ingredient disclosure (Contains sulfites). Thirteen per cent of wines (n 13) had voluntary ingredient claims, including one with an allergen disclosure (Contains milk casein), seven Gluten Free, one Dairy Free, five Vegan and one ‘Natural flavour and artificial colour: gold flakes’ (some had multiple).
Formatting
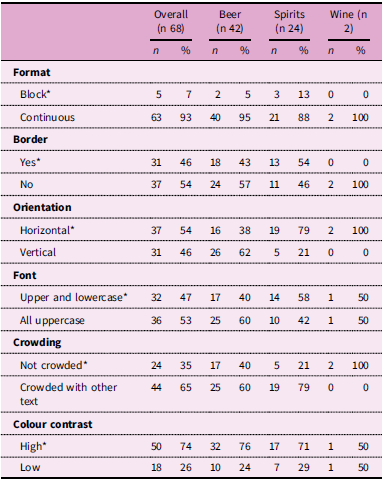
Among the sixty-eight beer, spirits and wine brands with labels that included an SAA, ‘Alcohol Facts’ or ‘Serving Facts’, most did not present this information with formatting preferable for reading comprehension (Table 4). Almost all brands used the continuous format (93 %) instead of the block format; 65 % crowded the disclosure against other text; 54 % had no border around the disclosure; 53 % had the disclosure in all uppercase letters; 46 % had vertical orientation; and 26 % had low colour contrast.
Format of serving information on product labels from beer, wine and spirits brands in 2021

Table 4. Long description
The table presents data on the format of serving information on product labels from beer, wine, and spirits brands in 2021. It includes six columns: Overall (n 68), Beer (n 42), Spirits (n 24), and Wine (n 2). The table is divided into five categories: Format, Border, Orientation, Font, and Colour contrast. Each category has subcategories with corresponding values in percentages and counts. Row 1: Format, Block, Overall, 5, 7 percent, Beer, 2, 5 percent, Spirits, 3, 13 percent, Wine, 0, 0 percent. Row 2: Format, Continuous, Overall, 63, 93 percent, Beer, 40, 95 percent, Spirits, 21, 88 percent, Wine, 2, 100 percent. Row 3: Border, Yes, Overall, 31, 46 percent, Beer, 18, 43 percent, Spirits, 13, 54 percent, Wine, 0, 0 percent. Row 4: Border, No, Overall, 37, 54 percent, Beer, 24, 57 percent, Spirits, 11, 46 percent, Wine, 2, 100 percent. Row 5: Orientation, Horizontal, Overall, 37, 54 percent, Beer, 16, 38 percent, Spirits, 19, 79 percent, Wine, 2, 100 percent. Row 6: Orientation, Vertical, Overall, 31, 46 percent, Beer, 26, 62 percent, Spirits, 5, 21 percent, Wine, 0, 0 percent. Row 7: Font, Upper and lowercase, Overall, 32, 47 percent, Beer, 17, 40 percent, Spirits, 14, 58 percent, Wine, 1, 50 percent. Row 8: Font, All uppercase, Overall, 36, 53 percent, Beer, 25, 60 percent, Spirits, 10, 42 percent, Wine, 1, 50 percent. Row 9: Crowding, Not crowded, Overall, 24, 35 percent, Beer, 17, 40 percent, Spirits, 5, 21 percent, Wine, 2, 100 percent. Row 10: Crowding, Crowded with other text, Overall, 44, 65 percent, Beer, 25, 60 percent, Spirits, 19, 79 percent, Wine, 0, 0 percent. Row 11: Colour contrast, High, Overall, 50, 74 percent, Beer, 32, 76 percent, Spirits, 17, 71 percent, Wine, 1, 50 percent. Row 12: Colour contrast, Low, Overall, 18, 26 percent, Beer, 10, 24 percent, Spirits, 7, 29 percent, Wine, 1, 50 percent.
* Characteristic is preferable for reading comprehension.
Discussion
This study identified a general lack of alcohol, nutrition and ingredient content information on the labels of the top beer, spirits and wine brands in the USA, although this information was relatively more common on beers compared to spirits and wines. Specifically, this study revealed low uptake of TTB’s voluntary ‘Serving Facts’ statement – which includes alcohol content and nutrition information – with less than a third of beer brands, about one in ten spirits brands, and no wine brands using the label. The SAA label – which provides nutrition information – was more common, but still missing from the vast majority of wines and spirits and more than half of the beers for which TTB regulations do not require it due to the presence of a calorie or carbohydrate claim. More than half of the beer brands in this study (58 %) were members of the BVDI, meaning that they committed to providing alcohol, nutrition and ingredient information on their labels(27). These BVDI members were more likely than non-members to display nutrition information, but less than half followed through on their full commitments to apply ‘Serving Facts’ statements.
These findings align with other evaluations revealing low uptake of voluntary food and beverage labelling policies. For example, a 2014 study found that voluntary calorie information was present on only 6 % of beer labels, 3 % of spirits label and 1 % of wine labels in the European Union(36). Since then, trade groups representing the beer and spirits industries signed memorandums of understanding with the EU government committing to label calories, nutrition information and ingredients, and the EU began mandating this information on wine labels in 2023(Reference Arthur37). Similarly, 10 years after Australia’s government endorsed the voluntary Health Star Rating system to signal the nutritional quality on food labels, it appeared on only 37 % of products(Reference Keaney, Maganja and Barrett38). In contrast, there is high compliance with mandatory food and beverage labelling policies. For example, FDA began requiring calorie labels on US chain restaurant menus in 2018, and 94 % of restaurants were compliant by the deadline(Reference Cleveland, Simon and Block39).
One exception to the relatively higher prevalence of information on beers was %ABV, which was present on all spirits and wine brands but missing from 9 % of beer brands. It is particularly concerning that certain beer products currently have no alcohol content information on their labels since alcohol content is perhaps the most essential piece of information for assessing a beverage product’s potential health risk. Only eleven brands in our sample labelled alcohol content in fluid ounces per serving, but the wide range (0·1 to 0·8 fluid ounces) and lack of consistent alignment between the amount of alcohol in a labelled serving v. a standard drink (0·6 fluid ounces) suggests a need to better communicate to consumers about the number of standard drinks in a beverage. Australia already requires standard drink disclosures on alcohol labels(12). Research suggests that standard drink labelling can help consumers accurately track their alcohol intake and better interpret drinking guidelines and is most beneficial when combined with other educational efforts(Reference Martin-Moreno, Harris and Breda40).
Our study also revealed that nutrition claims (specifically, calorie and carbohydrate claims) were present on 23 % of beer brands, 11 % of spirits brands and 2 % of wine brands; and ingredient claims, which often highlighted the absence of a specific type of ingredient (e.g. Gluten free, Dairy free, Vegan, No artificial flavours), were present on 22 % of beer brands, 30 % of spirits brands and 13 % of wine brands. The prevalence of nutrition and ingredient claims is concerning because such claims have been associated with increased healthfulness perceptions of alcohol products(Reference Barons, Mann and Orellana18,Reference Haynes, Ilchenko and Dixon19) . Mandatory nutrition and ingredient information could help offset potentially misleading effects of nutrition and ingredient claims if properly formatted. For example, an experimental study found that nutrition information unintentionally increased participants’ healthfulness perceptions of a wine product when formatted with the heading ‘Nutrition Facts’ but had no effect on healthfulness perceptions compared to the no-label control when similar information was presented under the heading ‘Alcohol Facts’(Reference Vanderlee, White and Hammond41). Future research should examine healthfulness perceptions of alcoholic beverages when nutrition information is presented under the current TTB label’s heading of ‘Serving Facts’ (compared to ‘Nutrition Facts’ and ‘Alcohol Facts’).
Our study also revealed that ingredient claims were more common than complete ingredients lists, which were only present on 15 % of beer brands and never on spirits or wine brands. The lack of ingredient transparency is concerning given that severe allergic reactions to ingredients in alcoholic beverages have occurred(Reference Pita, Sousa and Bartolome42,Reference Brussino, Nicola and Giorgis43) . Furthermore, some chemicals used in food and alcohol are associated with safety concerns, and many consumers seek to avoid specific ingredients for a variety of health and safety, religious or ethical reasons. For example, a 2023 survey found that 21 % of US consumers try to avoid artificial sweeteners(44). However, consumers are not currently able to assess whether added sweeteners are present in alcoholic beverages.
Even when alcohol and nutrition information was present on alcohol labels via ‘Serving Facts’ and/or SAA labels, it was generally not optimally formatted for readability. For example, approximately 50 % of the time this information was presented, it was crowded against other text (e.g. the distributor’s name and address) without a border around it, presented vertically instead of horizontally, and in all capital letters instead of in sentence case – all features that make labels more difficult to read. Furthermore, the vast majority of labels (95 %) were presented as continuous instead of block text, which also impedes readability. Mandatory formatting requirements are likely needed to ensure manufacturers incorporate best practices into label design. Such best practices have already been highlighted by other authoritative bodies. For example, the WHO recommends that when alcohol labels include health information, ‘Text should be clearly separated from other information on the label (e.g. placed in boxes with thick borders)’(45). Formatting requirements could also help improve noticeability and readability of nutrition information relative to nutrition claims.
This novel study was the first to assess uptake of voluntary US alcohol labelling policies and did so using labels from a national government database. Our findings regarding low uptake and poor formatting of voluntary disclosures point to the need for a mandatory policy requiring Serving Facts and ingredients labelling for alcoholic beverages. While alcoholic beverages primarily cause harm because of their alcohol content, mandatory information about their nutrition and ingredient content could help consumers make more informed choices. This is relevant for current policymaking because CSPI and other organisations filed a lawsuit against TTB in 2022 for failing to act on the 2003 petition calling for mandatory alcohol labelling(23,46) , and TTB issued proposed regulations to require serving facts and allergens on beer, spirits and wine labels in January 2025(47). The government has indicated plans to finalise these regulations and issue a proposed regulation on ingredient labelling for alcoholic beverages in 2026(48).
Our study has some limitations. We only reviewed labels newly approved in TTB’s COLA database in 2021, which captured 57 % of the brands in our initial sample of the top 150 beer, wine and spirits brands. Therefore, our findings may not be generalisable to all top brands, or to producers with smaller market shares. Due to the limited coverage of our sample, we decided not to present findings weighted by each brand’s 2020 sales volume. Our sample may be biased towards newer products or those with recently redesigned or seasonal/special edition labels. At the same time, it does not capture products introduced after 2021. We may have overestimated or underestimated the proportion of top brands with at least one label that included an SAA or Serving Facts statement in 2021 because TTB states that ‘labels covered by existing approved COLAs that are revised solely to include a statement of average analysis or Serving Facts statement…are considered approved by TTB, and it is not necessary to submit a new COLA application’(15). If many of the brands that were excluded from our analysis because they did not have any new COLA in 2021 had actually updated their previously approved labels to add Serving Facts statements without obtaining new COLA, causing the excluded labels to be more likely to include Serving Facts statements than brands with new labels approved in 2021, our results would be underestimates; however, if brands that obtained COLA for new, redesigned labels in 2021 were more likely to include Serving Facts statements than brands with no new labels approved in 2021, our results would be overestimates. We also did not capture variation in label attributes by container type (e.g. beer can v. bottle or wine bottle v. ‘juice box’) or location (e.g. front v. back of the beverage container), because the COLA database did not provide this information. Furthermore, we assessed multiple labels per brand and characterised a label characteristic as present for the entire brand if it appeared on at least one of the labels, which may have resulted in an overestimation of the prevalence of alcohol, nutrition and ingredient information across alcohol brands. However, in 2022, the Distilled Spirits Council of the USA announced a new commitment to provide ‘Serving Facts’ information for all spirits products available in the USA by June 2024, so voluntary labelling among spirits brands may have increased since we collected our data(49). The prevalence of nutrition- and ingredient-related claims may have also increased since 2021, given that alcohol brands are struggling to win back market share lost to a growing segment of health-conscious consumers who are abstaining from drinking alcohol or prefer low-alcohol beverages(50). Our descriptive ranges of %ABV across brands may also be underestimated, because we reported the lowest %ABV for brands where we coded multiple labels with a range of %ABV. Future research should continue to monitor the alcohol labelling landscape using more recent labels across the top US beer, spirits and wine brands and continue to assess whether beer brands are adequately following through on their commitments as members of the BVDI.
Conclusions
The majority of alcoholic beverage brands failed to disclose alcohol, nutrition and ingredient content information in 2021. To ensure transparency in alcoholic beverage labelling, TTB should consider adopting mandatory labelling policies, instead of voluntary labelling policies, and those policies should include formatting requirements to promote readability of nutrition-related information on alcohol labels.
Supplementary material
For supplementary material/s referred to in this article, please visit https://doi.org/10.1017/S136898002610336X
Acknowledgements
The authors thank Christina LiPuma and CSPI interns Victoria McClare and Katharine Peglow for their assistance with data collection.
Authorship
Conceptualisation: EG and SS.; Methodology: EG; Analysis: EG and AAM; Writing – Original Draft Preparation: EG; Writing – Review and Editing: EG, SS and AAM; Supervision: AAM.
Financial support
This research received no specific grant from any funding agency, commercial or not-for-profit sectors.
Competing interests
None.


 Open access


