

Satisfaction with the police is central to democratic societies because the police represent the state’s moral authority and legitimacy (Tyler Reference Tyler1990). For decades in Latin America, scholars have become accustomed to low levels of citizen trust in institutions (Arias and Goldstein 2010; Dammert Reference Dammert, Sieder and Alfonso2019) and a negative perception of police work (Cruz Reference Cruz2015; Sozzo Reference Sozzo, Bradford, Jauregui, Loader and Steinberg2016; Bergman Reference Bergman2018; Corbacho et al. Reference Corbacho, Phillip and Ruiz-Vega2015; Cao and Zhao 2005).
This study examines the effects of an integrated model of satisfaction with the police in Chile. In particular, it integrates three models commonly used in the scholarly literature on satisfaction with police organizations: demographic, quality of life, and direct experience with police (experiential).
Available research underscores the structural weaknesses and institutional corruption of police organizations in the region and the presence of strong links between police and political organizations (Moncada Reference Moncada2016; Durán-Martínez Reference Durán-Martínez2018; Malone and Dammert Reference Malone and Dammert2021; González 2019; Reference González2017). Ethnographic studies also highlight the complexities of everyday police work and police-community relations, especially in urban settings (Auyero and Burbano de Lara 2012; Willis Reference Willis2014). Additionally, a growing literature on violence and conflict indirectly analyzes the police role in processes that range from the consolidation of youth gangs (Cruz and Rosen Reference Cruz and Rosen2020) to prison gangs (Lessing and Willis 2019) and criminal organizations (Moncada Reference Moncada2016; Brown et al. Reference Brown, Benedict and Wilkinson2006).
Among police institutions in Latin America, Chile stands out as an interesting case study for security and police scholars (Dammert Reference Dammert, Sieder and Alfonso2019; Arias and Goldstein 2010; Bonner Reference Bonner2013). The two major police organizations in Chile, Carabineros de Chile and Policía de Investigaciones (Investigative Police), did not have a history of corruption or excessive violence toward citizens. Their professionalism centered on their role in preventing and controlling crime and introducing new technologies and training approaches to increase their effectiveness while respecting civilian and human rights. This level of professionalism led to high levels of citizen approval and trust, as reflected in opinion surveys (Dammert, Reference Dammert2017; González, 2019; Frühling, Reference Frühling2012).
Specifically regarding the Carabineros, citizen approval led to high levels of police autonomy, which allowed them to “rule by themselves” for the first three decades of democracy (Dammert Reference Dammert, Araujo and Colección2020). Nevertheless, since 2015, institutional deterioration, demonstrated by acts of systemic corruption and excessive use of force, became increasingly evident. During the 2019 social upheaval, this situation exploded when Carabineros, the police institution in charge of control and crime prevention, was responsible for human rights abuses in its public order management practices (Human Rights Watch 2019).
After decades of being the poster child for policing in Latin America, Chile’s police-civilian relationship was redefined by the social upheaval. These events helped guide our research, using a representative face-to-face survey conducted in the Metropolitan Region of Santiago between January and March 2020 (n = 996). Although the survey was initially designed to study police legitimacy issues, the social upheaval of October to December 2019 presented a unique context that redefined citizens’ perceptions of their encounters with the police.Footnote 1 To our knowledge, this is the first survey designed to study police legitimacy in Chile and the first quantitative attempt to analyze determinants of satisfaction with the police in Latin America.
This study seeks to answer important questions about the determinants that affect citizen satisfaction with police work in Chile in the context of that social turmoil. The findings include a unique perspective of a post–massive protest context and public perceptions of police actions in that context.
We considered the most recent scholarly literature on police legitimacy (Jackson and Bradford 2019; Tankebe et al. 2016; Tankebe and Liebling 2013) to build our theoretical model: demographic (based on individual characteristics, such as age, race, gender, marital status, socioeconomic level); quality of life in the neighborhood (including variables such as fear of crime, satisfaction with the neighborhood, disorder); and experiences with police (variables based on actual or previous encounters with the police in addition to the perception of legitimacy, fair treatment by the police, and institutional effectiveness). These variables resulted in an integrated model of satisfaction with police that better understood citizen-police interactions.
Furthermore, having an integrated model underscores the importance of police legitimacy centered on the perception of fair treatment by the police, respect for human rights, and the belief that the police represent society. The Carabineros, as an institution, have an extensive bottom line. Police conduct many tasks, such as community policing, crime investigation, transit control, and public order management, which put them in regular contact with citizens. For instance, the Carabineros are allowed to stop and search any individual or vehicle under reasonable grounds of security risk. Except that 2019, there were more than 5 million searches in a country of little more than 17 million inhabitants (Duce and Lillo 2020).
The findings of this study have regional implications for theories that have been tested in the United States and Europe but not in Latin America. As democracies in Latin America embark on policy efforts to reform police forces to focus less on being “tough on crime” and more on building a fair, just, and nonviolent police force, it is important to shed light on evidence-based approaches that can promote police legitimacy. The results here have several practical policy implications for police reform. Most reform efforts have focused on increasing police power or incorporating newer technology to try to better control crime and violence. The debate around the effectiveness of these reforms is far from settled. At a deeper level, there is a need for a cultural change within the police that can yield lasting results. This includes training to help redefine community-police relationships and police interactions with citizens. Furthermore, sustainable police reforms should encourage civilian involvement to foster transparency, accountability, and civil control.
This study is structured as follows. The next section presents and discusses the theoretical framework and reviews the literature on the determinants of police satisfaction in Chile. The following section briefly introduces the Carabineros and their roles and responsibilities. The methodological approach and the data used in the study are then introduced. The subsequent section presents the results of the three models tested, followed by a discussion, limitations, and conclusions.
Satisfaction with the Police: A Theoretical Framework
The relationship between citizens and the police lies at the center of multiple social analyses that recognize that the latter personifies both the moral authority and the legitimacy of the state (Tyler Reference Tyler1990). Previous research has shown the impact that positive perceptions of the police have on citizens’ sense of obligation to obey the law, attachment to democratic institutions (Tyler et al. Reference Tyler, Phillip Atiba and MacCoun2015; Karakus et al. Reference Karakus, McGarrell and Basibuyuk2011), levels of cooperation with the police (Skogan Reference Skogan2006), and the development of informal social control (Triplett et al. Reference Triplett, Sun and Gainey2005).
Three concepts are used, sometimes interchangeably, to define the citizen- police relationship: confidence, trust, and satisfaction with the police. Both trust and confidence represent a global approach to this assessment and imply a “feeling of security” based on a rational, self-perceived, or institutional perception of risk or threat (Cao Reference Cao2015, 241). On the other hand, satisfaction with the police is an internal state of mind unique to an individual, based on previous personal or vicarious experiences with the police (Cao et al. Reference Cao, Lai and Zhao2012; Karakus et al.Reference Karakus, McGarrell and Basibuyuk2011).
While much research centers on trust and confidence, multiple recent police reform initiatives have emphasized the importance of the characteristics of police- citizen encounters. The existing research on satisfaction with the police is extensive but focuses primarily on North American and European contexts, where citizens generally have positive perceptions of the police (Ren et al. Reference Ren, Cao, Lovrich and Gaffney2005). This situation seems to vary in other contexts, as shown by studies on India (Kumar Reference Kumar2019), Turkey (Karakus et al. Reference Karakus, McGarrell and Basibuyuk2011), China (Hu and Dai 2014), Taiwan (Lai and Zhao 2016), and Japan (Cao et al. Reference Cao, Stack and Sun1998).
In Latin America, research on perceptions of police is scant. Lack of reliable information and transparency in police work has limited research on police organizations (Sozzo Reference Sozzo, Bradford, Jauregui, Loader and Steinberg2016; Cruz Reference Cruz2015). However, most researchers working on criminal organizations (Lessing and Willis 2019; Willis Reference Willis2015; Durán-Martínez Reference Durán-Martínez2018), violence (Müller Reference Müller2018; Auyero et al. Reference Auyero, de Lara and Berti2014), or security (Malone and Dammert Reference Malone and Dammert2021; Arias and Goldstein 2010) argue that confidence in the police is very low.
Understanding satisfaction with the police is, therefore, a key aspect of police research in Latin America. It can enable governments to develop public policies geared toward enhancing community policing—based programs over zero tolerance and “iron fist” initiatives, which has been the trend in many Latin American countries (Frühling Reference Frühling2012; Malone and Dammert Reference Malone and Dammert2021). In addition, satisfaction with the police increases our knowledge surrounding the expectations that citizens have for their authorities, specifically those who have the monopoly of the use of force. In a context marked by prominent levels of violence, organized crime, and street protests, satisfaction with the police should be considered an important element of the quality of and prospects for democratic processes in Latin America.
Also, understanding the importance of citizen-police interactions is key to opening a debate on the most effective police organizational structure to control and prevent crime while respecting human rights. Current police organizational structures in the region tend to be highly centralized and hierarchical, to focus heavily on crime control rather than prevention, to have limited training in real-life situations, and to lack an understanding of approaches to deescalating violent events.
What factors determine satisfaction with police? Researchers have approached this question in Latin America in a more intuitive manner, and the response has historically pointed to the effectiveness of crime control and prevention policies. This has led to stronger legal punishment, the consolidation of more police functions and missions, an increase in police budgets and personnel, and the implementation of new technologies in an attempt to “solve” citizens’ problems of insecurity. Factors linked to police satisfaction that appeared to be unrelated have been increasingly recognized as complementary (Karakus et al. Reference Karakus, McGarrell and Basibuyuk2011; Lai and Zhao 2016). Therefore, a comprehensive examination of police satisfaction would require an integrated model based on three theoretical models: individual characteristics (age, race, gender, marital status, socioeconomic level); quality of life in the neighborhood (fear of crime, satisfaction with the neighborhood, neighborhood disorder); and encounters with the police (perception of legitimacy, fair treatment, effectiveness).
Demographic Model
Initial research on satisfaction with police focused on individual characteristics, such as race, age, and gender (Reisig and Parks 2006; Sullivan et al. Reference Sullivan, Dunham and Alpert1987). Negative views of the police are linked to paradigms of territorial control and violence that the police exert, in the United States, mostly against young African American males (Bowling Reference Bowling2000). In general, men have significantly more encounters with the police, as both victims and victimizers, but Latinos and African Americans tend to have lower perceptions of the police (Skogan Reference Skogan2006). At the same time, minority youth perceive the police as an institution that tends to limit their freedom, often violently (Cao et al. Reference Cao, Stack and Sun1998).
Additionally, those with the lowest socioeconomic status, whether measured by income or educational level, tend to have a worse perception of police work. The “sense-of-injustice model” points to the most vulnerable communities as those that experience higher levels of police control (Yuning et al. Reference Yuning, Sun and Triplett2009). This relationship further confirms “stop and search” data that show significant levels of racial profiling and discretionary measures taken against minorities (Murray Reference Murray2017).
Furthermore, marital status and homeowner characteristics play a role in determining satisfaction with police work. Research suggests that individuals who are single or living in rental property are less satisfied with police because of their lower degree of integration in their community than residents who own property.
Although these studies have pointed out the relevance of demographic variables, there is no clear consensus on the direction and significance of these variables with police work (Karakus et al. Reference Karakus, McGarrell and Basibuyuk2011). These divergences have spurred the development of an integrated model in which demographic variables, specifically race and socioeconomic status, appear to be more relevant when examining satisfaction with the police (Yuning et al. Reference Yuning, Sun and Triplett2009).
In Latin America, those who have suffered the most police violence tend to be young males, predominantly from impoverished areas of large cities (Christiani Reference Christiani2020; Cruz Reference Cruz2015; Carrión et al. Reference Carrión, Imbusch and Misse2011).
Although quantitative research on this topic is generally lacking in the region, substantial qualitative work has shed light on discretionary policy decisionmaking, the process of police actions, and discriminatory and violent policing toward poor young males (Auyero et al. Reference Auyero, de Lara and Berti2014; Sobering and Auyero 2019; Willis Reference Willis2015).
Quality of Life Model
The characteristics of the neighborhood where an individual resides play an important role in determining satisfaction with police work. Research shows that factoring variables on the quality of life in the neighborhood diminishes the relevance of demographic variables (Reisig and Parks 2006; Lai and Zhao 2016; Yuning et al. Reference Yuning, Sun and Triplett2009). The quality of life model posits that satisfaction with the police is directly related to variables such as the perception of order, social cohesion, and social control (Tankebe et al. 2016; Lai and Zhao 2016).
Although the variables used in this model are diverse, the presence of disorder in the community is considered the most reliable predictor of satisfaction with the police (Lai and Zhao 2016). Citizens who believe that general disorder, violence, and insecurity are present in their neighborhood are typically less satisfied with police work, since it is understood that these problems occur due to the institutional inability to prevent or control them (Sunshine and Tyler Reference Sunshine and Tyler2003; Jackson and Bradford 2019). Also, citizens living in large cities are less satisfied with the police, due not only to perceived disorder in their city but to the lack of an emotional bond with the community (Cao and Zhao 2005)
In Latin America, decades of limited planning and poor investments in infrastructure have resulted in highly fragmented and segregated megacities. The legacy of this rapid urban development has a strong security dimension, in which poverty, vulnerability, and urban inequality are strongly associated with violence and the presence of criminal organizations that exploit the security vacuum in these marginalized areas. In fact, there is an important body of research on police violence, corruption, and inefficiency in those areas. The research on police activity in the urban margins shows how the state itself is part of the violence that affects the poor in Mexico (Müller Reference Müller2018), Colombia (Moncada Reference Moncada2016), Brazil (Alves Reference Alves2018), Chile (Larenas et al. Reference Larenas, Jorge and Javiera2018), Venezuela (Gabaldón Reference Gabaldón2016) and Argentina (Auyero and Sobering 2019).
Experience with Police Model
The experiential model emphasizes the significant role that direct encounters with the police play in the perception of the institution itself (Pryce Reference Pryce2018). Involuntary citizen- police encounters, such as stop and search actions, lead to worse perceptions of the police than those that are voluntary, such as reporting a crime (Yuning et al. Reference Yuning, Sun and Triplett2009).
Policing can take multiple forms and be linked to different objectives, such as crime prevention, crime control, and public order management. Advocates of community policing emphasize the relevance of positive encounters with citizens and communities. Most of these positive community policing approaches, however, are concentrated in residential areas, while more repressive measures are used at the urban margins (Auyero and Sobering 2019). In these more marginalized areas, the more personal or vicarious encounters an individual is involved in, the less institutional satisfaction with the police.
This discussion warrants the following question: do all citizen-police encounters result in less satisfaction with police work? Research has emphasized that procedural justice and legitimacy are elements that define this relationship. Scholars who believe in procedural justice as an important characteristic of encounters with the police state that when the treatment is fair, respectful, and nondiscriminatory, satisfaction with police work increases, even if concrete results are not achieved (Tyler Reference Tyler1990). In that sense, limited satisfaction with police work is not a self-fulfilling prophecy in which police interactions with the community yield negative results. In fact, the police have the opportunity to increase citizens’ satisfaction by changing the way policing is actually implemented.
The Chilean case is especially relevant for this analysis for three main reasons. Its police institution in charge of crime control and prevention (Carabineros de Chile) is considered an example of professionalism and discipline throughout the region; the context of the study was marked by the social upheaval of 2019, in which police brutality played an important role; and the Carabineros have already begun implementing community policing initiatives in the last decade at the local level, designed to increase community relations and create a general sense of institutional legitimacy.
The Carabineros de Chile
The Chilean police have been considered the best example of professionalization and institutional transformation in Latin America (Corbacho et al. Reference Corbacho, Phillip and Ruiz-Vega2015; Dammert Reference Dammert, Sieder and Alfonso2019). The Carabineros de Chile, a military-style, uniformed police and national command, has had the ability to transform itself into an institution recognized for developing innovative crime control and prevention initiatives, as well as outreach activities with citizens, leaving behind the stigma associated with being the only police institution in Latin America that took part in a military dictatorship during the Pinochet rule, from 1973 to 1990 (Frühling Reference Frühling2012). As Chile transitioned to democracy, the Carabineros became the backbone of security policies that made virtually no change to either police culture or its structure following the dictatorship.
For almost three decades, trust in the police was used as the main indicator of satisfaction and effectiveness, since the Carabineros were among the most reliable institutions in the country (Bonner Reference Bonner2013). A longitudinal analysis of trust in the Carabineros shows that they had the highest levels of trust in 2015 (57 percent) and 2016 (54 percent), the second-highest in 2017 (54 percent), and the sixth-highest in 2019 (17 percent). Although trust levels were in decline, these were still higher than any other political institution (CEP 2020). This positive perception of the police was linked to a constant and well-developed communication campaign that emphasized lack of corruption, strong citizen support, and the police’s institutional protective role (Bonner Reference Bonner2013). As noted, trust is a broad assessment that is not necessarily linked to a specific experience with the police. In Chile, trust provided an element of legitimacy that eroded any possible limitation on the Carabineros’ high level of political autonomy.
A different source shows 2017 as a breaking point in the general positive evaluation of the Carabineros’ work (CADEM 2020). That year a massive corruption scandal, involving dozens of high-ranking officers who took part in fraudulent activities that amounted to more than US $15 million, was made public. While the institution itself was rocked by media investigations of the scandal, in early 2018 a group of high-ranking officers was linked to an intelligence operation to illegally accuse a group of Indigenous Mapuche comuneros of violent acts. The so-called Operación Huracán had relevant political and institutional consequences that included a complete reform of the intelligence unit, as well as drastic changes in police leadership. At the end of the same year, the murder of a young Mapuche, Camilo Catrillanca, turned into yet another police scandal, during which it was discovered that the Carabineros had attempted to develop a cover-up strategy aimed at labeling the encounter as a violent confrontation (Dammert Reference Dammert, Araujo and Colección2020). Finally, in October 2019, a general social outburst highlighted violent police practices of public order management that generated national and international claims of human rights abuses (Human Rights Watch 2019).
The performance index of Carabineros developed by the Fundación Paz Ciudadana (Citizen Peace Foundation) includes satisfaction with postcomplaint police actions and general satisfaction with police work in respondents’ neighborhoods. It found a significant decline in approval of police performance during the period 2010–2019 (FPC 2020).
This evidence draws attention to the importance of satisfaction with police work in Chile and its relationship with procedural justice and legitimacy. In the context of organizational crisis and declining public trust, understanding the relationship between these factors will shed light on a critical issue in policing studies, not only in Chile but throughout Latin America.
Methodology and Data
Police studies in Latin America are limited, due mostly to a lack of adequate and transparent administrative data, and Chile is no exception. To address this limitation, we designed and conducted a representative survey in the Metropolitan Region of Santiago between the months of January and March 2020, right after the social upheaval of 2019. The process to generate the survey sample was as follows. The survey population included respondents 18 years of age and older from urban and rural areas of the Metropolitan Region. To stratify the sample, we created two clusters, based on two variables at the community level: crime rate per one hundred thousand population and Carabineros’ presence per one hundred thousand population.
With this information, we classified each district—known as comuna in Spanish—into one of four possible clusters (A, B, C, and D). Subsequently, to pick the sample of districts in the survey, we considered the proportion of each cluster at the province level. For each district drawn, we chose blocks at random, based on the socioeconomic diversity of the district, using cartography and census data (INE 2017), as well as block-level socioeconomic classification. The final survey had a margin of error of 3.2 percent and a confidence level of 95 percent and comprised 932 respondents.
As noted, we followed recent literature on the topic of police legitimacy and employed a set of variables that could help us examine the determinants of citizens’ satisfaction with police work.
Demographic Model
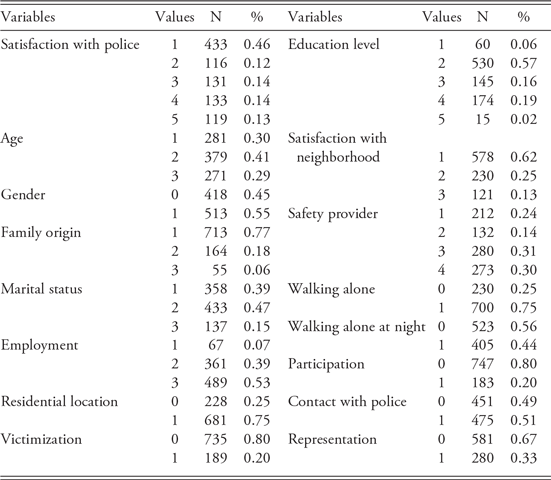
We included six sociodemographic variables in the econometric model: age, gender, marital status, employment status, head of household education level, and family origin. The age of the respondents (AR) at the time of the survey is an ordinal variable defined as 1 (18<AR<30), 2 (30<=AR<55), or 3 (AR>55). Gender is a binary variable coded as 1 (female) or 0 (male). Marital status is a categorical variable defined as 1 (single), 2 (married or cohabiting with a partner), or 3 (widowed, divorced, or separated). Employment status is a categorical variable defined as 1 (student), 2 (unpaid worker), or 3 (paid worker). The head of household’s education level is defined within a range from 1 (no school) to 5 (graduate). Family origin (FO) is defined as the city where the mother lived at the time of the respondent’s birth. This categorical variable is defined as either 1 (same city), 2 (in another city in Chile), or 3 (in another country) (see tables 2 and 3 in the appendix).
Quality of Life Model
We employed ten variables in the quality of life model. The first six variables are dichotomous. The respondent’s residential location was assigned a value of either 0 (rural) or 1 (urban). The respondent’s victimization by a serious crime was coded either 1 (victim) or 0 (nonvictim). Participation indicates whether the respondent had been involved in any political, social, religious, cultural, sporting, environmental, or animal rights group in the last year and was coded 1 (yes) or 0 (no). Perception of police presence indicates whether the respondent knew where the nearest Carabineros police station was and was coded 1 (yes) or 0 (no). Fear of crime when walking alone in the neighborhood or at night was coded either 1 (yes) or 0 (no).
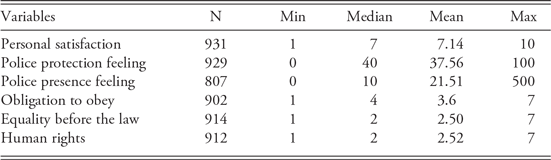
The other four variables are either ordinal or categorical. Satisfaction with the neighborhood is an ordinal variable with the following values: 1 (high), 2 (medium), or 3 (low). Personal satisfaction is an ordinal variable that indicates the respondent’s level of satisfaction with his or her own life and has a range of 1 (low) to 10 (high). The safety provider is a categorical variable that indicates who, in the respondent’s view, is primarily responsible for safety in the neighborhood; we coded it 1 (the Carabineros), 2 (municipal security), 3 (neighbors), or 4 (nobody). Finally, the respondent’s sense of protection is a bounded variable that captures how safe the respondent felt in the presence of the police. It was coded from 0 to 100 indicating a range from low to high sense of protection.
Experiential Model
This model included five variables. The first variable captures whether or not the respondent had any contact with the Carabineros. This variable was coded 1 (Yes) or 0 (No).
The remaining variables in this model are related to police legitimacy and include representation, obligation to obey, equality before the law, and respect for human rights. Representation captures the respondent’s beliefs on whether or not the Carabineros represent the Chilean society. It was coded 1 (yes) or 0 (no). The obligation to obey is an ordinal variable and indicates the degree to which the respondents agreed with the statement, “The orders and decisions of Carabineros must be obeyed even if you think that these decisions are wrong.” Equality before the law is an ordinal variable that captures the degree to which a respondent agreed with the sentence, “The Carabineros apply the law to everyone equally.” Finally, respect for human rights is an ordinal variable and captures the degree to which the respondents agreed with the statement, “The Carabineros respect human rights.” The response options in the ordinal variables ranged from 1 (disagree) to 7 (strongly agree).
Satisfaction with Police
We employed the following question in the survey to define our dependent variable: “Do you believe that the Carabineros, as an institution, meet the safety requirements of the citizens?” We used this question as a proxy for overall satisfaction with the Carabineros. This is a Likert scale question, and the responses ranged from 1 to 7, where 1 is the lowest level (indicating that the respondents did not believe they met the safety requirements) and 7 is the highest level (indicating that they believed they fully meet the safety requirements). Given the low frequency of responses to the question’s lowest and highest values, we recoded the answers into five categories by joining levels 1 and 2 into a new category that captures the lowest level of satisfaction and levels 6 and 7 into another category that reflects the respondent’s highest level of satisfaction (see appendix tables 2 and 3).
We fitted our model using an ordinal logistic regression with a cumulative link function. These types of models are also known as proportional odds models and are often used when the dependent variable is ordinal in nature and has two or more categories. They thereby allow researchers to estimate the proportional odds of being above or below a response category. To illustrate this with our dependent variable of interest, this model estimated the respondent’s odds of being above or below a level of satisfaction.
We implemented the analyses using the clm function from the R package “ordinal” (Christensen Reference Christensen2019). This model is characterized by having one parameter per explanatory variable; that is, the value of the parameter is independent of the category of the dependent variable. The ordinal logistic regression with cumulative logit link function can be defined by the following equation:
logit (π j .) = β 0j + β 1 x 1 + … + β p x p
where π j is defined by the probability of the jth item, with j = 2, …, k and k is the number of classes of the dependent variable. In addition, x 1 is the ith explanatory variable, with i = 1,., p, and β i . as its respective parameter.Footnote 2 The probability of being closer to the next item in the response can be derived by the following equation:
π1 = 1 – π2 –…– π k .
Consequently, the model parameters must be interpreted as an increase in an explanatory variable, which implies that the probability of a respondent’s higher level of satisfaction with the Carabineros increases in e βi . This value is known as the odds ratio of the explanatory variable i.
The interpretation of the odds ratio is as follows: a ratio greater than 1 implies that an increase in an explanatory variable is associated with an x percent increase in satisfaction with the Carabineros (improvement factor). For example, an odds ratio of 1.07 indicates a 7 percent increase in satisfaction with the Carabineros, all else equal. Conversely, an odds ratio of less than 1 implies that an increase in a given explanatory variable is associated with a decrease in the satisfaction with the Carabineros (worsening factor). For example, an odds ratio of 0.89 indicates an 11 percent decrease in satisfaction with the Carabineros, holding other factors constant. Finally, an odds ratio equal to 1 indicates no association in a variable explaining satisfaction with the Carabineros, holding other factors constant. For consistency purposes, we will interpret the regression in odds ratios.
We also estimated the marginal effects, which capture the change in the probability that the outcome occurs as the explanatory variable changes by 1 unit. For example, given that age is a continuous variable, the marginal effects measure the conditional change of one additional year of the respondent’s age on the perception of police. The results are not reported here but are available on request. We do, however, present figures that illustrate the size of the coefficients of the explanatory variables in each of the models, including categorical variables disaggregated by each category, where appropriate.
Results
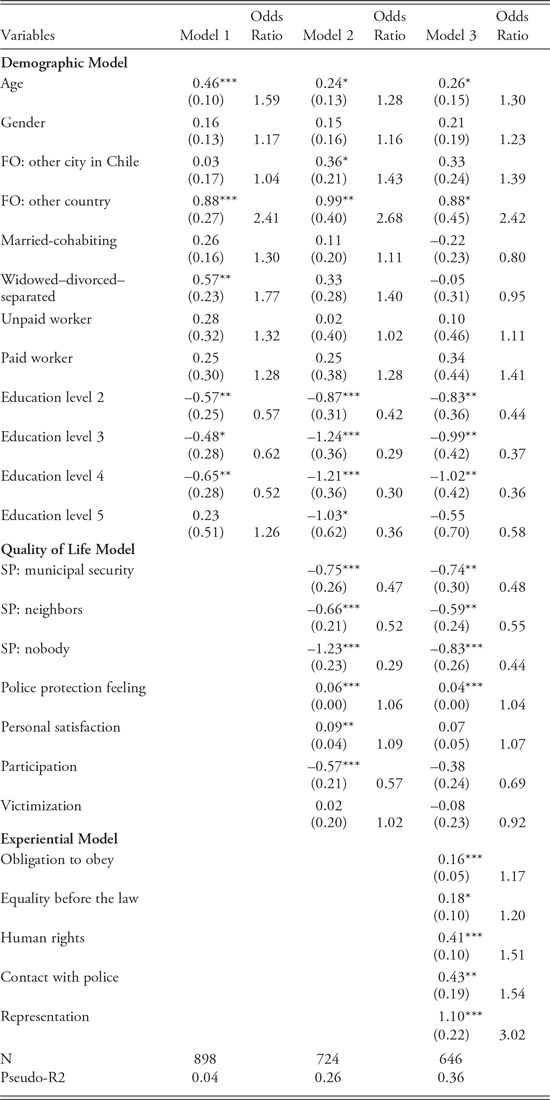
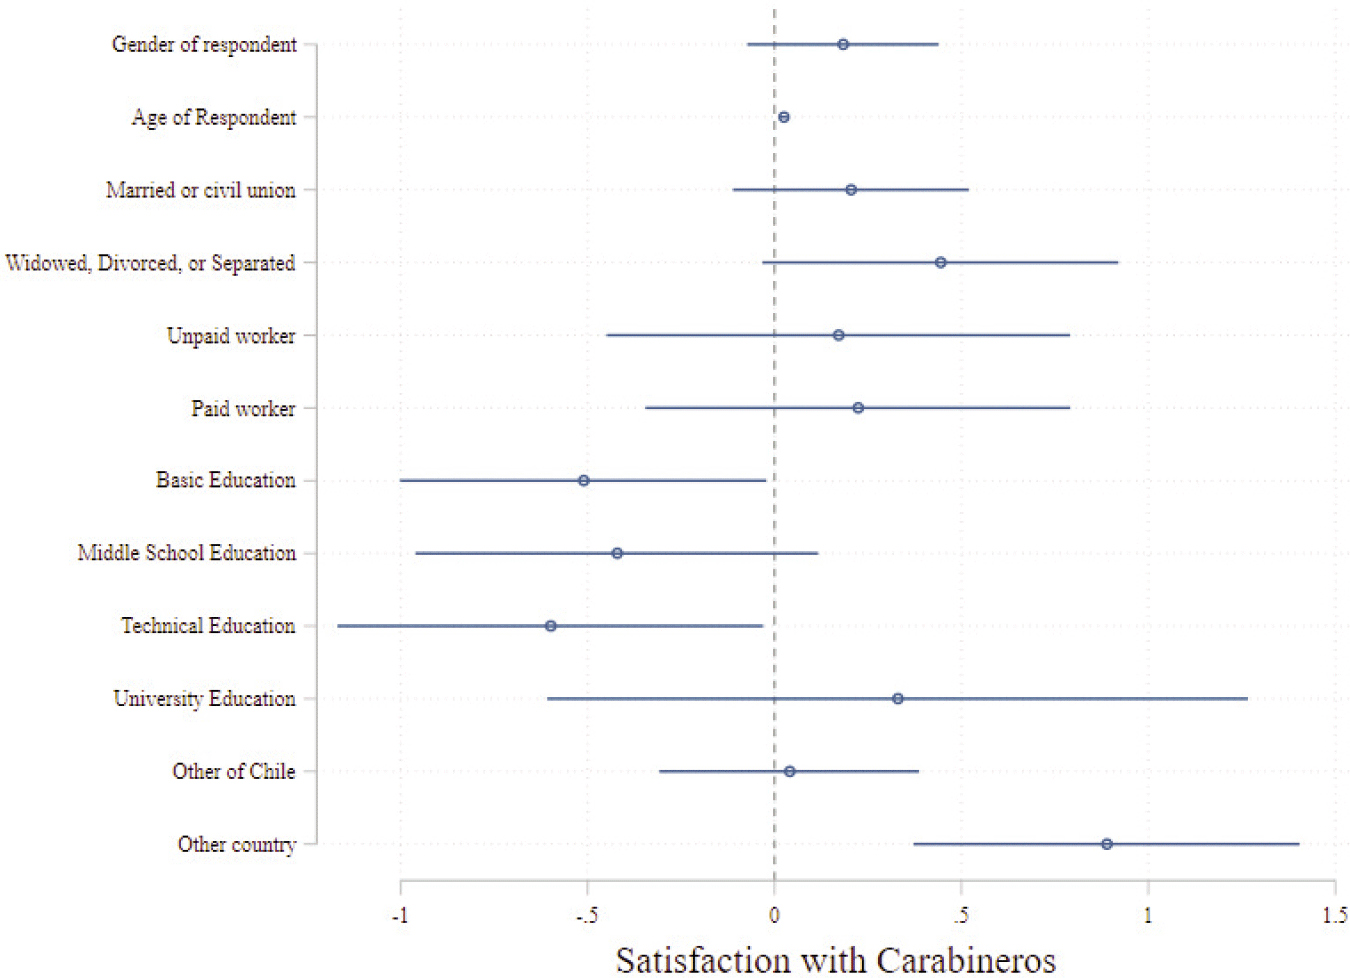
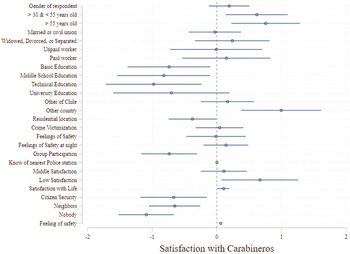
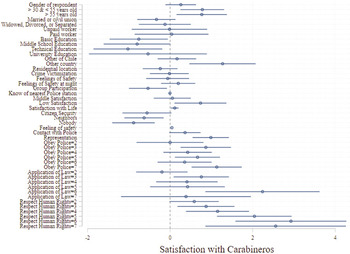
Grouping the explanatory variables into the three models and following previous research, we used a sequential approach by first fitting the socioeconomic model, followed by the quality of life model and finally including the experiential model (Karakus et al. Reference Karakus, McGarrell and Basibuyuk2011). We present the results of each model in table 1; figures 1 to 3 plot the point estimates with confidence bands for each model.
Ordinal Logistic Regression for Satisfaction with Police

*p < .10, **p < .05, ***p < .01
Coefficients reported, standard errors in parentheses.
Coefficient Size, Demographic Model

Coefficient Size, Demographic and Quality of Life Models

Coefficient Size, Integrated Model (Demographic, Quality of Life, and Experiential Models)

Table 1 presents the estimated parameters and their degree of statistical significance for each of the three models.Footnote 3 The results of the first model—the demographic model—indicate that the coefficients of age, marital status, and migration status of the respondent are positive and statistically significant. Specifically, holding other factors constant, the older the individual, the higher the satisfaction with the Carabineros by about 1.6 times. Similarly, the odds of satisfaction with the Carabineros increases by 1.8 times for respondents who are widowed compared to married respondents. Furthermore, being born in another country increases the odds of satisfaction with the police by 2.41 times compared to respondents born in the same city as their residence. On the other hand, being a head of household with secondary, technical, and higher education reduces the odds of satisfaction with the Carabineros compared to respondents with basic or no education at all.
In the quality of life model, we added five additional variables to the six used in the demographic model. The model fit improved significantly, with a pseudo-R2 of 0.26 compared to 0.04 in the demographic model.
The results show that the sense of protection felt in the presence of police, personal satisfaction, and the respondent’s migration status are positively associated with increased satisfaction with Carabineros. In particular, the results indicate that respondents who migrated from other countries increased the odds of satisfaction with the police by 2.68 times over those who resided in the same city of birth. In addition, holding other factors constant, feelings of protection in the presence of police and personal satisfaction with the police increase the odds of satisfaction with the police by 1.06 and 1.09 times, respectively.
Conversely, heads of households with secondary, technical, and higher education; respondents who participate in groups; and the perception that the police are not responsible for providing safety in the community are all correlated with lower odds of satisfaction with the police. Regarding this last variable, when the respondent believes that no one assumes responsibility for the security in the community, the satisfaction with the police decreases 0.29 times compared to the respondent’s perception that this institution is in charge of providing security.
In the experiential model, we added 5 variables to the demographic and the quality of life models, totaling 16 explanatory variables for this model. Adding new explanatory variables improved model fit. The pseudo-R2 was 0.36 compared to 0.26 in the model with demographic and quality of life variables.
The results suggest that the obligation to obey, equality before the law, human rights, and institutional representation of society were positively associated with increased satisfaction with the Carabineros. The odds ratio suggests that respondents’ perception that citizens have an obligation to obey the police makes them 1.17 times more likely to be satisfied with the police. Similarly, respondents who feel that the police are fair by applying the law equally are 1.2 times more likely to be satisfied with the Carabineros compared to their peers who do not think the police are fair. We found similar results with those respondents who think the Carabineros respect human rights. These respondents are 1.5 times more likely to have higher levels of satisfaction with the police.
Interestingly, respondents’ previous contact with the police increases the odds of satisfaction with the police by 1.5 times compared to those respondents who have not had previous contact with the police. This suggests that respondents’ interactions with police tend to be positive and to lead to more satisfaction. We further examined the behavior of this variable by running additional specifications and interacting the variable with age, socioeconomic status, education, and gender. The results show that the interaction of having a university education with the contact with police variable increases the odds of having positive perceptions of the police.Footnote 4 This suggests that as the respondent’s level of education increases, so do the respondent’s negative perceptions about the police. The other interactions we tested did not yield statistically significant results at conventional levels (p < .05).
Respondents who perceive the existing police institution as representative of Chileans are 3.02 times more likely to be satisfied with the police than those who think otherwise. This suggests that citizens’ previous beliefs about what the institution represents in society influence how citizens view their encounters with police.
Discussion, Limitations, and Conclusions
This study has examined the determinants of satisfaction with police work in Chile using three of the most relevant models in the scholarly literature on this topic. In particular, it tested the demographic, quality of life, and experiential models. The results indicate that the models predict the degree of citizen satisfaction with the Carabineros police. These results are consistent with the scholarly literature on satisfaction with police forces in more developed countries.
The results can be summarized in four main areas. First, the variables of the experiential model are strongly correlated with citizens’ satisfaction with the police. Tankebe et al. (2016) posit that an institution like the police, which is representative of society and provides respectful treatment of human rights, have a positive impact on institutional satisfaction. Similarly, an important variable in procedural justice models like the citizen’s obligation to obey (Worden and McLean Reference Worden and McLean2017) is also correlated with higher odds of police satisfaction in the model. Citizens who feel that they must obey police orders despite disagreeing with them tend to have greater satisfaction with the institution.
Second, in all models, migration is positive and significantly associated with higher odds of positive perceptions of police. In other words, satisfaction with police work increases if the person has migrated from another country. This finding may be explained by the fact that the main migrant groups in Chile come from Venezuela, Colombia, and Haiti, where experiences with police may be more violent. Also, the fact that migrants in Chile are not allowed full participation in political demonstrations influences the type of interaction they have with the Carabineros, which is mostly related to crime prevention. Furthermore, since the enforcement of the migration law is not the responsibility of the Carabineros, their experience with migrant populations is also limited.
Third, the educational level, which we used as our main variable to capture the socioeconomic characteristics in Chile (Garretón Reference Garretón2017), is negatively correlated with satisfaction with the police across all models. Respondents with more education may have higher expectations of the police’s ability to prevent and control crime.
Fourth, the feeling of protection, meaning rhe relation of police presence to people’s sense of security, is directly related to satisfaction levels. Another variable related to protection is the perception of security responsibility. In all cases in which the perception is that no one is responsible, satisfaction with the institution drops. Both results recognize the role that people give to the police beyond the problems and difficulties of the context in which the fieldwork is carried out; there would be citizen expectation regarding the role of protection and responsibility that could become a basis for any institutional transformation process.
The study also reveals some results that differ from previous research in this area. In particular, it is worth noting the result of the variable capturing previous encounters with police, which yielded a positive association with police satisfaction. We further examined this variable by interacting it with socioeconomic characteristics, and the interaction with higher education was the only measure that was significantly correlated with police satisfaction. Prevous research in this area has shown negative correlations between police encounters and citizen satisfaction (Correia et al. 1996; Reisig and Parks 2006). Using different conceptualizations of police satisfaction between general satisfaction with police activities, satisfaction with crime control, and satisfaction with the management of public demonstrations did not yield significant variation in the results. Therefore, we opted for running the models with the general satisfaction of police activities. The limited research on police satisfaction in developing countries may explain the results. More research will be needed to understand this finding.
The age and gender variables were not significant at levels previously identified in the literature (Tankebe et al. 2016). In the case of age, the quality and experience models include other variables that explain this effect. Thus, for example, age has a high correlation with satisfaction with the police but is highly correlated with the feeling of protection and with all the variables in the experiential model.
Altogether, the findings of this research underscore the relevance of this study to help understand the levels of satisfaction with police in Chile. Furthermore, our findings help set the stage to learn more about policing and citizen satisfaction in the region. This will require translating the findings into actionable activities that can improve police organizational structure and operations. Furthermore, our findings shed light on the importance of focusing the discussion on the quality of policing rather than whether police under- or overcontrol in a specific place (Lum Reference Lum2021). In this sense, the findings allow us to emphasize a different yet important angle of police reforms in Latin America. These reforms will therefore require both increasing the capacity of police officers and recognize the importance of promoting structural changes that incorporate training on procedural justice in all areas of police work.
In a nutshell, strengthening satisfaction with the police requires a shift in policing from an approach that merely emphasizes an effective police presence to one that also promotes legitimacy, fair treatment, and respect for human rights. The Chilean case demonstrates that even for police institutions that have been consistently considered professional and respectful of citizens’ rights, there still is a strong presence of authoritarian, reactive, and heavy-handed approaches to policing. Future reform processes aimed at improving the relationship between the police and the public will require policies that focus on reducing discriminatory and violent treatment, as well as reformulating personnel training and evaluation systems, with an emphasis on respecting human rights.
Appendix
Frequency Analysis of Categorical Variables

Summary Statistics of Quantitative Variables