Introduction
Wheat (Triticum aestivum L.) is a cornerstone of global food grain production (Guarin et al., Reference Guarin, Martre, Ewert, Webber, Dueri, Calderini, Reynolds, Molero, Miralles, Garcia and Slafer2022). Sustaining wheat production is therefore crucial for food security, especially in the face of climate change and growing demand (Mottaleb et al., Reference Mottaleb, Kruseman, Frija, Sonder and Lopez–Ridaura2023). While increasing yields in established production zones remains important, expanding wheat cultivation into non-traditional regions of South Asia also offers opportunities to enhance national production (Kandpal et al., Reference Kandpal, Kiran Kumara, Sendhil, Balaji, Kashyap, Gupta, Gupta, Sendhil, Gopalareddy, Jasrotia and Singh2022). In India, wheat cultivation is predominantly concentrated in the Indo–Gangetic Plains (Hazra et al., Reference Hazra, Ghosh, Venkatesh, Nath, Kumar, Singh, Singh and Nadarajan2018; Nandan et al., Reference Nandan, Singh, Kumar, Singh, Hazra, Nath, Malik, Poonia and Solanki2018). In contrast, the eastern Tarai belt – located along the outer Himalayan foothills and adjoining hill regions – represent non-traditional wheat-growing areas with comparatively lower productivity (Ramadas et al., Reference Ramadas, Kumar, Singh, Shah, Khan, Iqbal, Turan and Olgun2019; Gnanasing Jesumaharaja et al., Reference Gnanasing Jesumaharaja, Dhar, Bhaumik, Yonzone, Debnath, Dinesh Kumar, Ahila Devi and Hembram2023). These regions, characterized by short winters and high humidity, are particularly vulnerable to terminal heat stress (THS), which severely affects wheat growth, development, and yield (Sendhil et al., Reference Sendhil, Singh, Ramasundaram, Kumar, Singh and Sharma2014; Biswas, Reference Biswas2016; Maheswari et al., Reference Maheswari, Sarkar, Vanaja, Srinivasa Rao, Prasad, Prabhakar, Ravindra Chary, Venkateswarlu, Ray Choudhury, Yadava and Bhaskar2019).
Rising ambient temperatures pose a major threat to global wheat production (Lobell et al., Reference Lobell, Sibley and Ortiz–Monasterio2012; Asseng et al., Reference Asseng, Cammarano, Basso, Chung, Alderman, Sonder, Reynolds and Lobell2017). Wheat is grown on ∼220 million ha worldwide, covering nearly 30% of global agricultural land, with nearly half of these regions experiencing an abnormal rise in average temperatures (Djanaguiraman et al., Reference Djanaguiraman, Boyle, Welti, Jagadish and Prasad2018). Consequently, wheat is becoming increasingly vulnerable to THS, which disrupts physiological processes, impairs grain development, and ultimately reduces yield (Chowdhury et al., Reference Chowdhury, Ghosh, Lal, Pal, Hazra, Acharya, Chaurasiya and Pathak2020; Gurumurthy et al., Reference Gurumurthy, Arora, Krishna, Chinnusamy and Hazra2023). Temperatures exceeding 20–22°C during the period between spike initiation and anthesis adversely affect reproductive physiology, leading to reductions in grain number per spike and overall grain weight (Liu et al., Reference Liu, Ma, Tian, Wang, Tang, Cao and Zhu2017; Sattar et al., Reference Sattar, Nanda, Singh, Jha and Bal2023). The magnitude of heat-induced yield loss, however, is highly site-specific and depends on regional agroclimatic conditions and cultivar sensitivity (Lobell et al., Reference Lobell, Ortiz–Monasterio, Sibley and Sohu2013; Bishwas et al., Reference Bishwas, Poudel and Regmi2021). While considerable progress has been made in elucidating the genetic basis of thermotolerance and developing heat-resilient wheat varieties for major production zones (Khan et al., Reference Khan, Ahmad, Ahmed and Iftikhar Hussain2021), the translation of global trends into localized impacts remains critically important. Notably, the implication of THS remain comparatively less studied in non-traditional wheat-growing areas such as the eastern Indo–Gangetic Plains (IGP), particularly the Tarai region of eastern India. Existing reports indicate a rising frequency and intensity of heat stress in this region, underscoring the need for developing adaptive strategies tailored to these unique agroecological conditions (Gupta and Kant, Reference Gupta and Kant2012; Mukherjee and Huda, Reference Mukherjee and Huda2018; Aryal et al., Reference Aryal, Sapkota, Khurana, Khatri–Chhetri, Rahut and Jat2020).
Heat stress during critical growth stages – especially anthesis and grain filling – reduces photosynthetic efficiency, induces oxidative stress, and restricts grain formation (Lal et al., Reference Lal, Tiwari, Gahlaut, Mangal, Kumar, Singh, Paul, Kumar, Singh and Zinta2021; Yadav et al., Reference Yadav, Choudhary, Singh, Lal, Jha, Udawat, Gupta, Rajput, Garg, Maheshwari and Hasan2022). A 1°C increase in mean air temperature can reduce wheat yield by 3–17% in the Gangetic Plains (Pask et al., Reference Pask, Joshi, Manès, Sharma, Chatrath, Singh, Sohu, Mavi, Sakuru, Kalappanavar and Mishra2014), and at the national scale, this translates to an estimated 4–5 million tonnes of yield loss for every 1°C rise (Aggarwal et al., Reference Aggarwal, Naresh Kumar and Pathak2010). These trends highlight the urgency of evaluating THS under late-sown conditions in the Tarai region, which is increasingly exposed to elevated temperatures during the reproductive phase. Several physiological traits – including membrane stability index (MSI), relative water content (RWC), chlorophyll retention, and canopy temperature regulation – are closely linked to genotype’s heat tolerance capacity (Alsamadany et al., Reference Alsamadany, Alzahrani and Shah2023; Lamba et al., Reference Lamba, Kumar, Singh, Chaudhary, Sharma, Yashveer and Dalal2023). Additionally, biochemical adaptations, such as enhanced antioxidant enzymes activities, osmolytes accumulation, and synthesis of phenolic compounds helps in mitigating oxidative damage and stabilize cellular structures (Hasanuzzaman et al., Reference Hasanuzzaman, Bhuyan, Anee, Parvin, Nahar, Mahmud and Fujita2019; Sachdev et al., Reference Sachdev, Ansari and Ansari2023). Evaluating these physiological and biochemical responses during critical growth stages, and linking them to yield, provides important insights into the regulation of heat tolerance. Wheat’s response to THS, however, varies considerably with both genotype and environment, emphasizing the need to better understand genotype × environment interactions within region-specific agroecosystems (Mishra et al., Reference Mishra, Shekhar, Chakraborty and Chakraborty2021). Comparative evaluation of regionally adapted cultivars under late-sown THS conditions is therefore essential for identifying suitable genotypes for stress-prone environments.
This study aims to assess the performance of diverse wheat cultivars under normal and late–sown conditions in the eastern Tarai belt of India. The focus was on identifying physiological and biochemical traits associated with heat sensitivity and their implications for yield. The primary hypotheses are: (1) late sowing exposes wheat crops to THS in the Tarai belt, with temperature intensity increasing with delayed sowing, (2) high–temperature effects on yield are directly linked to inefficiencies in major physiological and biochemical functions, and (3) the impact of THS is highly cultivar–specific. Findings from this study will support the development of targeted interventions to sustain wheat production in the study region and may be extrapolated to similar agroecological conditions.
Materials and methods
Site characteristics
The experiment was conducted at the University Research Field of Uttar Banga Krishi Viswavidyalaya (UBKV), Cooch Behar, West Bengal, India (26°24′02.1″N, 89°23′21.5″E; 43 m above mean sea level) during the winter seasons (November to April) of 2019–2020 and 2020–2021. The experimental site has a subtropical per–humid climate, with long–term average maximum and minimum annual temperatures of 31°C and 11°C, respectively. The weather parameters recorded during the cropping season are presented in Figure 1. The experimental soil was sandy loam in texture, classified as Typic Fluvaquents under the order Entisol. The surface soil had an electrical conductivity of 0.19 dS m–1, a pH of 5.83, 0.73% soil organic carbon. Available nutrient contents were 198.8 kg/ha nitrogen (KMnO4–N), 38.5 kg/ha phosphorus (Bray–P), and 135.6 kg/ha potassium (NH4OAC–K).
Diurnal variation in ambient temperature (DVT), sunshine hours (SSH), and cumulative rainfall (RF) during the 2019–2020 and 2020–2021 wheat growing season.

Treatment description
Five contrasting wheat cultivars (HD 2967, HD 3086, DBW 187, K 0307, and DBW 14) were selected based on acreage, regional popularity, maturity duration, and average yield. To expose the reproductive phase (anthesis to maturity) to high–temperature conditions, cultivars were sown on four different sowing dates: 20 November (normal sowing), 5 December (moderately late sowing), 20 December (late sowing) and 5 January (very late sowing). The heat–stress environments simulated by delaying sowing were designated as moderately late–sowing–induced high–temperature environment–I (LSE–I), late–sowing high–temperature environment–II (LSE–II), and very late–sowing high–temperature environment–III (LSE–III), whereas the timely–sowing environment (recommended sowing time) was designated as NSE. The experiment followed a split-plot design with three replications, where sowing time (environment) was allotted to the main plots and cultivars to the subplots. The dimensions of each subplot were 3 m × 5 m.
Crop management
Before sowing, the experimental field was ploughed once with a tractor–drawn cultivator, cross–tilled twice with a rotavator and planked to prepare a favorable soil tilth for seeding. Wheat was sown manually at a row spacing of 22.5 cm. At the time of seeding, N, P and K fertilizers were applied at 50–60–40 kg/ha (N–P2O5–K2O) as a basal dose. The crop was top-dressed with urea fertilizer (50 kg N/ha) in two equal splits each at the time of the 1st (25 days after sowing (DAS)) and 2nd (45 DAS) irrigations. Irrigation was scheduled at crown initiation stage (21 DAS) followed by IW/CPE (irrigation water/cumulative pan evaporation) irrigation scheduling approach with a threshold of 1.25. Manual weeding was performed to maintain weed–free conditions throughout the crop season. Timely plant protection measures were taken to prevent insect pests and diseases from damaging crops.
Observations on phenology
Phenological events were recorded by visual observations. Days to anthesis/flowering (DTF) was calculated as the number of days from sowing to the stage when 50% of the plants reached anthesis. Maturity dates were recorded when all plants and ears had turned golden yellow and were fully dried. The number of days from sowing to physiological maturity was noted as days to maturity (DTM). The difference between DTF and DTM was designated as the reproductive period (RP).
Crop stage-specific temperature calculation
Crop season temperature data were used to calculate maximum and minimum temperatures (°C) during flowering, represented as TMAXF, TMINF, following the methodology outlined by Lamichaney et al., (Reference Lamichaney, Parihar, Hazra, Dixit, Katiyar, Singh, Singh, Kumar and Singh2021). For each genotype, we computed the average ambient maximum/minimum temperature (°C) during flowering (at 50% flowering ± 3 days) to measure temperature intensity during this critical stage. Similarly, we determined the maximum and minimum temperature during the reproductive periods by averaging temperatures from 50% flowering to maturity, denoted as TMAXRP and TMINRP, respectively.
Analysis of plant biochemical and physiological attributes
For biochemical analyses, flag leaf samples were collected to estimate peroxidase, catalase, proline, and phenol contents. Peroxidase activity was determined following Sadasivam and Manickam (Reference Sadasivam and Manickam2008). A 0.5 g flag leaf sample was homogenized in 3.0 ml of 0.1 M phosphate buffer (pH 7.0) using a pre–chilled mortar and pestle. The homogenate was centrifuged at 18,000 rpm for 15 min at 5°C, and the supernatant was used as the enzyme source. The reaction mixture contained of 3.0 ml phosphate buffer, 50 µl guaiacol, 30 µl H₂O₂, and 30 µl enzyme extract. Absorbance was recorded at 436 nm, and enzyme activity was calculated using a standard formula. Catalase activity was measured according to Hameed et al., (Reference Hameed, Hussain, Gulzar, Aziz, Gul and Khan2012) with minor modifications. A 0.2 g leaf sample was homogenized in 1.5 ml of 50 mM phosphate buffer (pH 7.0) at 4°C, and the homogenate was centrifuged at 20,000 rpm for 20 min at 4°C. The reaction mixture consisted of 1.5 ml phosphate buffer, 0.4 ml distilled water, 0.1 ml enzyme extract, and 60 mM H₂O₂. The reduction in absorbance at 240 nm was monitored, and catalase activity was calculated accordingly. Proline content was estimated following Bates et al., (Reference Bates, Waldren and Teare1973). A 0.5 g sample was homogenized in 10 ml of 3% sulfosalicylic acid, filtered, and reacted with glacial acetic acid and ninhydrin. The mixture was heated in a boiling water bath, cooled, and extracted with toluene. Absorbance at 520 nm was used to quantify proline content. Phenol content was determined following Sadasivam and Manickam (Reference Sadasivam and Manickam2008). A 0.5 g sample was homogenized in 10 ml of 80% ethanol, centrifuged at 10,000 rpm for 20 min, and re–extracted with the same solvent. The pooled supernatant was evaporated, dissolved in water, and reacted with Folin–Ciocalteau reagent and sodium carbonate. Absorbance was recorded at 650 nm; phenol content was calculated.
Membrane stability index (MSI)
Flag leaf samples were randomly collected from each plot at anthesis, grain filling, and soft dough stages. For membrane stability index (MSI), 1 cm2 leaf disks (0.1 g fresh tissue) were rinsed with tap and double–distilled water and placed in 10 ml deionized water at 40°C for 30 min. Electrical conductivity was then measured (C1), followed by boiling the samples for 10 min to obtain a second conductivity reading (C2). MSI was calculated according to the formula of Sairam et al., (Reference Sairam, Deshmukh and Shukla1997):
 $$MSI = \left( {1} - {{C_1}\over{C_2}} \right) \times 100$$
Relative water content (RWC), canopy temperature (TCAN), and SPAD reading
Relative water content (RWC) was determined from fresh, turgid, and dry weights of flag leaves using the equation given by Petrov et al., (Reference Petrov, Petrova, Dimitrov, Tashev, Olsovska, Brestic and Misheva2018):
 $$RWC\;\left( \% \right) = {{\left( {FW - DW} \right)}\over{\left( {TW - DW} \right)}} \times 100$$
where FW = leaf fresh weight, TW = leaf turgid weight, and DW = leaf dry weight. Fresh weight was measured immediately after sampling, turgid weight after 24–hour water immersion, and dry weight after oven–drying at 72°C till constant weight reached.
Canopy temperature (TCAN) was recorded at pre–anthesis, anthesis, and grain filling stages using a handheld infrared thermometer at a 45° angle during sunny afternoons. Ten readings per plot were recorded and averaged. Chlorophyll Meter SPAD-502Plus was used to determine SPAD reading during anthesis, grain filling and soft dough stages. Ten readings (middle of flag leaf) from each plot were recorded and then averaged.
Crop growth and yield parameters
At maturity, five plants of each cultivar were randomly selected for biometric measurements including plant height, number of grains per ear, and ear length. For 1000-grain weight, grains were counted in three replicates of 1000 seeds per cultivar and weighed. Grain yield was estimated from a net plot area of 4 m × 2.6 m harvested separately. After sun-drying and moisture determination, the final yield was adjusted to 12% (w/w) moisture content and expressed as t/ha.
Sensitivity index
Sensitivity index (SI) was calculated following the formula of Fisher and Maurer (Reference Fischer and Maurer1978). SI was computed for parameters antioxidant enzymes activities, and secondary metabolites using the following formula:

where Y = value of response variable of cultivar in a stress environment, Y P = value of response variable of cultivar in a stress–free environment (i.e. NSE), X = value of response variable of all cultivar in a stress environment, X P = value of response variable of all genotypes under stress–free environment. The results of sensitivity index are presented in Supplementary materials.
Statistical analyses
The data were subjected to analysis of variance (ANOVA) for a split–plot design using the online statistical program OPSTAT (http://14.139.232.166/opstat/). Pooled ANOVA was performed for each parameter to assess the effect of year, environment, cultivar, and their interactions. Correlation matrices were visualized using the ‘corrplot’ package in R. Principal component analysis (PCA) was performed using PAST version 3.14 (Hammer and Harper, Reference Hammer and Harper2001), and visualized variable trait vectors based on the correlation matrix. A cluster heatmap was generated using the ‘ClustVis’ online tool (BETA) available at https://biit.cs.ut.ee/clustvis/. Linear mixed regression models quantified the influence of independent variables (peroxidase, catalase, proline, phenol, and SPAD readings) on yield (dependent variable, Y) at anthesis, grain filling, and soft–dough stages, using the general regression equation:
 $$Y = a + {b_1}{X_{1}} + {b_2}{X_{2}} + \cdots + {b_n}{X_{n}}$$
where Y = dependent variable (grain yield), X1–n = independent variables, a = intercept, b 1–n = regression coefficients. Stepwise regression, with forward and backward selection, was performed using the ‘stepAIC’ function in the caret package (v6.0–94) in R (Bozdogan, Reference Bozdogan1987). GGE biplots were constructed in RStudio using the ‘Metan’ package (v1.18.0) in R (v4.3.1) following Yan and Tinker (Reference Yan and Tinker2006). To evaluate genotype performance, the mean vs. stability function was applied without scaling (scale = 0), adopting tester-centered G + GE (centering = 2), with genotype-focused singular value partitioning (SVP = 1).
Results
Crop stage–specific temperature conditions
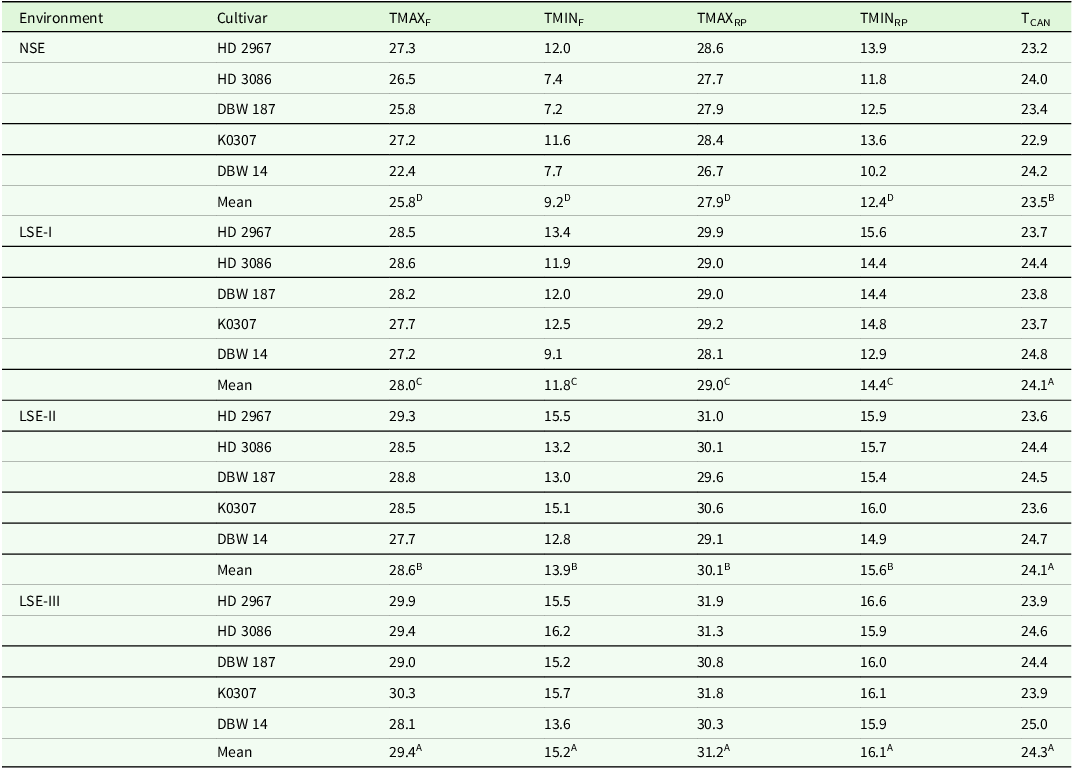
Late–sown conditions exposed the wheat crop to high–temperatures during the flowering and reproductive stages (Table 1). Compared to timely–sown crop (NSE), late–sown conditions (LSE–I to LSE–III) increased TMAXF, TMINF, TMAXRP, and TMINRP by 2.2–3.6°C, 2.6–6.0°C, 1.1–3.3°C, and 2.0–3.7°C, respectively (Table 1). Among the cultivars, DBW–14 experienced relatively lower temperatures across all environments. Notably, under late sowing, the increase in minimum temperatures (TMINF, TMINRP) was more pronounced than the rise in maximum temperatures (TMAXF, TMAXRP). Additionally, the average canopy temperature (TCAN) was significantly higher in late–sown conditions (24.1–24.3°C) compared to timely–sown condition (23.5°C) (P < 0.05) (Table 1).
Crop-stage specific ambient temperatures and canopy temperature (TCAN) as altered with wheat cultivars and late-sown induced crop-growing environments [pooled data from 2019–2020 and 2020–2021]

TMAXF, maximum ambient temperature during flowering (°C); TMINF, minimum ambient temperature during flowering (°C); TMAXRP maximum ambient temperature during reproductive period (°C); TMINRP, minimum ambient temperature during reproductive period (°C); TCAN maximum canopy temperature during flowering (°C). A–D, different uppercase superscript letters represent significant difference between the environments (p < 0.05).
Dynamics of catalase and peroxidase activities
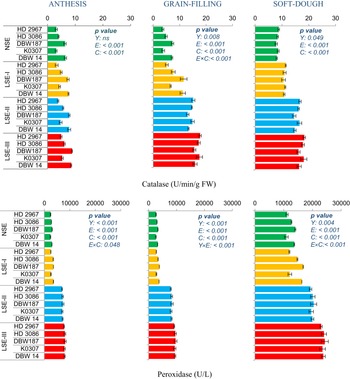
Mean catalase activity was 5.7 U/min/g FW at anthesis, increasing to 11.2 and 13.1 U/min/g FW during grain filling and soft–dough stages, respectively (Figure 2). Late–sown crops (LSE–I to LSE–III) showed 58–214% and 32–108% higher catalase activity than NSE during grain filling and soft dough stages, respectively. Cultivars varied considerably, especially at anthesis and grain filling, with DBW 187 and DBW 14 showing the highest catalase activity. However, cultivar differences at soft dough were marginal (Figure 2). Peroxidase activity was 5239, 5963, and 17630 U/L during anthesis, grain filling, and soft dough stages, respectively (Figure 2). LSE–II and LSE–III caused substantial increases compared to NSE: 162–192%, 176–220%, and 59–90% during anthesis, grain filling, and soft dough, respectively. At soft dough, crops under NSE and LSE–I also exhibited elevated peroxidase activity. Cultivar effects were generally comparable across stages, except for soft dough, where DBW 187 and DBW 14 had higher activity under NSE and LSE–I. Pooled ANOVA confirmed significant year-to-year variation in both catalase and peroxidase activities (P < 0.05) (Figure 2).
Catalase (U/min/g FW) and peroxidase (U/L) activities in the flag leaves of wheat cultivars as influenced by different crop-growing environments (pooled data from 2019–2020 and 2020–2021). Y, year; E, environment; C, cultivar. Error bars represent standard error of the mean.

Dynamics of proline and phenol
Late–sown conditions led to a significant increase in proline levels in flag leaves across all growth stages, with increments of 17–92% at anthesis, 25–118% during grain filling, and 29–131% at soft dough stage compared to NSE (Figure 3). The highest proline accumulation consistently occurred under LSE–III. Across growth stages, cultivar DBW 187 exhibited the highest proline content (33.8 μmol/g FW), exceeding the other cultivars (23.9–26.9 μmol/g FW). Late–sown conditions increased phenol content by 6–33% at anthesis, 9–43% during grain filling, and 11–52% at the soft dough stage relative to NSE (Figure 3). Cultivar differences were consistent across growth stages and environments, with DBW 187 and DBW 14 exhibiting higher phenol content (5.0–5.2 mg/g FW), while HD 2967 recorded the lowest (3.3 mg/g FW). Pooled ANOVA indicated a significant environment (E) × cultivar (C) interaction for both proline and phenol content (Figure 3).
Proline (µmol/g FW) and phenol (mg/g FW) content in the flag leaves of wheat cultivars as influenced by different crop-growing environments (pooled data from 2019–2020 and 2020–2021). Y, year; E, environment; C, cultivar. Error bars represent standard error of the mean.

Membrane stability index (MSI), SPAD reading, relative water content (RWC), and canopy growth
Different crop–growing environment had a significant influence on MSI. The highest MSI at anthesis was recorded in NSE (88.0), followed by LSE–I (84.7), whereas LSE–II (69.6) and LSE–III (66.0) showed significantly lower values (P < 0.001) (Figure 4). From anthesis to grain filling, the decline in MSI was minimal under NSE (5%) but relatively higher under late–sown conditions (7–9%). Among the genotypes, DBW 187 and K0370 maintained higher MSI (75.8–76.1), particularly under late–sown conditions, while the other cultivars ranged between 64.9 to 71.9. SPAD value ranged from 41.9 in NSE to 37.7 in LSE–III at anthesis (P < 0.001) and declined to 28.9 (NSE) and 23.2 (LSE–III) at soft dough stage (Figure 4). The decline in SPAD was most pronounced in LSE–III (38%) and least in NSE (31%). Significant cultivar variation in SPAD was evident under LSE–III, where HD 2967 recorded the highest SPAD value, while DBW 14 had the lowest. RWC followed the order NSE > LSE–I > LSE–II > LSE–III, with the greatest differences observed at the grain–filling stage (Figure 5). NSE maintained higher RWC (86.8%), whereas LSE–III recorded the lowest (75.0%). Genotypic variation in RWC was relatively marginal, with K0370 showing the highest mean RWC (82.5%) and DBW 14 the lowest (78.9%) (Figure 5).
Membrane stability index (MSI) and SPAD 502 chlorophyll meter reading in the flag leaves of wheat cultivars as influenced by different crop-growing environments (pooled data from 2019–2020 and 2020–2021). Y, year; E, environment; C, cultivar. Error bars represent standard error of the mean.

Relative water content of flag leaves and canopy area coverage (CANOPEO) of wheat cultivars as influenced by different crop-growing environments (pooled data from 2019–2020 and 2020–2021). Y, year; E, environment; C, cultivar. Error bars represent standard error of the mean.

Plant growth and yield attributing traits
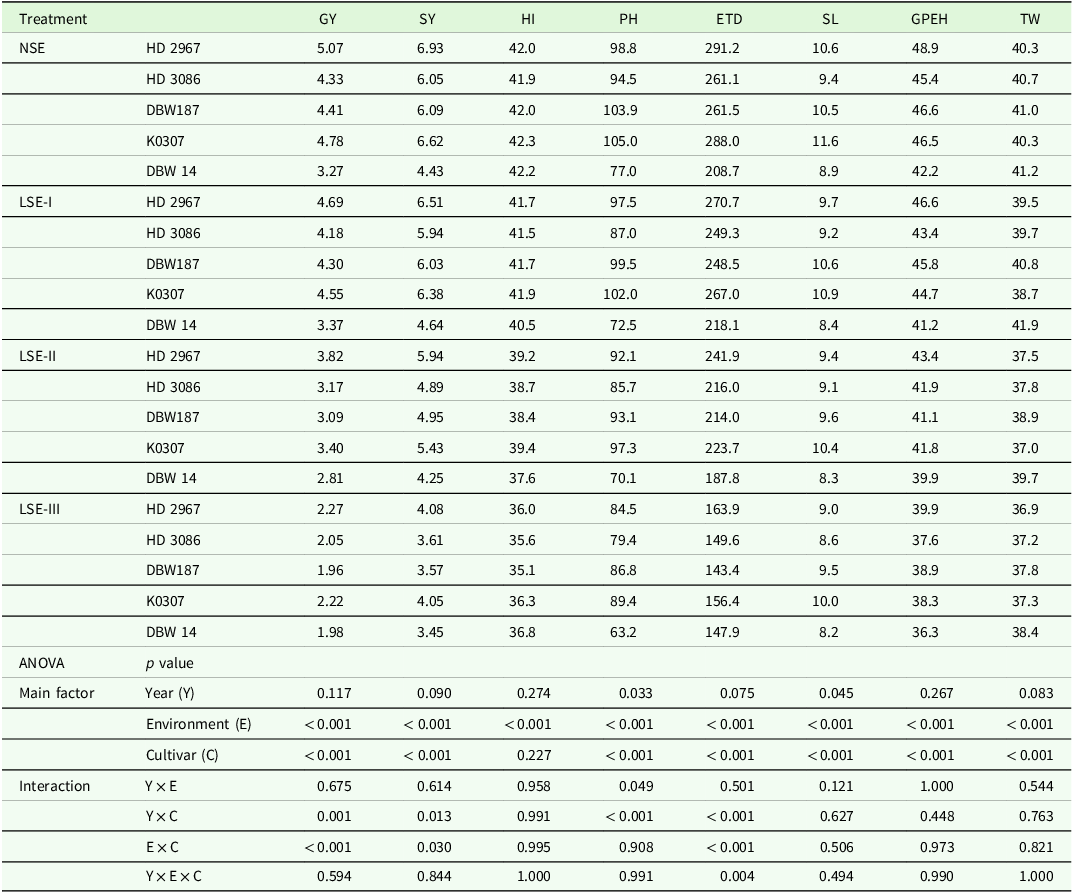
Plant yield traits – ear head density, grains per ear, ear length, 1000–grain weight, and harvest index – remained comparable between NSE and LSE–I (Table 2). In contrast, LSE–II significantly reduced plant height (17%), grains per ear (9%), ear length (8%), 1000-grain weight (6%), and harvest index (7%) relative to NSE. These reductions were more pronounced under LSE–III, at 41%, 17%, 11%, 8%, and 15%, respectively. Notably, cultivars K0370 and HD 2967 maintained higher ear head density under both LSE–II and LSE–III (P < 0.05) (Table 2). Grain yield declined substantially under LSE–II (22–29%) and LSE–III (51–53%) compared with NSE, whereas the minor reduction under LSE–I (2–5%) was statistically non-significant (P > 0.05). Across environments, HD 2967 consistently achieved the highest yield, followed by K0370, while DBW 14 recorded the lowest yield (Table 2).
Grain yield and yield attributing traits of wheat cultivars as altered with normal and late-sown crop-growing environments [pooled data from 2019–2020 and 2020–2021]

GY, grain yield (t/ha); SY, straw yield (t/ha); HI, harvest index (%); PH, plant height at 90 days (cm); ETD, effective tiller density (no./m2); SL, spike length (cm); GPEH, grains/earhead (nos.); TW, test weight (g).
Correlations and multivariate analyses
Considering the overall variability across environments, stress–induced antioxidant enzymes, biochemicals, and physiological traits exhibited significant correlations with grain yield (P < 0.05) (Figure S1) and yield losses under late–sown conditions (Figure S2). However, such associations were not very consistent within a given environment, except for phenol, which showed significant negative correlation with grain yield under NSE, LSE–I and LSE–II.
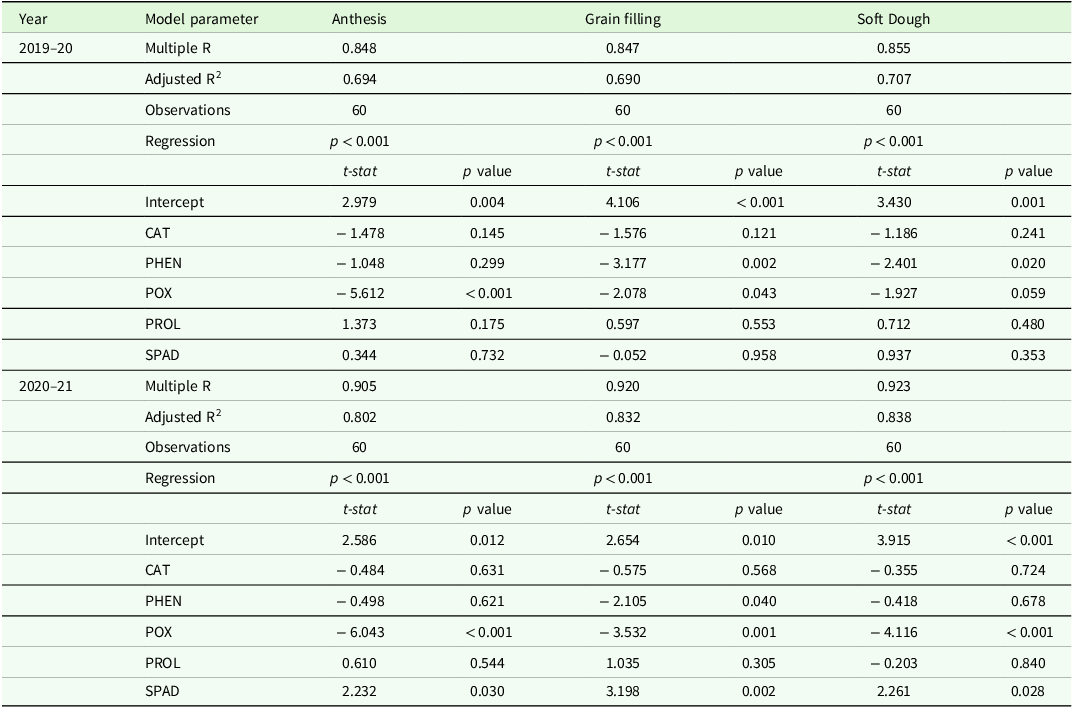
Pooled ANOVA revealed that variability in antioxidant enzymes, biochemicals, and physiological traits was primarily driven by environmental effects, except for phenol, where genotypic regulatory mechanisms played a dominant role (Table S1). When accounting for overall environmental influences, multivariate regression using antioxidant enzymes, proline, phenol, and SPAD readings as predictors of yield indicated that peroxidase activity during grain filling [POX(D)] had the strongest effect, with the highest t-statistic weight (Table 3). Phenol and catalase also showed notable contributions. Stepwise regression further highlighted significant associations of peroxidase and proline with grain yield, both showing significant t-statistic weights (Table S2).
Multivariate linear regression models (Y = a + b1X1+ b2X2 + · · · + bnXn) to explain associations of grain yield with biochemical traits

CAT, catalase (U/min/g FW), POX, peroxidase (U/L); PHEN, phenol (mg/g FW); PROL, proline (µmol/g FW); SPAD, chlorophyll meter (SPAD-502Plus) reading.
PCA results illustrate distinct clustering of environments in both years, with only marginal overlap between NSE and LSE–I (Figure 6a,b). Across years, grain yield exhibited highly positive associations with RWC at dough stage (the lowest acute angle) and higher negative associations with canopy temperature (grain filling) and soft dough stage peroxidase activity (POX[D]) in year 1 and proline (both at anthesis and grain filling) in year 2 (Figure 6a,b). Cluster analysis grouped grain yield closely with RWC, MSI, SPAD, and canopy coverage (CANO) (Figure 6c,d), whereas antioxidant enzymes and biochemical traits formed a separate cluster. GGE biplot analysis identified HD 2967 and K0307 as the high yielding stable cultivars across environments (Figure 7), further validated by AMMI analysis results (Table S3).
Principal component analysis (PCA) illustrating the associations among plant traits and crop stage–specific weather variables for the 2019–2020 (a) and 2020–2021 (b) cropping years. Panels (c) and (d) present heat map–based cluster groupings of cultivar × environment combinations derived from biochemical and physiological parameters for 2019–2020 and 2020–2021, respectively. The green, light brown, orange, and red polygons denote genotypic variability under NSE, LSE-I, LSE-II, and LSE-III environments, respectively. Trait abbreviations: GY, grain yield; CAT, catalase; POX, peroxidase; PHEN, phenol; PROL, proline; SPAD, SPAD chlorophyll meter reading; CANO, canopy coverage index; MSI, membrane stability index; RWC, relative water content; TCAN, canopy temperature. Uppercase letters in parentheses indicate the crop stage at which each trait was recorded: A = anthesis, G = grain filling, and D = soft dough.

‘Which-Won-Where/What’ (a, c) and ‘Mean vs. Stability’ (b, d) plots for five wheat cultivars evaluated across four environments during 2019–2020 (a, b) and 2020–2021 (c, d), based on genotype plus genotype-by-environment (GGE) biplot analysis.

Discussion
The study highlights that late sowing in the eastern Tarai region exposes wheat to THS during sensitive reproductive phases, resulting in physiological and yield penalties. As sowing is delayed, temperature rises become more evident, with minimum temperatures increasing more sharply than maximum temperatures. The optimal temperature ranges for wheat development at heading, anthesis, and grain filling are 16 ± 2.3°C, 23 ± 1.75°C, and 26 ± 1.53°C, respectively (Khan et al., Reference Khan, Ahmad, Ahmed and Iftikhar Hussain2021). In this study, late–sown environments (LSE–I and LSE–II) recorded substantially higher reproductive-phase temperatures compared to normal sowing environment (NSE), with increases of 2.2–3.3°C maximum (TMAXRP) and 3.2–3.7°C minimum (TMINRP) temperatures. Flowering (anthesis) temperatures ranged from 25.8°C to 29.4°C under late–sown conditions, exceeding the 25.8°C recorded in NSE. Previous reports suggest that wheat grain yield decreases by 0.07% for every 1°C increase in temperature (Nuttall et al., Reference Nuttall, Barlow, Delahunty, Christy and O’Leary2018). More broadly, each additional degree of warming during grain filling leads to a 6% reduction in global wheat yield (Lobell et al., Reference Lobell, Ortiz–Monasterio, Sibley and Sohu2013; Asseng et al., Reference Asseng, Ewert, Martre, Rötter, Lobell, Cammarano, Kimball, Ottman, Wall, White and Reynolds2015) and a 3–17% decline in South Asia, including India and Pakistan (Pask et al., Reference Pask, Joshi, Manès, Sharma, Chatrath, Singh, Sohu, Mavi, Sakuru, Kalappanavar and Mishra2014). Thus, the findings indicate that, as in other wheat-growing regions, high–temperature stress can markedly compromise crop performance in the eastern Tarai. Unlike previous studies that largely focused on the Indo-Gangetic Plains, this study offers region-specific insights into how the eastern Tarai’s unique agroclimatic conditions modulate THS responses in wheat. Delayed sowing markedly altered phenology and disrupted physiological homeostasis, thereby limiting biomass accumulation and yield potential. A moderate sowing delay of 15 days (December 5) had only minimal effects on crop performance and yield, indicating that the sowing window in this region can be safely extended to first week of December without substantial yield penalties. Beyond this period, however, wheat experienced considerable yield losses, consistent with findings from Indo–Gangetic Plains (IGP), where sowing after second week of November is associated with considerable yield reductions due to THS (Newport et al., Reference Newport, Lobell, Srivastava, Rao, Umashaanker, Malik, McDonald and Jain2020; Paudel et al., Reference Paudel, Chamberlin, Maharjan, Nguyen, Craufurd and McDonald2023; Roy et al., Reference Roy, Vashisth, Krishnan, Mukherjee, Meena, Biswakarma, Rathore, Bag and Kumari2024). Yield losses reached up to 29% under late sowing (LSE–II) and exceeded 50% under very late sowing (LSE–III), underscoring the detrimental effects of elevated temperatures during grain filling compared to the NSE. A rise of 3–4°C above optimal during grain filling can reduce wheat yields by 10–50% reduction in wheat yield across Asia under current cultivars and production practices (Hussain et al., Reference Hussain, Khaliq, Ahmad, Akhter and Asseng2018).
Our results suggest that yield limitations under delayed sowing stem from reduced biomass production, a decline in effective tiller formation, and impaired grain development, which collectively led to smaller grain size. Biomass accumulation and tiller production – particularly the number of effective tillers – were highly sensitive to THS, reflecting inefficiencies in both source and sink formation. In wheat, sink size, largely determined by ear head density and grains per ear, is more responsive to environmental stress than source activity (Farooq et al., Reference Farooq, Bramley, Palta and Siddique2011). Although 1000-grain weight varied significantly across environments in this study, the overall reduction was modest, likely because maximum temperatures during grain filling (TMAXRP < 35°C) were lower than those commonly reported from major wheat-growing regions such as the North Western Plains Zone (NWPZ). Nevertheless, the lower harvest index under late-sown conditions suggests that sink inefficiencies were primarily due to reductions in ear head density, grains per ear, and grain weight rather than limitations in total biomass. Heat stress also accelerate the accumulation of growing degree days, leading to early maturity, shortened crop duration, reduced biosynthetic activity, and ultimately poor grain development (Mondal et al., Reference Mondal, Singh, Mason, Huerta–Espino, Autrique and Joshi2016; Aslam et al., Reference Aslam, Ahmed, Stöckle, Higgins and Hayat2017; Prajapat and Saxena, Reference Prajapat and Saxena2018).
Our results highlight that key physiological parameters – RWC, SPAD, MSI, and canopy temperature regulation – were strongly impaired under late-sown, THS conditions. These traits also exhibited higher sensitivity to environmental variation, with sharper declines under LSE–II and LSE–III than under LSE–I (Table S4). Among them, RWC and MSI emerged as the strongest physiological determinants of yield. PCA further identified SPAD, RWC, and TCAN as the most influential traits associated with grain yield across environments. This pattern was corroborated through stepwise regression, which consistently retained these traits as significant predictors. In this study, DBW 187 consistently exhibited higher proline levels across environments, which aligned with improved water balance (RWC) and greater yield sustainability. Proline accumulation – regulated by proline dehydrogenase and Δ1–pyrroline–5–carboxylate synthetase/reductase – plays a critical role in stabilizing membranes and maintaining cell turgor, thereby supporting plant survival under stress (Sachdev et al., Reference Sachdev, Ansari and Ansari2023). Stepwise regression confirmed a positive association between proline and yield, consistent with earlier findings showing that temperatures of 35°C (vs. 25°C) can induce up to a 200% increase in proline, enhancing photosynthetic efficiency and yield (Gupta et al., Reference Gupta, Agarwal, Agarwal, Nathawat, Gupta and Singh2013). Cluster analysis grouped RWC, MSI, and TCAN together, reflecting their interdependence and their contribution to fundamental physiological processes, including water balance, pigment stability (SPAD), oxidative protection, and thermal regulation. These results suggest that prioritizing primary physiological traits – particularly RWC, MSI, and TCAN regulation – offers a more reliable strategy for breeding heat-resilient wheat. Previous studies have also demonstrated strong associations of RWC and MSI (Bala and Sikder, Reference Bala and Sikder2017; ElBasyoni et al., Reference ElBasyoni, Saadalla, Baenziger, Bockelman and Morsy2017; Niu and Xiang, Reference Niu and Xiang2018), SPAD (Rehman et al., Reference Rehman, Bilal, Rana, Tahir, Shah, Ayalew and Yan2016; Bhusal et al., Reference Bhusal, Sharma, Sareen and Sarial2018), and canopy indices with yield stability under heat stress. The stay-green trait, in particular, contributes to preserving photosystem II function and limiting ROS generation in wheat (Guo et al., Reference Guo, Liu, Ma, Luo, Gong and Lu2016; Abbas et al., Reference Abbas, He, Wang, Jiang, Naznin, Budhathoki, Bose, Donovan-Mak, Zhou, Li and Varshney2025). Notably, photosynthesis in wheat leaves is more sensitive to heat stress than the remobilization of stem reserves during grain filling.
Biochemical and antioxidant enzyme responses in wheat are highly sensitive to environmental stress (Sheoran et al., Reference Sheoran, Thakur, Narwal, Turan, Mamrutha, Singh, Tiwari and Sharma2015; Mohi-Ud-Din et al., Reference Mohi-Ud-Din, Siddiqui, Rohman, Jagadish, Ahmed, Hassan, Hossain and Islam2021), and our results from the Tarai region corroborate this pattern. Peroxidase, catalase, and proline increased progressively from anthesis to the dough stage, with the strongest responses recorded for peroxidase and catalase. This trend likely reflects the accumulation of H₂O₂ from the vegetative to the milky-dough stage under heat stress, which impairs photosynthesis (Kumar et al., Reference Kumar, Goswami, Sharma, Singh, Gadpayle, Singh, Pathak and Rai2013). Although both catalase and peroxidase detoxify H₂O₂, catalase activity is generally higher than that of other antioxidant enzymes in wheat (Jing et al., Reference Jing, Guo, Li and Li2020; Tripathy and Oelmüller, Reference Tripathy and Oelmuller2012). Phenolic content showed relatively small temporal changes from anthesis to the dough stage, although variations across environments and genotypes were significant. Phenolic compounds play important roles in regulating physiological functions and plant defense (Kumar et al., Reference Kumar, Chugh, Kumar, Gupta, Prasad, Kumar, Singh, Kumar, Singh, Panwar and Kumar2023; Singh et al., Reference Singh, Jyoti and Singh2024). Their antioxidant properties contribute to ROS scavenging (Tack et al., Reference Tack, Barkley and Nalley2015), and in this study, phenol content – especially during grain filling – showed a significant association with yield. However, despite increased antioxidant enzyme activity, oxidative stress was not fully mitigated, as reflected by the strong reduction in MSI under late-sown environments. PCA also indicated a negative association between antioxidant enzyme activity and MSI – except for catalase at anthesis – suggesting that environmental effects outweighed genotypic control. Environmental effects on biochemical traits also varied widely across crop stages, with the highest contributions observed for peroxidase (97%), catalase (92%), and proline (83%), while phenol showed relatively lower contributions (51%) (Table S1). This underscores the need to identify wheat genotypes with antioxidant responses that more effectively maintain MSI under heat stress. These findings suggest that although biochemical traits are strongly upregulated under THS, they function primarily as stress indicators rather than yield-protective mechanisms, and thus may not be serve critical markers for enhancing heat tolerance.
Biplot analysis revealed that all environments clustered within the same mega-environment, indicating broadly similar genotype responses – likely a consequence of the limited number of cultivars tested. Expanding the genotypic pool to include lines with contrasting trait profiles would provide deeper insights into genotype × environment interactions and help classify cultivars for specific stress environments. Finally, our results emphasize that environmental factors play a major role in trait variability, except for phenol content, which was predominantly influenced by genotypic factors.
These findings underscore the necessity of integrating physiological traits in breeding strategies to develop heat–resilient wheat cultivars. To this end, a concerted effort is required to explore broader genotypic pools and identify wheat lines with superior physiological resilience. Such strategic research can contribute to yield stability not only in the Tarai region but also in other heat–prone wheat–growing areas of India. Despite notable increases in antioxidant enzyme activities under stress, their inconsistent association with yield suggests these responses may be reactive rather than predictive markers of thermotolerance. Collectively, the results suggest that physiological traits – especially RWC, MSI, and SPAD – serve as robust indicators of heat resilience in wheat. While antioxidant enzyme activity and osmolyte accumulation represent adaptive responses, their limited correlation with yield underlines the need to prioritize functional traits over biochemical markers for breeding heat-tolerant cultivars.
Conclusion
This study shows that in the Tarai region of eastern India, late sowing exposes wheat to elevated temperatures during reproductive stages, adversely affecting physiology, biochemistry, and yield. Sowing up to early December was relatively safe, whereas further delays caused 29–50% yield losses along with significant reductions in grains per ear, ear length, and 1000-grain weight. Physiological traits – particularly relative water content (RWC), membrane stability index (MSI), and SPAD – were strongly affected by terminal heat stress and emerged as robust indicators of thermotolerance. Although proline, phenols, and antioxidant enzyme activities increased under late sowing, they were insufficient to maintain yield stability. Overall, timely sowing and the use of heat-tolerant cultivars such as HD 2967 and K 0370 are critical for sustaining wheat productivity under rising temperatures in the Tarai region.
Supplementary material
To view supplementary material for this article, please visit https://doi.org/10.1017/S0021859626100513
Acknowledgements
Authors thankfully acknowledge Uttar Bangla Krishi Viswavidyalaya, Cooch Behar (W.B.) for providing all necessary facilities to successfully conduct the trial.
Author contributions
ARC and BM conceived and designed the study. ARC and BM conducted data gathering. KKH, ARC and BP performed statistical analyses. ARC, KKH, BM wrote the original draft. ARC, BM, PD, KB performed methods and formal analysis. BM and KB provided required resources for the experiment. All authors reviewed and edited the article.
Funding statement
The research was funded by Uttar Bangla Krishi Viswavidyalaya, Cooch Behar (W.B.) as part of the partial fulfilment of the first author’s Ph.D. program.
Competing interests
The authors declare there are no conflicts of interest.
Ethical standards
Not applicable