



1 Introduction
The breaking of ocean waves significantly enhances the exchange processes occurring at the air–water interface. In terms of mechanical aspects the breaking increases the mixing in the upper ocean layer, is the main mechanism for the dissipation of the wave energy (Babanin Reference Babanin2011) and is responsible for the generation of a surface current (Phillips Reference Phillips1977). The above aspects were widely investigated experimentally by Rapp & Melville (Reference Rapp and Melville1990) whereas Melville, Veron & White (Reference Melville, Veron and White2002) used a digital particle image velocimetry technique to characterize the coherent vortex structure induced by the breaking. More recently, a theoretical model for the breaking induced circulation was proposed in Pizzo & Melville (Reference Pizzo and Melville2013) who also derived a simplified relation between the induced circulation and the energy dissipation rate. By following a similar approach, in Pizzo, Deike & Melville (Reference Pizzo, Deike and Melville2016) a simplified model for the energy transfer operated by the breaking from the wave field to the mean flows was proposed and compared to numerical and experimental data. It was shown that only a small amount of the dissipated energy contributes to the surface current, the rest going into local turbulence and mixing.
On the air side, the sharp curvature of the breaking crests has a significant influence on the separation of the air flow. In the case of wind generated waves the flow separation is towards the forward face of the wave and increases the momentum transfer from air to water operated by the normal stresses at the free surface (Reul, Branger & Giovanangeli Reference Reul, Branger and Giovanangeli1999, Reference Reul, Branger and Giovanangeli2008; Buckley & Veron Reference Buckley and Veron2016). When breaking occurs without following wind, flow separation is on the opposite side. The phenomenon was discovered numerically in Iafrati, Babanin & Onorato (Reference Iafrati, Babanin and Onorato2013, Reference Iafrati, Babanin and Onorato2014), but experimental evidence of the flow separation at the crest in the case of breaking occurring without following wind was already provided by Techet & McDonald (Reference Techet and McDonald2005). In Iafrati et al. (Reference Iafrati, Babanin and Onorato2013, Reference Iafrati, Babanin and Onorato2014) a two-dimensional, two-fluid, Navier–Stokes model was used to simulate the breaking induced by the modulational instability. It was shown that upward propagating vorticity structures are generated as a consequence of the flow separation from the back of the breaking crest. The interaction of the primary structures with the free surface leads to the formation of secondary structures, and thus to upwards propagating dipoles that significantly enhances the vertical transport. Although some aspects of the turbulence dynamics are expected to be strongly affected by the two-dimensional assumption and the consequent inverse cascade of the turbulence, the basic mechanisms leading to the vorticity generation in air as a result of the breaking agree well with the experimental observations in Techet & McDonald (Reference Techet and McDonald2005).
The relevance of the wave breaking process is not limited to mechanical considerations. The entrainment of air bubbles and the ejection of droplets, beside enhancing the energy dissipation and influencing the features of turbulence (Lamarre & Melville Reference Lamarre and Melville1991; Agrawal et al. Reference Agrawal, Terray, Donelan, Hwang, Williams, Drennan, Kaham and Krtaigorodskii1992), broaden the air–water interface which, in combination with the strong turbulent flow, provide a significant increase in the exchange processes of heat, gas and chemicals (Hwang Reference Hwang2009; Wanninkhof et al. Reference Wanninkhof, Asher, Ho, Sweeny and McGillis2009; Veron Reference Veron2015), eventually affecting the climate (Cavaleri, Fox-Kemper & Hemer Reference Cavaleri, Fox-Kemper and Hemer2012).
One of the most interesting aspects for the applications is the energy dissipation or, more specifically, the dissipation rate (Perlin, Choi & Tian Reference Perlin, Choi and Tian2013). The dissipation rate associated with the wave breaking is used in large scale forecasting models to account for the enhanced dissipation of wave energy (Janssen Reference Janssen2009) and data are needed for its parameterization. At present, models are largely heuristic and are generally tuned to fit the recorded data (Cavaleri Reference Cavaleri2006).
A spectral dissipation model for the breaking was proposed by Phillips (Reference Phillips1985). The model is based on the energy dissipation rate per unit length of the breaking front, which was estimated by Duncan (Reference Duncan1981) in the form
 $\unicode[STIX]{x1D716}_{l}=b\unicode[STIX]{x1D70C}_{w}(c^{5}/g)$
where
 $\unicode[STIX]{x1D70C}_{w}$
is the water density,
 $c$
is the velocity of the breaking front,
 $g$
is the gravitational acceleration and
 $b$
is a constant. Hence, the averaged energy dissipation rate per unit area of the ocean surface for the breakers propagating with speeds in the range (
 $c,c+\text{d}c$
) was expressed by Phillips (Reference Phillips1985) in the form
 $$\begin{eqnarray}\unicode[STIX]{x1D716}(c)\,\text{d}c=b\unicode[STIX]{x1D70C}_{w}(c^{5}/g)\unicode[STIX]{x1D6EC}(c)\,\text{d}c,\end{eqnarray}$$
where
 $\unicode[STIX]{x1D6EC}(c)\,\text{d}c$
represents the average total length, per unit area of the ocean surface, of the breaking fronts with propagation speed in the range
 $c$
to
 $c+\text{d}c$
.
Earlier experimental measurements showed a very large variation of the parameter
 $b$
. Through dimensional considerations, Melville (Reference Melville1994) observed that the dissipation rate is not just a constant but it should depend on the slope. Such a dependence was investigated in Drazen, Melville & Lenain (Reference Drazen, Melville and Lenain2008). Through inertial scaling arguments and using the data of laboratory experiments they proposed
 $b\propto S^{2.77}$
,
 $S$
being the maximum wave slope. It is worth noticing that such a relation would predict a non-zero energy dissipation rate even for waves with small slopes that do not break. A more complete expression for the spectral dissipation rate which is valid from incipient to plunging breaking was derived in Romero, Melville & Kleiss (Reference Romero, Melville and Kleiss2012) who proposed
 $b$
in the form
 $b=a(S-S_{0})^{n}$
,
 $S_{0}$
being the threshold slope for breaking. The coefficients were derived by field experiments and the exponent was found to be in the range
 $2.5<n<3$
, which is consistent with the laboratory estimates provided in Drazen et al. (Reference Drazen, Melville and Lenain2008). The model proposed in Romero et al. (Reference Romero, Melville and Kleiss2012) was used by Sutherland & Melville (Reference Sutherland and Melville2013) to estimate the energy dissipation and stress based on accurate field measurements of the breaker length distribution
 $\unicode[STIX]{x1D6EC}(c)$
extended to velocities near the gravity–capillary transition.
In-depth studies on wave breaking were initiated in the early eighties with the works done by Duncan (Reference Duncan1981, Reference Duncan1983) for a quasi-steady breaker behind a towed hydrofoil. A dissipation model was proposed, which set the base for the development of dissipation models based on the whitecaps coverage (Phillips Reference Phillips1985; Phillips, Posner & Hansen Reference Phillips, Posner and Hansen2001). The analysis of unsteady breaking processes started later with the experimental activities done by Bonmarin (Reference Bonmarin1989). A more extensive and quantitative study of the unsteady breaking generated by the dispersive focusing technique was performed by Rapp & Melville (Reference Rapp and Melville1990). They found that, depending on the wave steepness, the breaking dissipates between 10 and 25 % of the initial energy content, and more than 90 % of that energy amount is dissipated within four wave periods from the onset of the breaking. It was also shown that the breaking leads to the formation of a surface current which can be up to 3 % of the phase speed. Particle image velocimetry (PIV) measurements of the velocity and vorticity fields under breaking waves and the advection velocity of the coherent structure in the wave propagation direction were conducted in Melville et al. (Reference Melville, Veron and White2002). A similar analysis was done by Drazen & Melville (Reference Drazen and Melville2009) who used a higher resolution and computed the turbulent wavenumber spectra as well. However, due to technical limitations related to the light reflected by the bubbles, data are available starting from approximately three wave periods after the onset of the breaking, and thus flow data for the phase during which most of the energy is dissipated are missing.
The above impediments can be overcome, at least partly, thanks to the remarkable progress of computational methods for the solution of the Navier–Stokes equations for two-phase flows. A first example was provided by Chen et al. (Reference Chen, Kharif, Zaleski and Li1999) who studied the evolution to breaking of an artificially steep third-order Stokes wave in a periodic two-dimensional domain. Due to the numerical complexities in deriving the solution for high density ratios, the air/water density ratio was increased to the milder value of
 $1/100$
. The plunging of the jet, the subsequent entrainment of air bubbles and the generation of vorticity were observed and discussed. The kinetic and potential energy components were computed and it was shown that during the breaking phase the equipartition of the energy is no longer valid due to the kinetic energy accumulated in the vortical structures generated by the plunging jet. A similar problem, but with the correct air/water density ratio, was investigated by Lubin et al. (Reference Lubin, Vincent, Abadie and Caltagirone2006). The numerical investigation of the breaking of a steep wave in a periodic domain continued in Iafrati (Reference Iafrati2009) who analysed the effects of the initial steepness. The study covered the transition from the spilling to plunging breaking type and presented detailed analyses of the vertical transfer of horizontal momentum and resulting surface current, of the energy dissipation, of the air entrainment and degassing processes and of the induced circulation. A discussion on the different dissipation mechanisms that characterize spilling and plunging breaking events was provided in Iafrati (Reference Iafrati2011), where the role played by the air entrainment was clearly highlighted. More recently, a parametric study in terms of the Bond number and initial steepness was carried out in Deike, Popinet & Melville (Reference Deike, Popinet and Melville2015) and the capillary effects on the wave breaking were carefully analysed. The wave breaking of a steep wave in a periodic domain was simulated by Lubin & Glockner (Reference Lubin and Glockner2015), Deike, Melville & Popinet (Reference Deike, Melville and Popinet2016) and Wang, Yand & Stern (Reference Wang, Yand and Stern2016) to investigate three-dimensional aspects of the flow, of the air entrainment process and of the bubble fragmentation process.
The use of the artificially steep, third-order Stokes wave has the notable advantage that the breaking begins within one wave period after the simulation starts and, furthermore, the periodicity of the boundary conditions allows us to concentrate the grid points, and therefore the computational effort, in the most interesting region. Although this approach resembles what happens when the breaking is generated by a linear superposition approach, it is highly influenced by the initial conditions. Moreover, the one-wavelength periodicity implies that all wave crests are in breaking conditions. Besides being rather unrealistic, it induces a strong interaction between the breaking events occurring at adjacent crests.
In order to avoid the above limitations, Derakthi & Kirby (Reference Derakthi and Kirby2014) reproduced numerically the experimental conditions used by Rapp & Melville (Reference Rapp and Melville1990) and Lamarre & Melville (Reference Lamarre and Melville1991). It is worth noticing that they used a three-dimensional large eddy simulation flow solver but did not account for the flow in the air phase. A Eulerian–Eulerian formulation for a polydisperse bubble was employed, which allowed them to describe the liquid–bubble interaction. The study continued in Derakthi & Kirby (Reference Derakthi and Kirby2016) where the total energy loss and momentum flux are investigated.
The results in Rapp & Melville (Reference Rapp and Melville1990) indicate that when the breaking is induced via the dispersive focusing, the dissipated energy fraction exhibits a rather clear dependence on the steepness. The energy fraction dissipated by the breaking grows quite rapidly with the steepness as the breaking changes from spilling to plunging, and remains essentially constant afterwards. Similar conclusions were drawn by Iafrati (Reference Iafrati2009) for the steep wave in a periodic domain. In open ocean the breaking is more likely induced by the nonlinear interaction and the modulational instability. Moreover, the wave breaks as soon as some threshold criterion is exceeded (Perlin et al. Reference Perlin, Choi and Tian2013) and that limits the maximum steepness (Toffoli et al. Reference Toffoli, Babanin, Onorato and Waseda2010). Experimental measurements presented in Galchenko et al. (Reference Galchenko, Babanin, Chalikov and Young2010) show that the dissipated energy fraction, or the severity coefficient as it is defined therein, exhibits a much larger variation with the characteristics of the spectrum and, furthermore, the data are affected by a quite large scatter.
Benjamin & Feir (Reference Benjamin and Feir1967) showed theoretically that a periodic progressive wave train with fundamental frequency
 $\unicode[STIX]{x1D714}$
may become unstable if perturbed by sideband frequencies
 $\unicode[STIX]{x1D714}(1\pm \unicode[STIX]{x1D6FF})$
. The exponential growth of the sidebands and the changes to the spectrum were observed experimentally in Lake et al. (Reference Lake, Yuen, Rungaldier and Ferguson1977). A more careful study on the spectrum changes and on the evolution to breaking of nonlinear wave trains was performed in Melville (Reference Melville1982, Reference Melville1983). It was found that for
 $ak\leqslant 0.29$
–
 $a$
and
 $k$
denoting the wave amplitude and wavenumber, respectively – the evolution is sensibly two-dimensional and the breaking is induced by the Benjamin–Feir mechanism, whereas for initial steepness
 $ak\geqslant 0.31$
the full three-dimensional instability is the dominant mechanism. Similar conclusions were derived analytically by McLean (Reference McLean1982).
The study of the breaking induced by modulational instability is rather challenging as long physical times and distances are required for the development of the instability and often the limited length of the tank does not allow the entire process to be described (Melville Reference Melville1982; Ma et al. Reference Ma, Dong, Perlin, Ma and Wang2012). Furthermore, as discussed later on, in the case of modulational instability, the breaking is recurrent with a period which is twice the period of fundamental component (Donelan, Longuet-Higgins & Turner Reference Donelan, Longuet-Higgins and Turner1972) and several events are needed before the breaking definitively ceases.
In order to facilitate the onset of the Benjamin–Feir instability and to shorten the distance needed for the development, in Tulin & Waseda (Reference Tulin and Waseda1999) the sideband disturbances were imposed at the wave generator. It was observed that the maximum wave amplitude undergoes a significant amplification and, if some threshold condition is exceeded, the wave breaks. The limiting conditions for breaking are provided in terms of the initial steepness
 $\unicode[STIX]{x1D700}_{0}$
and of the modulational frequency ratio
 $\unicode[STIX]{x1D6FF}=\unicode[STIX]{x0394}\unicode[STIX]{x1D714}/\unicode[STIX]{x1D714}$
. It is shown that, due to the modulational instability, the energy content is transferred from the fundamental component to the sidebands. As long as the wave group remains regular, Fermi–Pasta–Ulam recurrence is observed (Yuen & Ferguson Reference Yuen and Ferguson1978), whereas in the case that breaking occurs the energy transfer from the fundamental to the lower sideband is irreversible. Of course the viscous dissipation may have an effect on the recurrence, as it was recently observed in Kimmoun et al. (Reference Kimmoun, Hsu, Branger, Li, Chen, Kharif, Onorato, Kelleher, Kibler, Akhmediev and Chabchoub2016). The effects of the viscous dissipation on the initial development of the Benjamin–Feir instability was investigated experimentally by Ma et al. (Reference Ma, Dong, Perlin, Ma and Wang2012). They showed that the growth rates of the sidebands may be affected by the dissipation, in particular for high perturbation frequency. However, due to the limits in the tank length, the waves did not reach the breaking conditions.
On the numerical side, the modulational instability was investigated first by Dold & Peregrine (Reference Dold and Peregrine1985, Reference Dold and Peregrine1986) through a fully nonlinear potential flow model. Similar studies were performed by Dommermuth & Yue (Reference Dommermuth and Yue1988) and Landrini et al. (Reference Landrini, Oshiri, Waseda and Tulin1998). Although the limiting conditions leading to the breaking were identified, the adopted model did not allow these authors to go beyond it. Up to the authors knowledge, the only two-fluid numerical simulations of the breaking generated via modulational instability were presented in Iafrati et al. (Reference Iafrati, Babanin and Onorato2013, Reference Iafrati, Babanin and Onorato2014). In order to reduce the computational effort, a combined numerical approach was developed which allowed them to use a fully nonlinear potential flow model to describe the development of the instability up to the onset of the breaking. Next, the potential flow solution was used as initial condition for a two-fluid Navier–Stokes solver. The evolution of modulated wave groups with a fundamental wavelength of 0.6 m and
 $\unicode[STIX]{x0394}k/k_{0}=1/5$
was simulated for an initial steepness in the range
 $\unicode[STIX]{x1D700}_{0}=(0.10,0.18)$
and breaking conditions were found for
 $\unicode[STIX]{x1D700}_{0}\geqslant 0.12$
(Iafrati, Onorato & Babanin Reference Iafrati, Onorato and Babanin2012), consistent with the breaking transition observed in Landrini et al. (Reference Landrini, Oshiri, Waseda and Tulin1998) and Tulin & Waseda (Reference Tulin and Waseda1999). The results show that the breaking is recurrent, with a period approximately twice the period of the fundamental component, each event lasting only a short fraction of the wave period and dissipating a limited percentage of the pre-breaking energy content.
The recurrence of breaking in modulated wave groups was observed in the field by Donelan et al. (Reference Donelan, Longuet-Higgins and Turner1972) and Lamont-Smith, Fuchs & Tulin (Reference Lamont-Smith, Fuchs and Tulin2003). A clear explanation of the phenomenon is given in Donelan et al. (Reference Donelan, Longuet-Higgins and Turner1972) and it is briefly recalled in the following. When a modulated wave group propagates in deep water, the height of the wave crests vary in time as they follow the envelope of the group. The envelope propagates with the group velocity
 $c_{g}$
, whereas the waves propagate with the phase speed
 $c_{p}$
. As the group velocity is half the phase velocity, the passage of a wave crest beneath the peak of the envelope occurs every
 $2T_{p}$
,
 $T_{p}$
being the period of the fundamental component. If the group is such that the conditions for the development of the Benjamin–Feir instability occur, an energy transfer from the fundamental component to the sidebands takes place, leading to an increase in the height of the peak of the envelope. If the height of the peak exceeds a certain threshold, the wave breaks and this makes the transfer process irreversible. The breaking starts when the wave crest approaches the peak of the envelope and ceases shortly after the wave crest leaves it (figure 6). Since the wave breaks as soon as the limiting conditions are exceeded, the first breaking event is generally mild. However, the peak of the envelope keeps growing due to the modulational instability and thus, when the next wave approaches the peak of the envelope, the steepness is higher than in the previous passage and the breaking is stronger. Breaking events continue until the maximum steepness is reduced due to two combined effects: (i) the reduction of the wave amplitude due to the energy dissipation; (ii) the increase in the wavelength associated with the frequency down-shift. Concerning the first point, it can be noted that the amplitude of the envelope is also reduced as a consequence of the breaking; the wave steepness, however, can be more easily monitored during the flow evolution and it is the parameter considered in this study.
Due to the recurrence of the breaking, the time history of the total energy is characterized by sharp drops, concurrent with the breaking events, followed by a phase during which the dissipation is that associated with the wave orbital motion and the vorticity remnants of previous events (Iafrati et al. Reference Iafrati, Babanin and Onorato2014). The phenomenon is substantially different from the wave breaking generated by dispersive focusing, where the breaking happens as a single event and all the dissipation takes place within three to four wave periods. In this sense, the authors believe that the breaking generated through the modulational instability is somewhat more representative of the phenomena occurring in the open ocean (Babanin Reference Babanin2011). Indeed, it would be also possible to reproduce one of the recurrent breaking events through the dispersive focusing. However, the important role played by the evolution of the wave group would be lost (Donelan et al. Reference Donelan, Longuet-Higgins and Turner1972).
The analysis presented by Iafrati et al. (Reference Iafrati, Babanin and Onorato2014) is incomplete as it does not explain which are the conditions that lead the breaking to finally cease and, furthermore, does not provide any data concerning the energy dissipated by the whole breaking process. The present paper aims at extending the previous work by covering a much longer physical time, going well beyond the end of the breaking process. Differently from what was done in Iafrati et al. (Reference Iafrati, Babanin and Onorato2014), here the two-fluid Navier–Stokes solver is employed from the very beginning, thus avoiding any spurious effect related to the initialization of the velocity field starting from the potential flow solution. In order to shorten the time needed to reach the breaking, thus reducing the computational effort, higher initial steepnesses are considered here.
Simulations are conducted with the open source Gerris software which solves the incompressible Navier–Stokes equation for a single fluid with variable physical properties. The solver uses a volume-of-fluid approach to capture the interface dynamics and has an adaptive refinement based on a quad-octree discretization. Density, viscosity and surface tension are set to their physical values for air and water and the fundamental wavelength is
 $60$
cm. In all simulations the flow is assumed to be two-dimensional.
The two-dimensionality assumption is indeed rather strong but it is essential to limit the computational effort and make simulations feasible. Even though the periodicity conditions are still applied at the sides, in this case the computational domain spans over the entire group at least, which is five times the fundamental wavelength for the conditions adopted here. Moreover, as already explained, in order to describe the development of the instability, the entire breaking process and a sufficiently long post-breaking phase, simulation times are of the order of forty wave periods, an order of magnitude longer than the time needed for the breaking of the steep wave addressed in Iafrati (Reference Iafrati2009), Deike et al. (Reference Deike, Popinet and Melville2015, Reference Deike, Melville and Popinet2016), Lubin & Glockner (Reference Lubin and Glockner2015), Wang et al. (Reference Wang, Yand and Stern2016).
Of course, the two-dimensionality assumption has an influence on the turbulent flow induced by the breaking and thus on the related dissipation processes. Three-dimensional effects are even more important for all the aspects related to the air entrainment and to the bubble fragmentation process, as observed numerically by Lubin & Glockner (Reference Lubin and Glockner2015), Deike et al. (Reference Deike, Melville and Popinet2016), Wang et al. (Reference Wang, Yand and Stern2016) and experimentally by Deane & Stokes (Reference Deane and Stokes2002). As shown in Iafrati (Reference Iafrati2011), which is still a two-dimensional study, the bubble fragmentation generates large velocity gradients that significantly enhance the dissipation at small scales.
Nonetheless, in spite of the limits of the two-dimensionality assumption, for some unknown reason, comparisons with three-dimensional solutions show that there are no significant differences in terms of dissipated energy since the dissipation rates of the two-dimensional flow fluctuate around the values of the three-dimensional counterpart and the time evolution of the energy is on average very similar. The strong similarities between the two- and three-dimensional solutions in terms of energy dissipation are shown in figure 1. These simulations, performed in the present study, refer to the breaking of a third-order Stokes wave with initial steepness
 $\unicode[STIX]{x1D700}=0.40$
in a periodic domain, similarly to what was reported in Iafrati (Reference Iafrati2009) and Deike et al. (Reference Deike, Popinet and Melville2015). As soon as the breaking starts, instabilities in the third direction develop and break the cylindrical structure of the air cavity characterizing the two-dimensional solution. Although a full three-dimensional air–water interface is formed, as clearly shown in figure 1(a), no significant changes are found in terms of the energy dissipation (figure 1
b).
Results (from this study) of the two-dimensional (2-D) and 3-D simulations of the breaking of the third-order Stokes wave in a periodic domain.
 $t^{\ast }=t/T_{p}$
is the non-dimensional time,
 $T_{p}=\sqrt{2\unicode[STIX]{x03C0}\unicode[STIX]{x1D706}/g}$
being the wave period. (a) Air–water surface at
 $t^{\ast }$
= 1.25. (b) Comparison of the energy dissipation for 2-D and 3-D simulations.

It is worth noticing that similar conclusions were derived in Lubin et al. (Reference Lubin, Vincent, Abadie and Caltagirone2006) where it is shown that, in terms of the total energy dissipation associated with the breaking, the difference is approximately 5 % during the breaking process and may reach 10 % in the late stage. Analogously, Deike et al. (Reference Deike, Melville and Popinet2016), who used the same Gerris code employed here, found that the total dissipation due to the breaking in the three-dimensional simulations is essentially the same as the two-dimensional ones provided in Deike et al. (Reference Deike, Popinet and Melville2015). Similar results were also found by Derakthi & Kirby (Reference Derakthi and Kirby2014) and Derakthi & Kirby (Reference Derakthi and Kirby2016).
The similarity in the energy dissipation observed in two and three dimensions is indeed non-trivial and interesting, although difficult to justify. A possible explanation, which is only a speculation at the moment, is that there exists an upper bound on the amount of energy that can be carried by the wave. The upper bound depends on the spectrum and on the way the breaking is approached. When such a limit is exceeded, the wave breaks and dissipates the energy excess. Hence, the amount of energy dissipated is the same in two and three dimensions, as it only depends on the initial wave energy content and on the maximum energy that can be carried by the wave, whereas the differences between the two- and three-dimensional cases are only in the mechanisms which act to dissipate such energy excess.
The present study is mainly focussed at investigating kinematic and energy aspects in the case of breaking induced by the modulational instability through a two-fluid numerical approach, which has never been done before. In a modulated wave train, the energy transfer from the fundamental wavelength to the sidebands is a slow process that requires many wave periods to reach the breaking point. Moreover, as already mentioned, the breaking itself is recursive and extends over several wave periods, which further increases the time duration of the full event. For this reason, simulations of the complete evolution of a modulated wave train are computationally very demanding. Additionally, in order to reduce the role played by surface tension on the breaking (see for example Tulin (Reference Tulin, Grue, Gjevik and Weber1996) and Duncan (Reference Duncan2001)) it is important to explore the regime of ‘large’ wavelengths and, in the present study, the value
 $\unicode[STIX]{x1D706}=60$
cm is used as a compromise between long enough waves and feasible simulations. Finally all the flow scales, from the largest wavelength down to the smallest droplets and bubbles produced during the breaking process, have to be resolved thus making the simulation further challenging. Within this scenario full three-dimensional simulations become exceedingly expensive and the only reasonable approach is to resort to highly resolved two-dimensional studies. Of course the use of the two-dimensionality approximation does not allow us to correctly describe all the small scale dissipation processes as well as the bubble fragmentation. Nevertheless, as already discussed, such limitations do not preclude the possibility of achieving reasonably accurate estimates of the energy dissipation.
The paper is structured as follows: in § 2 the numerical method and the computational set-up are described along with a grid convergence study. In § 3 the surface kinematics and its spectrum evolution are analysed showing that at the end of the breaking process the lower sideband reaches an amplitude of approximately 80 % of the initial fundamental component. In § 4 the energy dissipation associated with the breaking process is evaluated. It is found that the whole breaking process dissipates approximately 20–25 % of the pre-breaking energy and that the breaking process lasts approximately eight wave periods. By singling out the energy associated with each wave of the system it is found that the energy content of the most energetic wave decays as
 $t^{-1}$
while the energy of all the other waves in the group remains almost constant. Finally, the dissipation rates associated with each breaking event are evaluated and compared with results from the literature.
2 Numerical set-up
2.1 The numerical model
Numerical simulations are carried out by using the open source flow solver Gerris. The air–water interface is captured by a volume-of-fluid (VOF) approach. The volume fraction of one fluid in the other,
 ${\mathcal{F}}(\boldsymbol{x},t)$
, is advected with the flow as:
 $$\begin{eqnarray}\frac{\unicode[STIX]{x2202}{\mathcal{F}}}{\unicode[STIX]{x2202}t}+\boldsymbol{u}\boldsymbol{\cdot }\unicode[STIX]{x1D735}{\mathcal{F}}=0.\end{eqnarray}$$
The local density
 $\unicode[STIX]{x1D70C}$
and viscosity
 $\unicode[STIX]{x1D707}$
are expressed as the weighted averages
 $$\begin{eqnarray}\unicode[STIX]{x1D70C}\left({\mathcal{F}}\right)=\unicode[STIX]{x1D70C}_{a}{\mathcal{F}}+\unicode[STIX]{x1D70C}_{w}\left(1-{\mathcal{F}}\right),\quad \unicode[STIX]{x1D707}\left({\mathcal{F}}\right)=\unicode[STIX]{x1D707}_{a}{\mathcal{F}}+\unicode[STIX]{x1D707}_{w}\left(1-{\mathcal{F}}\right)\end{eqnarray}$$
of the corresponding values in air and water, denoted by the subscripts
 $a$
and
 $w$
, respectively.
The fluid is assumed to be incompressible and governed by the Navier–Stokes equations
 $$\begin{eqnarray}\left.\begin{array}{@{}c@{}}\displaystyle \unicode[STIX]{x1D735}\boldsymbol{u}=0,\\ \displaystyle \unicode[STIX]{x1D70C}\left({\mathcal{F}}\right)\frac{\text{D}\boldsymbol{u}}{\text{D}t}=-\unicode[STIX]{x1D735}p+\unicode[STIX]{x1D70C}\left({\mathcal{F}}\right)\boldsymbol{f}+\unicode[STIX]{x1D707}({\mathcal{F}})\unicode[STIX]{x1D6FB}^{2}\boldsymbol{u}+\unicode[STIX]{x1D70E}k\unicode[STIX]{x1D6FF}_{s}\boldsymbol{n},\end{array}\right\}\end{eqnarray}$$
where
 $\boldsymbol{u}=(u,v)$
is the fluid velocity,
 $p$
the pressure and
 $\boldsymbol{f}$
the volume forces (i.e. the gravitational force,
 $\boldsymbol{f}=(0,-g\hat{\boldsymbol{y}})$
). The surface tension term depends on the surface tension coefficient
 $\unicode[STIX]{x1D6FE}$
and on the local curvature
 $k$
. The surface tension force is directed along the normal
 $\boldsymbol{n}$
to the interface and is distributed across the interface by a Dirac function
 $\unicode[STIX]{x1D6FF}_{s}$
. The equations are discretized and solved on a computational grid with a quad-tree adaptive spatial discretization and a multi-level Poisson solver. Additional details on the numerical model can be found in Popinet (Reference Popinet2003, Reference Popinet2009). The Gerris numerical solver has been widely validated in several multi-phase flow problems and in wave breaking flows (e.g. Deike et al.
Reference Deike, Popinet and Melville2015, Reference Deike, Melville and Popinet2016).
2.2 The physical problem
The wave breaking is induced through the classical Benjamin–Feir instability mechanism. In Benjamin & Feir (Reference Benjamin and Feir1967) it was observed that a progressive wave with fundamental frequency
 $\unicode[STIX]{x1D714}$
is unstable if perturbed by adjacent sidebands at frequencies
 $\unicode[STIX]{x1D714}(1\pm \unicode[STIX]{x1D6FF})$
, provided
 $0<\unicode[STIX]{x1D6FF}\leqslant \sqrt{2}ka$
,
 $k$
and
 $a$
being the wavenumber and the amplitude of the perturbed wave train, respectively. In such conditions, the amplitude
 $a_{i}$
of the sideband components grows exponentially as:
 $$\begin{eqnarray}a_{i}\sim \exp \left[{\textstyle \frac{1}{2}}\unicode[STIX]{x1D6FF}(2\unicode[STIX]{x1D700}_{0}^{2}-\unicode[STIX]{x1D6FF}^{2})^{1/2}\unicode[STIX]{x1D714}t\right],\end{eqnarray}$$
where
 $\unicode[STIX]{x1D700}_{0}=k_{0}A_{0}$
is the initial steepness of the fundamental, with
 $A_{0}$
its amplitude.
As discussed in Tulin & Waseda (Reference Tulin and Waseda1999), the modulation instability can develop as a result of background noise and a natural selection of the most unstable perturbations (un-seeded conditions) but it may take a long time to grow and, furthermore, it cannot be properly controlled. Another approach, which is also used in laboratory, is to impose the perturbation on the initial conditions or at the wave generator controlling both frequencies and amplitudes (seeded conditions). The latter approach is used here: the free-surface elevation
 $\unicode[STIX]{x1D702}(x,t)$
at time
 $t=0$
is initialized as the combination of a fundamental sinusoidal component and two sidebands:
 $$\begin{eqnarray}\unicode[STIX]{x1D702}(x,0)=A_{0}\cos (k_{0}x)+A_{1}\cos (k^{+}x)+A_{1}\cos (k^{-}x),\end{eqnarray}$$
where
 $x$
is the horizontal coordinate. In the above equation
 $A_{0}$
and
 $k_{0}$
are the amplitude and wavenumber of the fundamental component, whereas
 $A_{1}=0.1A_{0}$
and
 $k^{\pm }=k_{0}\pm \unicode[STIX]{x0394}k$
are the amplitude and wavenumbers of the sideband perturbations. In this study
 $\unicode[STIX]{x0394}k=k_{0}/5$
is used, which corresponds to
 $\unicode[STIX]{x1D6FF}\approx 0.10$
.
According to equation (2.4), for a given
 $\unicode[STIX]{x1D6FF}$
the growth rate increases with increasing the initial steepness
 $\unicode[STIX]{x1D716}_{0}$
. This effect is exploited here to shorten the time needed to reach the breaking, and thus to reduce the computational effort. The breaking is anticipated due to the combination of two effects: (i) the growth factor is higher for larger
 $\unicode[STIX]{x1D716}_{0}$
(see figure 9); (ii) a lower amplification factor is needed to reach the breaking threshold starting from larger initial steepness.
The velocity field in water is initialized by linear theory:
 $$\begin{eqnarray}\left.\begin{array}{@{}c@{}}u(x,y,0)=A_{0}\unicode[STIX]{x1D714}_{0}\text{e}^{k_{0}y}\cos (k_{0}x)+A_{1}\unicode[STIX]{x1D714}^{+}\text{e}^{k^{+}y}\cos (k^{+}x)+A_{1}\unicode[STIX]{x1D714}^{-}\text{e}^{k^{-}y}\cos (k^{-}x),\\ v(x,y,0)=A_{0}\unicode[STIX]{x1D714}_{0}\text{e}^{k_{0}y}\sin (k_{0}x)+A_{1}\unicode[STIX]{x1D714}^{+}\text{e}^{k^{+}y}\sin (k^{+}x)+A_{1}\unicode[STIX]{x1D714}^{-}\text{e}^{k^{-}y}\sin (k^{-}x),\end{array}\right\}\end{eqnarray}$$
where
 $u$
and
 $v$
denote the horizontal and vertical velocity, respectively,
 $y$
is the vertical axis oriented upwards and
 $\unicode[STIX]{x1D714}$
is obtained by the linear dispersion relation
 $\unicode[STIX]{x1D714}=\sqrt{gk_{0}}$
. The velocity field in air is initially set to zero but, as discussed in Iafrati (Reference Iafrati2011), at the beginning of the simulation the Poisson equation is solved to enforce the continuity and the pressure correction term modifies the velocity field in air, making the normal velocity continuous across the air–water interface. Of course the tangential velocity is discontinuous. The finiteness of the grid size as well as the filtering operated to the VOF function, and in turn the density distribution, make the jump much smoother and the vorticity bounded.
The physical properties of the fluids are those of air and water, i.e.
 $\unicode[STIX]{x1D70C}_{w}=1000~\text{kg}~\text{m}^{-3}$
,
 $\unicode[STIX]{x1D70C}_{a}=1.125~\text{kg}~\text{m}^{-3}$
,
 $\unicode[STIX]{x1D707}_{w}=1.010^{-3}~\text{N}~\text{s}~\text{m}^{-2}$
,
 $\unicode[STIX]{x1D707}_{a}=1.810^{-5}~\text{N}~\text{s}~\text{m}^{-2}$
, the surface tension coefficient is
 $\unicode[STIX]{x1D6FE}=0.073~\text{N}~\text{m}^{-1}$
and the fundamental wavelength is
 $\unicode[STIX]{x1D706}_{0}=2\unicode[STIX]{x03C0}/k_{0}=0.60$
m, which corresponds to a wave period
 $T_{p}\approx 0.62$
s and a phase velocity
 $c_{p}\approx 0.968~\text{m}~\text{s}^{-1}$
.
The width of the computational domain is
 $L=5\unicode[STIX]{x1D706}_{0}=3$
m, with
 $x\in (-0.5,2.5)$
m, which is, on the basis of the initial conditions (2.5), the minimum size enabling the use of periodic boundary conditions. The undisturbed free surface corresponds to
 $y=0$
. It is worth noticing that during the evolution, and in the breaking phase in particular, the development of wave components with wavelengths
 $\unicode[STIX]{x1D706}>L$
or wavelengths which are not integer fractions of
 $L$
is prevented by the periodicity in the boundary conditions. The significant reduction of the computational effort allowed by the use of the periodicity in the horizontal direction makes such inherent approximation acceptable.
The bottom boundary is located at
 $y=-1.25\unicode[STIX]{x1D706}_{0}=-0.75$
m, and thus the deep water condition may be assumed. The upper boundary is located at
 $y=1.75\unicode[STIX]{x1D706}_{0}=1.05$
m in order to reduce the effect of the top boundary on the air flow. In both cases, free-slip conditions are applied.
The computational domain is split into a total of
 $10\times 6$
square blocks, a half-wavelength wide. An adaptive refinement technique is used: the mesh is adapted based on the local vorticity and on the gradient of the interface function. The coarsest discretization level of the blocks is
 $2^{5}$
and the finest
 $2^{10}$
, the latter corresponding to
 $2^{11}$
grid points per fundamental wavelength, or a cell size of approximately
 $0.293$
mm. Due to the length scale adopted in the present study, surface tension and viscosity are not always sufficient to stabilize the numerical instabilities developing at the free surface, eventually leading to a spurious tearing of the interface. Such numerical effect is suppressed by filtering the VOF function three times.
All the results presented here are in dimensional form. In order to ease the comparison of the findings with analogous studies presented in non-dimensional form the main dimensionless parameters are introduced. The common way to define a Reynolds number for wave breaking flows is to use the fundamental wavelength,
 $\unicode[STIX]{x1D706}$
, as reference length and
 $\sqrt{g\unicode[STIX]{x1D706}}$
, which is proportional to the phase speed, as reference velocity. With these characteristic scales the Reynolds number is:
 $$\begin{eqnarray}Re=\frac{\unicode[STIX]{x1D70C}_{w}\unicode[STIX]{x1D706}\sqrt{g\unicode[STIX]{x1D706}}}{\unicode[STIX]{x1D707}_{w}}=\frac{\unicode[STIX]{x1D70C}_{w}g^{1/2}\unicode[STIX]{x1D706}^{3/2}}{\unicode[STIX]{x1D707}_{w}}\end{eqnarray}$$
that, for a water wave of wavelength 0.6 m, gives
 $Re=1.455\times 10^{6}$
. Similarly it is possible to define the Bond number as:
 $$\begin{eqnarray}Bo=\frac{\unicode[STIX]{x1D70C}_{w}(\sqrt{g\unicode[STIX]{x1D706}})^{2}\unicode[STIX]{x1D706}}{\unicode[STIX]{x1D70E}}=\frac{\unicode[STIX]{x1D70C}_{w}g\unicode[STIX]{x1D706}^{2}}{\unicode[STIX]{x1D70E}}=48\,378.\end{eqnarray}$$
By using the same arguments of Deike et al. (Reference Deike, Popinet and Melville2015), the boundary layer (BL) thickness at the interface
 $\unicode[STIX]{x1D6FF}_{BL}$
is of the order of
 $\unicode[STIX]{x1D706}/\sqrt{Re}$
. In Deike et al. (Reference Deike, Melville and Popinet2016), simulations with three different grid resolution were performed, namely 256, 512 and 1024, for the same wavelength,
 $24$
cm (Deike et al.
Reference Deike, Melville and Popinet2016), and Reynolds number
 $Re=40\,000$
. In such conditions
 $\unicode[STIX]{x1D6FF}_{BL}\approx 1.2$
mm which corresponds to 6, 3 and 1.5 grid cells for the fine, medium and coarse grids, respectively. The results presented in figure 15 of Deike et al. (Reference Deike, Melville and Popinet2016) indicate that there are few differences in the total energy dissipated and average dissipation rate for the three different simulations, although the instantaneous dissipation rate exhibits larger differences.
From the simulation conditions used in the present study, it follows that
 $\unicode[STIX]{x1D6FF}_{BL}\approx 0.5$
mm and thus for the refinement level adopted, which corresponds to a grid cell of 0.293 mm, there are approximately 1.7 grid point inside the boundary layer. This value is just a little smaller than the one for the coarse grid used in Deike et al. (Reference Deike, Melville and Popinet2016) and thus it should allow a good estimate of the total energy dissipation and the average dissipation, whereas some differences might occur in terms of the instantaneous dissipation rate.
For the scope of the present study, both the energy dissipation and the average dissipation rates are of interest. Hence, a numerical simulation on a finer grid with finest discretization level
 $2^{12}$
, or 4096, grid points per wavelength, has been performed for the case with initial steepness
 $\unicode[STIX]{x1D700}_{0}=0.20$
to ascertain the capability of the adopted resolution to correctly describe the dissipation processes. The convergence is evaluated on the time history of the energy in water and, in order to limit the computational effort, the analysis is split in two phases, one for the early stage and one for the breaking phase (figure 2).
In figure 2(a) the comparison refers to the first two wave periods after the initial start. The two solutions exhibit a small vertical shift but the slope, i.e. the dissipation rate, is the same. The vertical shift is just an effect of the grid discretization. In fact, because of the smaller cell size, the intermediate density region for the finer grid shrinks, and thus the corresponding growth in the size of the water density domain led to a slight increase in the energy content. Such differences are of the order of 0.2 % of the total energy content in water and can be neglected. For the analysis of the breaking phase, the computation with the fine grid is restarted from the solution provided by the coarse one few steps before the onset of the breaking and is continued for approximately four wave periods. Results, depicted in figure 2(b) show that there is a small difference in the duration of the first breaking but the dissipation rates during the two breaking events as well as during the intermediate non-breaking phase are essentially the same. The above results indicate that the adopted resolution of
 $2^{11}$
nodes per wavelength is sufficient to capture all of the most relevant scales governing the breaking dissipation process.
Comparison of the time history of the total energy in water for the first two wave periods (a) and during the breaking (b) with two different maximum levels of refinement:
 $2^{11}$
(solid line) and
 $2^{12}$
(circles).

3 Free-surface kinematics and geometry
3.1 Free-surface profiles and breaking
As the flow evolves from the initial condition an energy transfer from the fundamental component to the sidebands takes place. The sidebands grow according to (2.4) and lead to the formation of a steep wave. As discussed in Tulin & Waseda (Reference Tulin and Waseda1999), as long as the wave remains stable and does not break, the phenomenon is reversible and recurrence is observed. For the initial conditions adopted here, due to the large value of initial steepness, the steepest wave in the group exceeds some limiting conditions and breaks.
Evolution in time of the air–water interface for the case with initial steepness
 $\unicode[STIX]{x1D700}_{0}=0.20$
. The interface is drawn also beyond
 $x=2.5$
m by exploiting the periodicity of the solution. The circles are located about the breaking events. The slope of the dotted line corresponds to the group velocity.

The evolution in time of the air–water interface, which is identified as the level
 ${\mathcal{F}}=0.5$
, is shown in figure 3 for the case with initial steepness
 $\unicode[STIX]{x1D700}_{0}=0.20$
. The figure shows a first, rather weak, breaking event starting at approximately
 $t=12.86$
s. As already discussed, due to the modulational process the breaking is recurrent with a period which is associated with the group velocity. A second breaking event, much stronger than the first one, occurs at
 $t\approx 14.20$
s and leads to a splash-up, with large amount of air entrainment and ejection of droplets. It is observed that whereas the upper surface layer is pushed forward by the plunging jet, the entrained air is almost stationary and undergoes only a vertical motion as a result of the combination of the orbital velocity of the wave with the flow induced by the underwater vortical structures. Another breaking, still rather violent, is observed for
 $t\approx 15.50$
s which is followed by a last and weaker breaking, at
 $t\approx 16.80$
s. Afterwards, the free-surface shape displays a wavy surface with some small scale disturbances which are basically traces on the free surface of vorticity structures and bubbles resulting from the air entrainment during the breaking process.
A sequence of the free-surface profiles about the first mild spilling event is shown in figure 4. In the figure the solution computed by the adopted and by the finer discretization are compared. Results indicate that the adopted resolution does not capture the finest capillary details although, as illustrated in the following, it does enable a correct description of all scales which are relevant for the dissipation process.
Comparison of the free-surface profiles provided by the
 $2^{11}$
(dashed line) and
 $2^{12}$
(solid line) grid discretization for the case with
 $\unicode[STIX]{x1D700}_{0}=0.20$
. Solutions refer to times
 $t=12.845,12.865,12.884,12.903,12.923,12.942$
s.

Flow details in terms of velocity field and vorticity (red positive vorticity, blue negative) for the
 $\unicode[STIX]{x1D700}_{0}=0.20$
condition: (a) spilling breaking at time
 $t=12.98$
s; (b) splashing at time
 $t=15.71$
; (c) bubbles and droplets at
 $t=15.98$
s. The interface is made thicker for the sake of clarity. In (a) the phase velocity is subtracted in order to highlight the flow separation occurring at the toe of the breaker.

Some details of the flow taking place in the different phases of the breaking process are provided in figure 5. Figure 5(a) shows velocity and vorticity fields at the first weak spilling breaking event. As already shown in Qiao & Duncan (Reference Qiao and Duncan2001), the flow separates at the toe of the breaker leading to the formation of a liquid portion beneath the wave crest which propagates with the phase speed. In the picture, this is made clearer by subtracting the phase speed from the horizontal velocity component. The instability of the shear layer at the toe generates underwater vortical structures that induce free-surface perturbations behind the breaker (Iafrati & Campana Reference Iafrati and Campana2005).
From a careful observation of the free-surface profile in figure 5(a) it is noticed that, differently from what is generally found for a spilling breaking which spans from the toe of the breaker up to the wave crest (Qiao & Duncan Reference Qiao and Duncan2001; Diorio, Liu & Duncan Reference Diorio, Liu and Duncan2009, e.g.), in this case the bulge ends before the crest. Such a difference in the shape of the bulge is related to the interaction of the wave with the group and it is somewhat related to the recurrence of the breaking.
The phenomenon can be explained through a sketch provided in Donelan et al. (Reference Donelan, Longuet-Higgins and Turner1972), part of which is given in figure 6 for the convenience of the reader. The breaking conditions exist when the peak of the group envelope overtakes a certain threshold, but the breaking itself occurs when the wave approaches the peak and overtakes the threshold. As the wave propagates faster than the group, after the crest passes the peak of the envelope, the wave height starts reducing and when it drops below the threshold it stops feeding the breaker, which then detaches and slides down along the forward face of the wave. From the sequence in figure 4 it is seen that the wave crest reaches the peak at
 $t\approx 12.884$
s and starts descending afterwards: the inflection point on the bulge develops from
 $t\approx 12.923$
s. In spite of some differences between the two discretizations about the crest and on the rear, the profiles at the toe overlap well.
Sketch showing the interaction of the wave with the group: figure adapted from Donelan et al. (Reference Donelan, Longuet-Higgins and Turner1972). Conditions for breaking exist when the peak of the envelope overtakes a certain threshold.

A detail of the splash-up process and of the air entrainment is shown in figure 5(b). Of particular interest is the intense velocity field in air compared to water, which is a consequence of the large density ratio. Correspondingly, stronger vortex structures are formed in the air phase and a large circulation is induced in water by the air entrainment process which significantly contributes to the energy dissipation. An example of the complicated topological structure of the interface and of the corresponding flow field is provided in figure 5(c). The vorticity structures in figure 5(b,c) display the inverse cascade features that are a consequence of the two-dimensionality assumption. As already discussed in the Introduction, although vorticity dynamics, air bubbles and droplets are significantly different in three dimensions, there are no substantial differences in terms of dissipated energy fraction and average dissipation rate which are the main focus of the present study. Similar conclusions were found in Lubin et al. (Reference Lubin, Vincent, Abadie and Caltagirone2006) and Deike et al. (Reference Deike, Melville and Popinet2016).
3.2 Spectrum component evolution
In order to evaluate how the wave spectrum is changed by the occurrence of breaking and to show the energy transfer from the fundamental component towards the sidebands, the Fourier transform of the free-surface profiles is computed. To this purpose bubbles and droplets have to be removed. Furthermore, in the breaking phase, when the free-surface profiles are generally multi-valued, a filter is applied to make the profile single-valued everywhere. As shown in figure 7, in each multi-valued region the free surface is approximated as a straight line connecting the nearest single-valued free-surface points, which is quite similar to what is done in figure 16 of Derakthi & Kirby (Reference Derakthi and Kirby2016). Such filtering has the same effect as a wave probe in the experiments which returns one single free-surface elevation at a point. It is worth remarking that the action of the filter is rather local and it mainly cuts off the free-surface perturbations induced by air entrainment or underwater vorticity. However, the filter introduces some spurious effects to the high-frequency components, and for this reason in figure 10 the spectra are shown only for times at which the free surface is single valued.
Example of the filtering operation needed before performing the Fourier transform of the interface profile. The original free surface is drawn with the thin line, whereas the thick line is the filtered profile.

The time evolution of the fundamental component and of the sidebands is reported in figure 8 for the three different initial steepness. As anticipated in the previous section and discussed in Tulin & Waseda (Reference Tulin and Waseda1999), there is a transfer of energy from the fundamental component to the sidebands which is irreversible in the case of breaking occurrence. The breaking freezes the transfer process and most of the initial energy content is definitively moved to the lower sideband. The above phenomenon is known as down-shifting and was observed in Melville (Reference Melville1982) and Tulin & Waseda (Reference Tulin and Waseda1999) in laboratory experiments.
Evolution of the main spectrum components: fundamental
 $k_{0}$
(green dotted line), lower sideband
 $k^{-}$
(red solid line), upper sideband
 $k^{+}$
(blue dashed-dot line). From (a–c)
 $\unicode[STIX]{x1D700}_{0}=0.18,0.20,0.22$
.

The time histories of the lower sideband component for the three conditions are drawn in figure 9 where a comparison with the theoretical prediction based on (2.4) is also established for the case
 $\unicode[STIX]{x1D700}_{0}=0.20$
. For all cases considered here, the amplitude of the lower sideband
 $k^{-}$
remains constant after the end of the breaking process. The final value of the lower sideband is between 70 and 80 % of the fundamental component
 $A_{0}$
, and exhibits a slight increase with the initial steepness.
Growth of the lower sideband of the spectrum
 $k^{-}$
:
 $\unicode[STIX]{x1D700}_{0}=0.18$
(red solid line);
 $\unicode[STIX]{x1D700}_{0}=0.20$
(green dashed line);
 $\unicode[STIX]{x1D700}_{0}=0.22$
(blue dashed-dot line); analytic growth rate of (2.4) (black solid line); circles represent the end of the breaking process.

A more global view of the spectrum and of the changes resulting from the breaking are given in figure 10 where the spectra computed for the case
 $\unicode[STIX]{x1D700}_{0}=0.20$
at different time instants before the onset of the breaking and after the end of the breaking process. The time of the breaking onset,
 $t_{b}$
and of the end of the breaking,
 $t_{e}$
, are defined in the next section and the values for the different cases are given in table 1.
Time of breaking onset
 $t_{b}$
(s) (
 $^{\ast }$
for the case
 $\unicode[STIX]{x1D700}_{0}=0.18$
the time of appearance of the spilling event is considered); time of the end of the breaking process
 $t_{e}$
(s), duration of the whole breaking process
 $t_{b}-t_{e}$
(s), pre-breaking energy content in water per unit of transversal length
 $E_{wb}$
(
 $\text{J}~\text{m}^{-1}$
), post-breaking energy content per unit of transversal length
 $E_{we}$
(
 $\text{J}~\text{m}^{-1}$
), total water energy dissipated by the breaking process
 $E_{wb}-E_{we}$
(
 $\text{J}~\text{m}^{-1}$
), fraction of the pre-breaking energy dissipated by the whole breaking process.

No significant changes are observed in the pre-breaking phase (figure 10 a), apart from some energy transfer from the fundamental component towards the sidebands. As already discussed, during the breaking process the down-shift is completed and thus soon after the end of the breaking process the peak is definitively moved to the left. Due to the small scale disturbances associated with air entrainment and vorticity–free-surface interaction, a clear rise of the high-frequency part of the spectrum is observed (figure 10 b).
It is worth noticing that during the breaking, and for some time after it, the equipartition between potential and kinetic energy does not hold. Hence, the energy of the system is no longer proportional to the square of the wave components and therefore, as explained in the next section, the energy has to be evaluated by integrating the kinetic and potential energy densities in the water domain.
Fourier transform of the surface elevation for the case
 $\unicode[STIX]{x1D700}_{0}=0.20$
at different times: (a) pre-breaking,
 $t<t_{b}$
; (b) post breaking,
 $t>t_{e}$
.

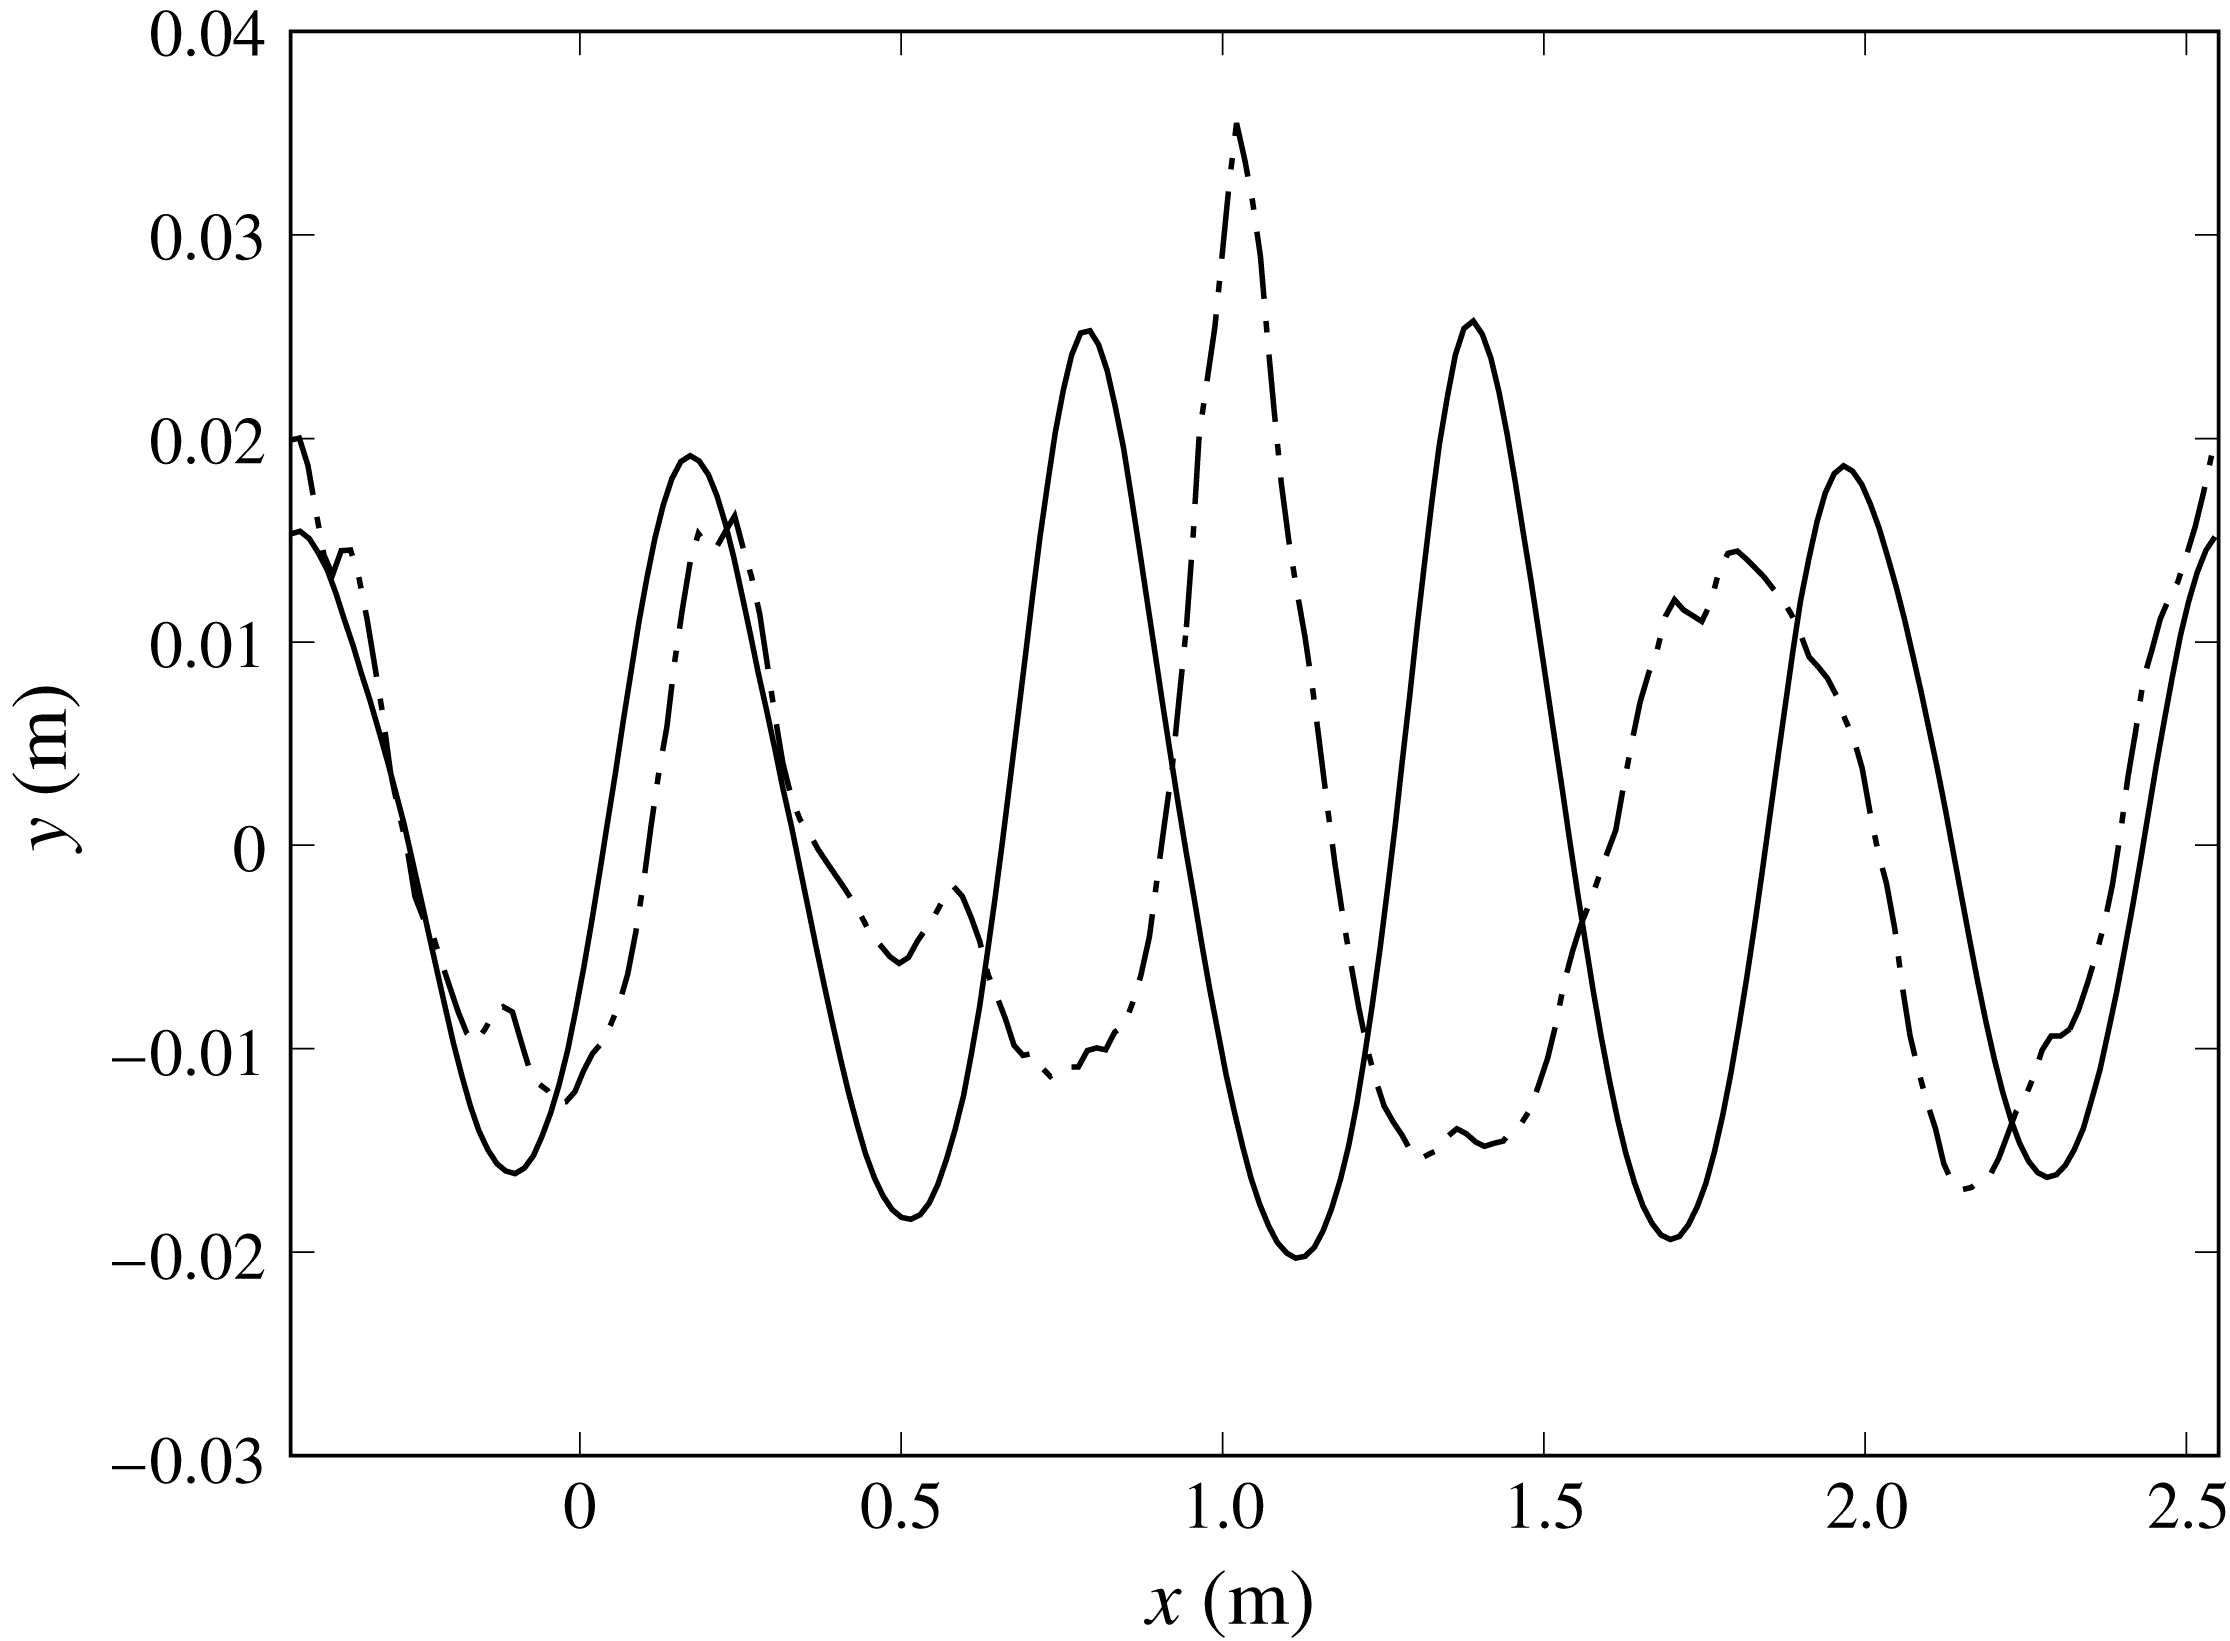
As a consequence of the down-shifting process, the number of waves in the group is reduced from five to four. In the next section it is shown that the phenomenon, which is illustrated in figure 11 and observed experimentally in Tulin & Waseda (Reference Tulin and Waseda1999), significantly contributes to the steepness reduction.
Before closing this section, it is worth remarking that a deeper understanding of the spatial distribution of the frequency components can be achieved by the wavelet transform. By applying such a tool to the free-surface profiles at different stages of the process it is seen that, when the breaking is approached, a very localized high-frequency contribution appears about the crest of the breaking wave, whereas the subharmonic contribution is more uniform in space. These results are in agreement with what discussed in Skandrani, Kharif & Poitevin (Reference Skandrani, Kharif and Poitevin1996). A more extended analysis of the results based on the wavelet transform is still ongoing and will be the subject of future studies.
Comparison of the free surface at two different times:
 $t=2$
s (solid line);
 $t=20$
s (dashed-dot line).
3.3 Free-surface steepness and crest geometry
The crest geometry and its deformation at the onset of the breaking have been widely investigated over the last thirty years. A breaking wave is commonly thought as tilted forward in the direction of the wave propagation with its crest height greater that the trough depth. Motivated by the existence of a limiting wave steepness
 $\unicode[STIX]{x1D700}_{S}=0.443$
as predicted by the Stokes theory (Perlin et al.
Reference Perlin, Choi and Tian2013), several attempts have been made trying to parameterize the crest geometry of the breaking wave and to derive a universal criterion for the prediction of the breaking occurrence. A detailed review of the subject is provided in Perlin et al. (Reference Perlin, Choi and Tian2013) and in the references therein where it is shown that the crest geometry at the onset of the breaking is highly dependent on the way the breaking is achieved and that this makes it difficult to find a universal criterion based on geometric arguments only.
It is worth noticing that the analysis of the crest geometry is generally limited to the first onset of breaking. The use of a two-phase numerical method in simulating the breaking induced by the modulational instability allows us to perform the analysis of the wave geometry not only for the first breaking event but also for the successive events until the end of the process.
In the following the crest geometry is evaluated in terms of the wave steepness expressed as:
 $$\begin{eqnarray}S_{dc}=\frac{\unicode[STIX]{x03C0}H_{d}}{L_{dc}},\quad S_{uc}=\frac{\unicode[STIX]{x03C0}H_{u}}{L_{uc}},\quad S_{cs}=\frac{\unicode[STIX]{x03C0}a_{c}}{L_{c}},\end{eqnarray}$$
which denote the down-crossing, up-crossing and crest steepness, respectively. The definitions of the quantities in the equations (3.1) are sketched in figure 12(a). The above parameters are computed for all the waves which are identified in the computational domain. The steepnesses are in descending order. As discussed in the previous section and shown in figure 11, before the breaking five waves are identified in the group whereas four waves remain at the end of the breaking process.
When computing the steepness it is important to distinguish the wave components from the small scale disturbances that are usually associated with the entrained air bubbles and the underwater vorticity structures (see e.g. figure 12
b). For these reasons, when computing the steepness based on either down- or up-crossing criteria, only waves with wavelength greater than half the fundamental wavelength are retained. Similarly, the crest steepness
 $S_{cs}$
is computed only if the distance between the two zero crossings is greater than one fourth of the fundamental wavelength.
(a) Sketch of the parameters used to compute the steepness:
 $c$
is the crest,
 $z_{u}$
the zero up-cross point,
 $z_{d}$
the zero down-cross point,
 $H_{u}$
the wave height using the up-cross definition,
 $H_{d}$
the wave height based on the down-cross definition,
 $\unicode[STIX]{x1D706}$
the wavelength, SWL the still water line. (b) Example of small scale structures, mostly vorticity related, which can be interpreted as waves. Note that the horizontal and vertical coordinates are not plotted to the same scale.

In figure 13 the time histories of the steepness of the steepest wave in the domain computed by using the down-crossing and up-crossing definitions are drawn. As already seen in figure 9, the growth of the instability is faster, and thus the breaking starts earlier, for larger initial steepness. Hence, in order to make the comparison easier, the curves are horizontally shifted by the time of breaking onset
 $t_{b}$
.
As in Deike et al. (Reference Deike, Popinet and Melville2015), the time
 $t_{b}$
is chosen as the time at which the free surface becomes multi-valued for the first time. This criterion is generally robust for the first breaking event, although, as discussed in the following, it does not allow us to identify the onset of the breaking when it starts as a gentle spilling with single-valued free surface. An example of spilling breaking with single-valued free-surface elevation is shown in figure 2(c) of Diorio et al. (Reference Diorio, Liu and Duncan2009). It is of course more difficult to clearly identify the breaking after the first event as the free surface can become rather complex and multi-valued due to the interaction with bubbles and droplets or with the underwater vorticity. In this case the breaking occurrence can be recognized by the sharp increase in the energy dissipation rate. Unfortunately, it is not so easy to introduce a more quantitative definition.
The results in figure 13 show that, although starting from a different value, both
 $S_{dc}$
and
 $S_{uc}$
approach a quite similar behaviour near the breaking point. The curves are characterized by large oscillations with period
 $2T_{p}$
, which account for the interaction of the wave with the group, and smaller amplitude oscillations with period
 $T_{p}/2$
which are related to the bound waves. The large amplitude oscillations of the three curves exhibit the same phase and also the growth rates of the peaks are comparable. Nonetheless, the values taken by
 $S_{dc}$
and
 $S_{uc}$
at
 $t=t_{b}$
display large differences in the different cases, with
 $S_{dc}\in$
(0.35, 0.41) and
 $S_{uc}\in$
(0.40, 0.48).
During the breaking phase, which lasts approximately
 $8T_{p}$
, the free surface is not always clear and understandable, mainly because of the chaotic shape of the interface which causes sudden variations of the distance between the zero-crossing points. However, once the breaking phase is over, the steepnesses
 $S_{dc}$
and
 $S_{uc}$
continue to oscillate but now they vary in a range, almost independent of time, centred about 0.2 which is far below the pre-breaking value. As already explained, the substantial reduction of the steepness is a consequence of two effects: the reduction of the wave amplitude caused by the energy dissipation and the increase in the wavelength associated with the down-shifting.
Time evolution of the down-cross (a) and up-cross (b) steepnesses:
 $\unicode[STIX]{x1D700}_{0}=0.18$
(red solid line);
 $\unicode[STIX]{x1D700}_{0}=0.20$
(green dotted line);
 $\unicode[STIX]{x1D700}_{0}=0.22$
(blue dashed-dot line).

A similar analysis can be performed for the crest steepness
 $S_{cs}$
, which is drawn in figure 14(a). Also in terms of
 $S_{cs}$
, the solution for the three different cases overlap well before the breaking. However, a much closer agreement is found about the breaking time. From the close-up view provided in figure 14(b) it is seen that the breaking occurs when the crest steepness exceeds 0.71 which is the limiting value of the crest steepness for the Stokes’ wave (Rainey & Longuet-Higgins Reference Rainey and Longuet-Higgins2006). More precisely, the figure shows that in the case
 $\unicode[STIX]{x1D700}_{0}=0.18$
the parameter exceeds the limiting value already at the previous steepening, approximately two wave periods before. By looking at the free-surface profiles, at the vorticity field below (not shown here) and at the time history of the energy (figure 15
a) it is observed that the wave is already breaking at that time but that the breaking in this case is started by a gentle spilling with single-valued free-surface elevation. In such a condition, the criterion based on the multi-valued free-surface elevation is not able to identify the breaking event, and thus
 $t_{b}$
is delayed.
The results of figure 14(a) indicate that the breaking induces also a reduction of the crest steepness, but such a reduction is less sharp than that is observed for
 $S_{dc}$
and
 $S_{uc}$
in figure 13. For all conditions the crest steepness oscillates and the peak value diminishes in time. However, a better overlapping of the three cases can be noted in comparison to
 $S_{dc}$
and
 $S_{uc}$
.
Time evolution of the crest steepness (a); close-up view about the breaking onset (b):
 $\unicode[STIX]{x1D700}_{0}=0.18$
(red solid line),
 $\unicode[STIX]{x1D700}_{0}=0.20$
(green dotted line),
 $\unicode[STIX]{x1D700}_{0}=0.22$
(blue dashed-dot line), Stokes’ limiting value
 $S_{cs}=0.72$
(black solid line).

4 Energy dissipation
As shown in the previous sections, the breaking generated by modulational instability is recurrent and several events are needed before it finally ceases. During the breaking and for some time after the end of the most energetic phase of the breaking, the flow is highly rotational and thus the equipartition between the kinetic and the potential energy is not valid. Hence, the total energy content cannot be estimated by the surface elevation, or by its spectrum. For this reason, in order to correctly quantify the dissipated energy, the kinetic
 $E^{K}$
and potential
 $E^{P}$
contributions in water and air are computed as integrals over the corresponding domains:
 $$\begin{eqnarray}\left.\begin{array}{@{}c@{}}\displaystyle E_{w}^{K}=\frac{1}{2}\unicode[STIX]{x1D70C}_{w}\int _{x}\int _{y}(1-{\mathcal{F}}(x,y))|\boldsymbol{U}|^{2}\,\text{d}x\,\text{d}y\\ \displaystyle E_{w}^{P}=\unicode[STIX]{x1D70C}_{w}g\int _{x}\int _{y}(1-{\mathcal{F}}(x,y))y\,\text{d}x\,\text{d}y-E_{w0}^{P}\\ \displaystyle E_{a}^{K}=\frac{1}{2}\unicode[STIX]{x1D70C}_{a}\int _{x}\int _{y}{\mathcal{F}}(x,y)|\boldsymbol{U}|^{2}\,\text{d}x\,\text{d}y\\ \displaystyle E_{a}^{P}=\unicode[STIX]{x1D70C}_{a}g\int _{x}\int _{y}{\mathcal{F}}(x,y)y\,\text{d}x\,\text{d}y,\end{array}\right\}\end{eqnarray}$$
where
 $$\begin{eqnarray}E_{w0}^{P}=L\unicode[STIX]{x1D70C}_{w}g\int _{y_{0}}^{0}y\,\text{d}y,\end{eqnarray}$$
is the potential energy of the water at the still water level. In (4.2)
 $L$
is the width of the computational domain and
 $y_{0}$
the vertical coordinate of the bottom. Hence, the total energy contents in water and air are evaluated as
 $E_{w,a}=E_{w,a}^{K}+E_{w,a}^{P}$
.
Formally, the energy associated with the surface tension should also be accounted for in the balance. However, as shown in Deike et al. (Reference Deike, Popinet and Melville2015), the maximum energy accumulated as surface energy is a small fraction of the total amount and it can be neglected with respect to the other contributions.
(a) Time history of the total energy in the water domain for all the cases,
 $\unicode[STIX]{x1D700}_{0}=0.18$
(solid line),
 $\unicode[STIX]{x1D700}_{0}=0.20$
(dot line),
 $\unicode[STIX]{x1D700}_{0}=0.22$
(dash-dot line); (b) comparison of the viscous energy decay with analytical solution (Landau & Lifshitz Reference Landau and Lifshitz1959) for the case with
 $\unicode[STIX]{x1D700}_{0}=0.20$
(for this case
 $t_{b}=12.82$
s, see table 1).

The time histories of the total energy contents in water for the different cases, scaled by the corresponding initial values, are reported in figure 15(a). The early phase is characterized by a gentle decay related to the viscous dissipation acting on the orbital velocity. This is confirmed by figure 15(b) where the time history of the energy is compared to the theoretical value
 $E_{w}(t)=E_{w}(0)\exp (-2\unicode[STIX]{x1D6FE}t)$
, where
 $\unicode[STIX]{x1D6FE}=2\unicode[STIX]{x1D707}_{w}/\unicode[STIX]{x1D70C}_{w}k^{2}$
(see Landau & Lifshitz Reference Landau and Lifshitz1959), exhibiting a quite good agreement. The deviation for
 $t>8$
s is a consequence of the nonlinear effects which become more relevant as the steepness increases.
Once the breaking starts, the energy undergoes sharp drops alternating with intervals during which the dissipation rate is still higher than the pre-breaking value, but much lower than in the breaking event. Concurrently with the sharp drops of the energy in water, the energy content in air displays sharp rises (figure 16). The number of breaking events, their durations and the corresponding amounts of water energy dissipated in each event vary from case to case, confirming the large scatter observed in Galchenko et al. (Reference Galchenko, Babanin, Chalikov and Young2010). However, for the whole breaking process both the duration and the dissipated energy fractions are much closer and the differences seem to be mostly due to the inherent uncertainty in the simulations (Iafrati Reference Iafrati2009).
Comparisons of the time histories of the total energy contents in air and water for the different cases: (a)
 $\unicode[STIX]{x1D700}_{0}=0.18$
; (b)
 $\unicode[STIX]{x1D700}_{0}=0.20$
; (c)
 $\unicode[STIX]{x1D700}_{0}=0.22$
. The energies are normalized by the initial energy content in water. For the air phase the energy
 $E_{a}(0)$
associated with the velocity field at
 $t=0$
has been subtracted
 $\unicode[STIX]{x0394}E_{a}(t)=E_{a}(t)-E_{a}(0)$
.

As already stated, during the breaking phase, the equipartition between kinetic and potential energy, usually exploited to estimate the total energy starting from the free-surface elevation, is no longer valid. This is clearly illustrated in figure 17(a) where the time histories of the kinetic and potential energy contributions and of
 $E_{w}/2=(E_{w}^{K}+E_{w}^{P})/2$
are drawn for the case with
 $\unicode[STIX]{x1D700}=0.20$
. In the early stage the two contributions oscillate in time with opposite phase and periodically interchange. However once the breaking starts, the kinetic contribution increases due to the energy accumulated in the vorticity structures which happens at the expenses of the potential energy term. The vorticity structures generated by the breaking take some time to decay and thus the imbalance between the kinetic and potential energy terms last much longer than the visible breaking process. In figure 17(b) the difference between the kinetic and potential energy, normalized by the initial energy in water, is drawn. The figure shows that the peak of the difference occurs in correspondence with the first strong plunging breaking and another local maximum take place in correspondence with the second plunging breaking. The maximum difference is approximately 6 % of the initial energy content in the water and, at the end of the breaking process, the residual difference is of the order of 1.5 %.
(a) Time history of half of the total energy (dash line), kinetic energy (solid line) and potential energy (dashed-dot line) for the case with
 $\unicode[STIX]{x1D700}=0.20$
. (b) Time history of the difference between kinetic and potential energy (solid line). For the sake of clarity the total energy in water (dashed line) is also reported, but with a different vertical scale. The curves are normalized with the initial energy content
 $E_{w}(t=0)$
.

As already anticipated in the previous section, for the case at
 $\unicode[STIX]{x1D700}_{0}=0.18$
the time history of the energy in water exhibits a small jump about two wave periods before the time of breaking onset
 $t_{b}$
. It has been already explained that in this case the breaking starts with a gentle spilling breaking and single-valued free surface. A similar phenomenon, but with a much smaller jump in the energy, occurs for the case at
 $\unicode[STIX]{x1D700}_{0}=0.20$
. The analysis of the free-surface profiles reveals a sharp crest, but there is no clear evidence of breaking from the vorticity field below. From a more careful look at the flow about the crest, a separation of the air flow is observed on the rear face of the wave (figure 18). Consequently, a recirculating region is formed and the pressure on the rear of the wave crest is lower than on the front face at the same
 $y$
-coordinate. The action of the air pressure against the wave propagation is thus responsible for the observed energy reduction.
Pressure contours in the air domain at
 $t=11.68$
s for the case
 $\unicode[STIX]{x1D700}_{0}=0.20$
. Due to the separation of the air flow occurring at the crest, there is a small asymmetry in the pressure distribution with the pressure at the rear (left side) of the crest being somewhat lower than at the front (right side). Such imbalance in the pressure is responsible for a reduction in the energy content in water, even before the onset of the breaking.

In order to estimate the amount of energy dissipated by the whole breaking process, a criterion to define the end of the breaking is introduced. Similarly to the criterion used to identify the onset of the breaking, the end of the breaking process is here defined as the time instant
 $t_{e}$
after which the interface is always single valued. Note that this does not imply that the effects of the breaking are completely over beyond that time. As discussed in Rapp & Melville (Reference Rapp and Melville1990) and Drazen & Melville (Reference Drazen and Melville2009), the coherent structures formed during the breaking decay as
 $t^{-1}$
, and need long times to disappear. However, the time
 $t_{e}$
is representative of the end of the most energetic phase of the breaking. By using the above criterion, the duration and the energy contents in water before and after the breaking process are derived for the different cases and provided in table 1.
In terms of time duration, for all cases the most energetic phase of the breaking lasts between
 $4$
and
 $4.8$
s, i.e. from seven to eight wave periods, and dissipates approximately 20–25 % of the pre-breaking energy. As discussed above, some vorticity remnants of the breaking process keep the dissipation rate still high for a longer time interval.
From the comparison of the above results with what found through the wave focusing technique, both experimentally, e.g. Rapp & Melville (Reference Rapp and Melville1990), or numerically, e.g. Iafrati (Reference Iafrati2009), important consequences in terms of the dissipation rate can be drawn. In the case of wave focusing, the energy fraction dissipated by the breaking is up to 40 % of the initial energy and, furthermore, most of it is dissipated within approximately three wave periods from the onset. For the modulational instability cases discussed here, the dissipated energy fraction is approximately half of that found in the focusing case and the duration is more than double.
As an attempt to achieve a better comprehension of the dissipation processes, the energy contents
 $E_{s}$
of each single wave are computed. This is done by integrating equations (4.1) in the water domain confined by the
 $x$
-coordinates of two successive minima in the free-surface elevation. The different energy contents are sorted in descending order. During the breaking phase, the identification of the single wave as that between two successive minima is not always precise because short wavelength perturbations appear as a result of the air entrainment, underwater vorticity structures and redistribution of the wavelength by the down-shifting process (Tulin & Waseda Reference Tulin and Waseda1999). For this reason, the energy content of waves with a distance between the two successive minima below
 $\unicode[STIX]{x1D706}/2$
is added to the adjacent wave which has the shortest distance between the minima.
The time histories of the energy contents of the three most energetic waves in the group are shown in figure 19(a) for the case at
 $\unicode[STIX]{x1D700}_{0}=0.20$
. The figure shows that the wave takes the highest energy when it passes below the peak of the envelope. Hence it starts diminishing in amplitude while the next wave grows and at a certain time they swap in the order of the energy content. It is worth observing that when the breaking is approached, the rise of the energy is still smooth whereas the drop is much sharper.
The time histories of the energy of the most energetic wave for the three different cases are drawn in figure 19(b) where a time shift
 $t_{b}$
is applied to the different curves. The data show that the maximum energy transported by the single wave grows up to the onset of the breaking, with the total growth of the energy content reducing with increasing the initial steepness. During the breaking phase, due to the uncertainties in the identification of the waves discussed earlier, the curve displays large fluctuations. However, at the end of the breaking process, the maximum energy content in the single wave is substantially reduced with respect to the pre-breaking value.
(a) Time histories of the energy contents of three most energetic waves in the group for the case with
 $\unicode[STIX]{x1D700}_{0}=0.20$
:
 $e_{1}$
(red solid line),
 $e_{2}$
(green dot line),
 $e_{3}$
(blue dash-dot line); (b) evolution of the energy content of the most energetic wave for the three cases:
 $\unicode[STIX]{x1D700}_{0}=0.18$
(red solid line),
 $\unicode[STIX]{x1D700}_{0}=0.20$
(green dot line),
 $\unicode[STIX]{x1D700}_{0}=0.22$
(blue dashed line).

Some additional insights about the energy dissipation can be gained by plotting separately the energy of the most energetic wave and the sum of all others. For the interpretation of the data, it is found helpful to plot them without the time shift and to use a Bezier smoothing to filter out the largest fluctuations (figure 20). The results indicate that, although the breaking initiates at different times and from a different energy level, starting from the breaking onset all curves approach a
 $t^{-1}$
decay law. A similar behaviour was found experimentally in Drazen & Melville (Reference Drazen and Melville2009) and numerically in Chen et al. (Reference Chen, Kharif, Zaleski and Li1999) in the case of the wave focusing technique. Conversely, the sum of all other waves in the group exhibits a weak reduction during the growth of the modulational instability, a quite rapid drop during the breaking phase and approaches a constant value afterwards.
Time history of the energy content of the most energetic wave in the group (a) and of the remaining energy in the domain (b) for the three cases:
 $\unicode[STIX]{x1D700}_{0}=0.18$
(solid line),
 $\unicode[STIX]{x1D700}_{0}=0.20$
(dotted line),
 $\unicode[STIX]{x1D700}_{0}=0.22$
(dashed-dot line). The circles correspond to the end of the breaking at
 $t=t_{e}$
. The black line in (a) corresponds to
 $t^{-1}$
.

In figure 16 it is seen that the energy content of air is characterized by spikes which are concurrent with the breaking events. The energy transfer from water to air was already addressed in Iafrati (Reference Iafrati2009) and Iafrati (Reference Iafrati2011) for the breaking generated via the focusing technique. For the breaking induced through the modulational instability, in Iafrati et al. (Reference Iafrati, Babanin and Onorato2013) and Iafrati et al. (Reference Iafrati, Babanin and Onorato2014) it was observed that a strong air flow is induced by the breaking mainly because of the flow separation taking place on the back of the breaking wave crests. The successive interaction of the detached vortex structures with the free surface and with the successive breaking events generates secondary and ternary structures which lead to the formation of large vortex dipoles propagating upwards.
Those results are essentially confirmed by the highly resolved simulations presented here. The strong air flow induced in air, with the formation of upward propagating vortex dipoles, can be seen in figure 21 where the vorticity contours for the simulation with
 $\unicode[STIX]{x1D700}_{0}=0.20$
at time
 $t=16.8$
s are shown. Of course the formation of the large dipoles is a consequence of the two-dimensionality assumption and might not persist for such a long time in a three-dimensional flow. However, the formation of the vortex dipoles has been observed also experimentally (Techet & McDonald Reference Techet and McDonald2005) and it is believed that the three-dimensionality of the flow would mostly affect the decay process but not much the energy which is accumulated in the dipoles (Iafrati et al.
Reference Iafrati, De Vita, Toffoli and Alberello2015).
Vorticity (red positive, blue negative) contours and vorticity lines at time
 $t=16.8$
s for the simulation with
 $\unicode[STIX]{x1D700}_{0}=0.20$
.

4.1 Breaking parameter,
 $b$

During each breaking event the energy dissipation is drastically enhanced. Starting from the Phillips’ model, briefly recalled in the Introduction, the energy dissipation is generally expressed as the dissipation rate per unit length of breaking crest:
 $$\begin{eqnarray}\unicode[STIX]{x1D716}_{l}=b\unicode[STIX]{x1D70C}_{w}c^{5}/g,\end{eqnarray}$$
where
 $b$
is the breaking parameter. In the original model the parameter
 $b$
was assumed to be constant but measurements in different conditions showed differences of several orders of magnitude. A much deeper study was performed by Drazen et al. (Reference Drazen, Melville and Lenain2008) who, on the basis of inertial scaling arguments for plunging breaking, proposed for the breaking parameter a dependence
 $b\sim S^{5/2}$
,
 $S$
being the wave steepness at the breaking. Romero et al. (Reference Romero, Melville and Kleiss2012) introduced a small change and proposed:
 $$\begin{eqnarray}b=0.4(S-0.08)^{5/2}\end{eqnarray}$$
motivated by the fact that, according to their measurements, waves with steepnesses below 0.08 do not break and thus the breaking dissipation should vanish.
In order to derive estimates of the coefficient
 $b$
for the present numerical results, the approach used in Deike et al. (Reference Deike, Popinet and Melville2015) is employed and the energy decay during the breaking is expressed as
 $E_{w}(t)\sim E_{w0}\exp [-\unicode[STIX]{x1D701}t]$
. With such an assumption, the dissipation rate per unit length
 $\unicode[STIX]{x1D716}_{l}$
is equal to
 $E_{w0}\unicode[STIX]{x1D701}$
and the breaking parameter
 $b$
can be computed as
 $b=E_{w0}\unicode[STIX]{x1D701}g/(\unicode[STIX]{x1D70C}_{w}c^{5})$
.
The breaking coefficient
 $b$
can be derived for all the breaking processes. For this purpose, each segment in the energy curves (figure 15
a) corresponding to a breaking event is fitted with an exponential curve to compute the exponent
 $\unicode[STIX]{x1D701}$
. The velocity
 $c$
is approximated by the linear phase velocity for gravity waves, as done in Deike et al. (Reference Deike, Popinet and Melville2015).
The estimates of the breaking parameter
 $b$
for all breaking events are shown in figure 22 where they are compared with the experimental data available in the literature and with the exponential relation. Results are presented in terms of the steepness evaluated both as the sum of the steepness of the initial wave components (figure 22
a), as done in Deike et al. (Reference Deike, Popinet and Melville2015), and as the down-crossing value (3.1) (figure 22
b). The latter is motivated by the fact that in field experiments there is no concept of initial steepness, and thus it can be useful to relate the breaking parameter to the steepness at the onset of the breaking which, instead, can be measured. From figure 22(a) it is seen that the present results agree very well with the data available in the literature and with the exponential dependence suggested in Romero et al. (Reference Romero, Melville and Kleiss2012).
Breaking parameter
 $b$
as a function of the steepness: the black line is the relation (4.4); the open red triangles and the solid green triangles are the data in Drazen et al. (Reference Drazen, Melville and Lenain2008) from Scripps Institution of Oceanography (SIO) and Tainan Hydraulics Laboratory (THL) respectively; the open blue diamonds are the data from Melville (Reference Melville1994) at the Massachusetts Institute of Technology; the blue stars are the data for the simulation with
 $\unicode[STIX]{x1D700}_{0}=0.18$
; the open magenta boxes are the data from the simulation with
 $\unicode[STIX]{x1D700}_{0}=0.20$
; the solid blue boxes are the data from the simulation with
 $\unicode[STIX]{x1D700}_{0}=0.22$
. For the present numerical data, the steepness is evaluated as the sum of the steepness of the initial wave components in (a) and from the down-crossing criterion at the beginning of the breaking in (b). Figure adapted from Romero et al. (Reference Romero, Melville and Kleiss2012).

5 Conclusion
In this study the breaking of free-surface waves induced by modulational instability has been numerically investigated by using the Gerris Navier–Stokes solver for multi-phase flows. Attention has been focused on describing the whole breaking process, from the very beginning up to the end. The whole process requires long distances for the development, making it hardly achievable in experimental facilities, and the use of a multi-phase approach is of help in this respect. Of course, because of the huge computational costs, applications have been limited to short wavelengths and a two-dimensionality assumption has been adopted. In order to investigate the role of the breaking intensity, the study has been performed for three different values of the initial steepness.
The evolution of the wave steepness has been evaluated on the basis of the most common definitions: down-cross, up-cross and crest steepness. Even though the down-cross and up-cross steepnesses exhibit a quite similar behaviour in the different conditions, no correlation has been found for the values taken at the breaking onset. Conversely, for all cases the breaking has been found to occur when the crest steepness exceeds the Stokes’ limit. The reduction of the wave amplitude caused by the energy dissipation combined with the down-shifting process induced by the breaking, causes significant reduction of the steepness. It has been shown that in the post-breaking phase the steepnesses are much lower than in the pre-breaking phase and oscillate in a range which is almost independent of the initial steepness.
The energy contents and their evolution in both fluids have been carefully analysed. It has been found that the whole breaking process dissipates approximately 20–25 % of the pre-breaking energy content and such an amount of energy is dissipated in approximately eight wave periods. As a consequence, the dissipation rate is much lower than that obtained through the wave focusing approach, for which a larger energy fraction is dissipated in a shorter time interval. It is not clear at the moment if and to what extent the duration of the breaking process and the dissipated energy fraction are dependent on the characteristics of the spectrum, or
 $\unicode[STIX]{x0394}k/k_{0}$
, and that would be the subject of future studies.
By singling out the energy contents of the different waves in the group, it has been found that, after the breaking, the energy of the most energetic wave decays as
 $t^{-1}$
while the energy of all the other waves in the group remain almost constant.
Acknowledgements
The work has been financially supported by the Flagship Project RITMARE – The Italian Research for the Sea – coordinated by the Italian National Research Council and funded by the Italian Ministry of Education, University and Research within the National Research Program 2014–2015. Authors express their gratitude to the Gerris team and Dr S. Popinet not only for making the code available (http://gfs.sourceforge.net) but also for the technical help provided and Dr S. Chibbaro for very helpful discussions. The numerical simulations have been performed at CINECA, the Italian Supercomputing Center. We acknowledge the CINECA award under the ISCRA initiative, for the availability of high performance computing resources within the projects IscrC_DIPWAVE and IscrC_TREBOW. The technical support by Dr G. Amati is also gratefully appreciated.



