I. INTRODUCTION
9–12%Cr ferritic heat resistant steels have been considered as the main materials for power plants operating under supercritical or ultra-supercritical conditions due to their good high-temperature endurance, creep resistance properties, excellent heat conductivity, low thermal expansion coefficient, and high performance–cost ratio.Reference Ennis and Czyrska-Filemonowicz1–Reference Zhao, Jing, Xu, An, Xiao, Xu, Chen and Han3 For these steels, quenching and tempering treatment are usually used during which tempered martensite without residual stress can be achieved,Reference Shanthraj and Zikry4 and the dispersive carbides or carbonitrides play a significant role in strengthening phase.Reference Lu, Faulkner, Riddle, Martino and Yang5,Reference Abe6 On account of new environmental regulations, energy saving requirements, and commercial demands, it is necessary to elevate the working temperature of power plants to improve thermal efficiency.Reference Abe7 Thus, developing an advanced heat treatment is an alternative approach to meet these requirements.
The new concept of quenching and partitioning (Q&P) heat treatment initially proposed by Edmonds et al.Reference Edmonds, He, Rizzo, De Cooman, Matlock and Speer8 consists of two steps: first, the steel is quenched from full austenite microstructure to a temperature [quenching temperature (QT)] between the starting temperature of martensitic transformation (Ms) and the finishing temperature of martensitic transformation (Mf) so that a certain amount of untransformed austenite remains within martensite; then, the steel is held at a constant temperature [partitioning temperature (PT)] that is either equal to the quenched temperature (a case called one-step Q&P) or higher than the quenched temperature (a case called two-step Q&P)Reference Li, Lu, Wu, Min and Jin9 for carbon atoms to migrate from as-quenched martensite into untransformed austenite, thus suppressing the carbide precipitationReference Clarke, Speer, Miller, Hackenberg, Edmonds, Matlock, Rizzo, Clarke and De Moor10; finally, the steel is cooled down to room temperature (RT). The carbon-enriched untransformed austenite would be retained probably at RT due to its high stability caused by high carbon content.Reference De Moor, Lacroix, Clarke, Penning and Speer11 The Q&P heat treatment has been mainly applied to transformation-induced plasticity (TRIP) steelsReference Kobayashi, Song and Sugimoto12,Reference Kühn, Romberg, Mattern, Wendrock and Eckert13 for which carbon-enriched metastable retained austenite is considered beneficial to formability and energy absorption owing to the contribution of TRIP phenomenon during deformation.Reference Speer, Edmonds, Rizzo and Matlock14,Reference Liu, Sommer and Mittemeijer15
However, so far as the author knows, the Q&P heat treatment has never been conducted toward 9%Cr ferritic heat-resistant steels, and extensive efforts should be devoted to investigating the microstructure evolution of 9%Cr ferritic heat-resistant steels treated by Q&P. It has been generally noted that two martensitic transformations occur in steels during Q&P. The kinetics for the first one is as the same as the martensitic transformation during quenching in conventional quenching and tempering heat treatment in the initial cooling process; for the second one, the kinetics is not yet clear. Hence, this work is aimed to investigate the microstructure evolution and the kinetics of the second martensitic transformation during the Q&P process in 9Cr–1.8W–0.3Mo ferritic heat-resistant steel, hoping to explore the validity of applying Q&P technology to these steels.
II. EXPERIMENTAL PROCEDURES
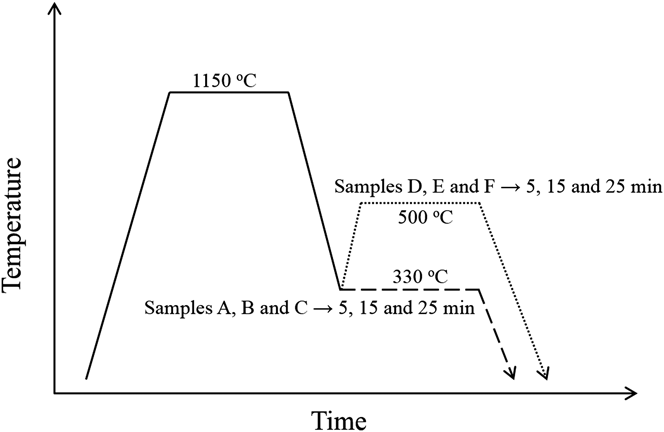
The experimental material was supplied by Tianjin Pipe Corporation (Tianjin City, People's Republic of China), and the chemical composition is given in Table I. The raw material was first hot rolled at 950 °C followed by air cooling. The heat treatment was performed on a high-resolution differential dilatometer (Bähr DIL 802, Baehr Thermoanalysis, North Rhine-Westphalia, Germany), and the length change of samples during the whole process was recorded. The Q&P treatments used in this work are illustrated in Fig. 1: first, six samples were heated from RT to 1150 °C [austenitizing temperature (AT)] and held at this temperature for 15 min and then cooled down to 330 °C (QT) at a rate of 240 °C/min; afterward, samples A, B, and C were held at 330 °C for 5, 15, and 25 min, respectively, and cooled down to RT at a rate of 240 °C/min; samples D, E, and F were reheated to 500 °C and held, respectively, for 5, 15, and 25 min and cooled down to RT at 240 °C/min. The transmission electron microscope (TEM) (JEM-2100F, JEOL Ltd., Tokyo, Japan) was used to examine the microstructure. Thin foils for TEM observation were prepared as follows: first, sheet samples were mechanically polished to 50 μm thickness using emery paper, and then they were electrolytically polished by dual-jet polishing apparatus using a solution of 5% (vol%) perchloric acid-ethyl alcohol.
Schematic image of six experiments applying one-step or two-step Q&P heat treatment: samples A, B, and C were kept at 330 °C for 5, 15, and 25 min and samples D, E, and F were kept at 500 °C for 5, 15, and 25 min, respectively.

Chemical composition of the experimental 9Cr–1.8W–0.3Mo steel (in wt%).

III. EXPERIMENTAL RESULTS
A. Analysis of dilatometric curve
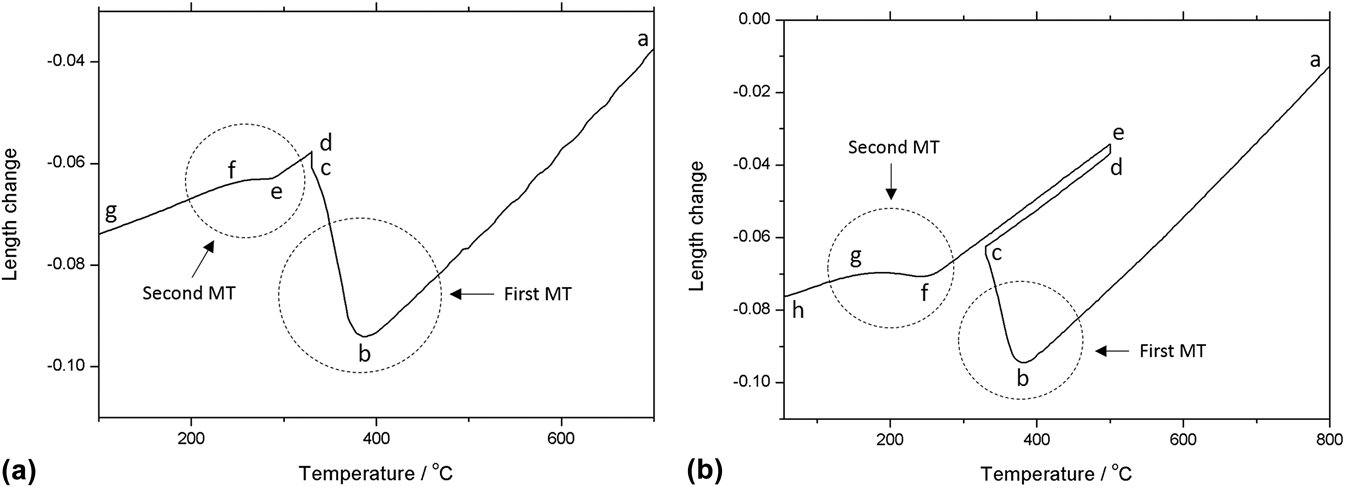
The length changes of samples held at 330 and 500 °C after austenitization as described in Sec. II are shown in Figs. 2(a) and 2(b), respectively. In Fig. 2(a), segments ab, de, and fg correspond to the normal thermal contraction of steel during continuous cooling in the absence of a phase transformation; part bc represents the uncompleted martensitic transformation during which a length expansion occurs due to the formation of martensite. Since the lattice distortion of austenite (f.c.c. lattice) caused by the dissolution of carbon is less than that of martensite (b.c.c. lattice),Reference Mittemeijer16 the partitioning of carbon from martensite into austenite leads to a slight contraction of volume, and thus the length. Therefore, the length expansion of segment cd mainly caused by the relief of strain accumulated during martensitic transformation. Part ef represents the second martensitic transformation from untransformed austenite. In Fig. 2(b), segments ab, bc, de, ef, fg, and gh are similarly with segments ab, bc, cd, de, ef, and fg in Fig. 2(a), and part cd stands for the normal expansion of steel during continuous heating. It is evident that all the samples have two martensitic transformations during the whole process.
The length change of samples applied (a) one-step and (b) two-step Q&P heat-treatment: both of them have two martensitic transformation.
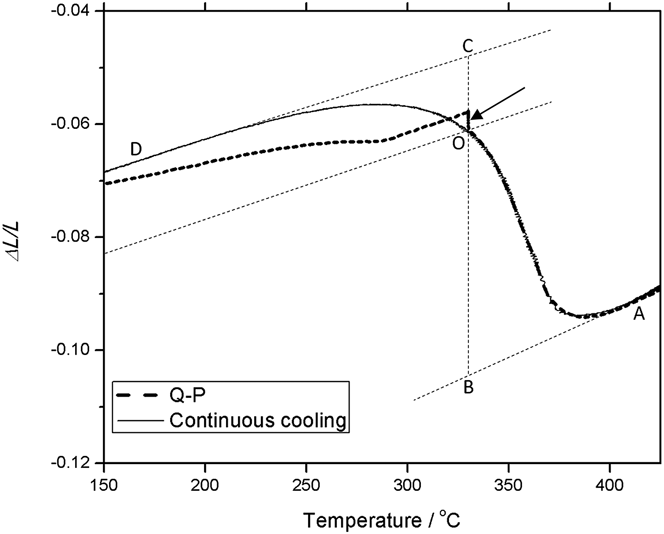
The comparison of dilatometric curve between Q&P and continuous cooling is shown in Fig. 3. The solid line indicates the dilatometric curve of continuous cooling during which there is only one martensitic transformation, and the dashed line indicates the dilatometric curve of Q&P during which two martensitic transformations can be identified. The dilatation of the sample during phase transformation can be considered largely isotropical, and thus, the lever rule can be applied to calculate the phase fraction (as illustrated in Fig. 3)Reference Liu, Sommer and Mittemeijer15:
 $${f_{\rm{\gamma }}} = {{\left| {{\rm{OC}}} \right|} \over {\left| {{\rm{BC}}} \right|}}\quad ,$$
 $${f_{\rm{\alpha }}} = {{\left| {{\rm{OB}}} \right|} \over {\left| {{\rm{BC}}} \right|}}\quad .$$
Comparison of dilatometric curve between continuous cooling and Q&P in which the second martensitic transformation can be clearly identified, and the level rule can be used to calculate the fraction of different phases.
The volume fraction of untransformed austenite after the first martensitic transformation can be calculated by Eq. (1): f γ = 0.20.
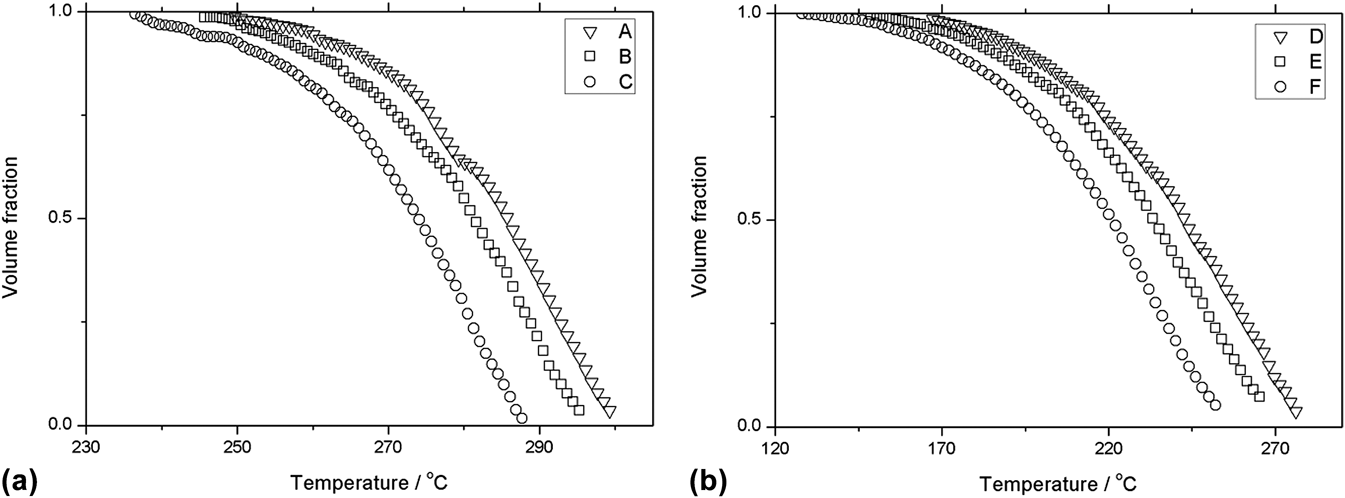
The martensite volume fraction as a function of temperature in the second martensitic transformation can be obtained by Eq. (2), and the results are displayed in Fig. 4. In Fig. 4, a series of sigmoid transformation curves describe the whole relationship between the volume fraction and the temperature either in one-step or in two-step Q&P, and the onset and end temperature are different.
The fraction of the martensite as a function of temperature during the second martensitic transformation during (a) one-step and (b) two-step Q&P heat-treatment.
B. Microstructure examination after Q&P
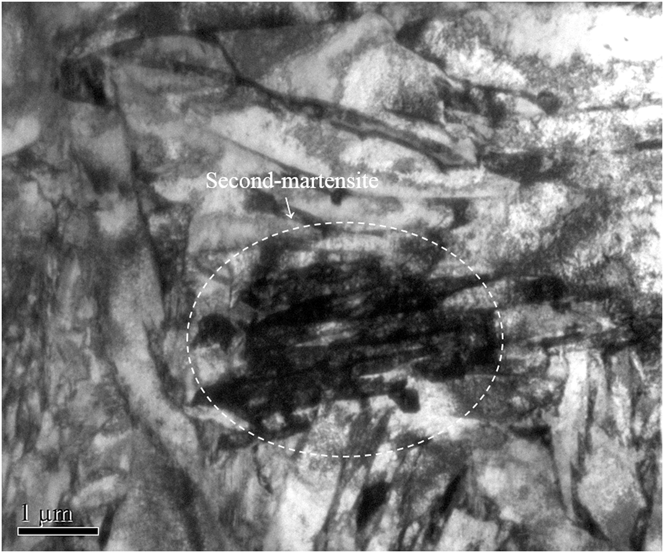
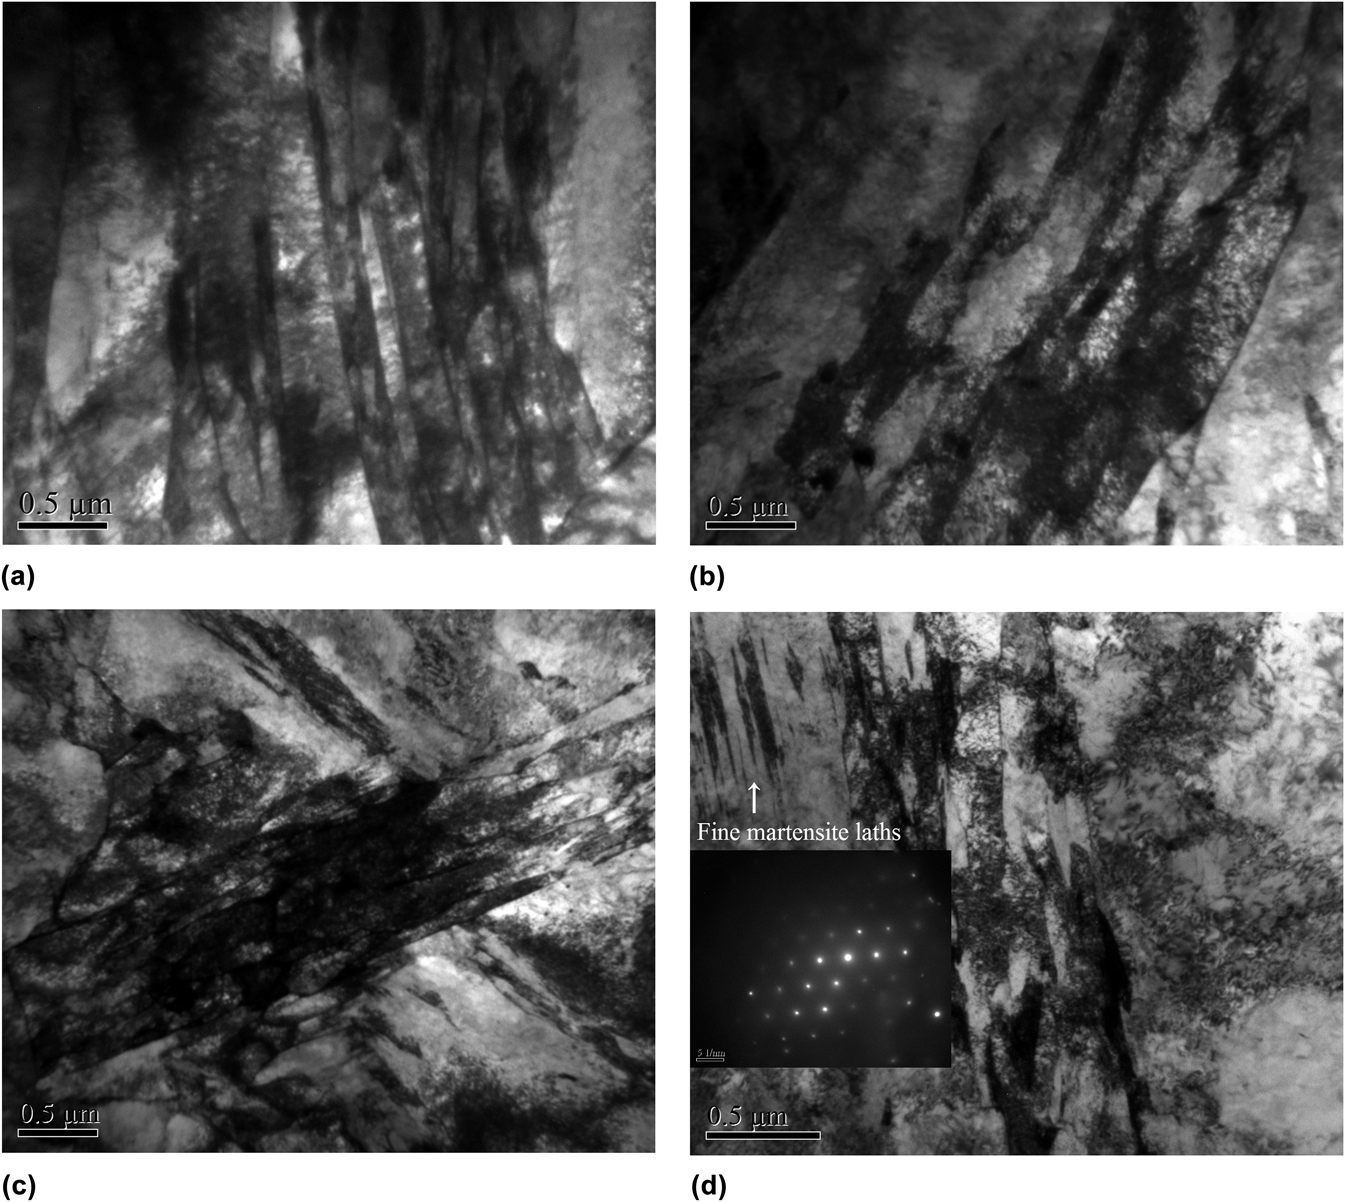
The TEM image of sample E treated by two-step Q&P is shown in Fig. 5, and carbide precipitates are not observed along martensite laths. As it has been mentioned above in Sec. III. A that there are two martensitic transformations during Q&P, the martensite laths indicated by dotted circle are believed to be produced in the second martensitic transformation by comparing morphology with the laths surrounding. The width of the second-martensite laths is shorter than that of the first-martensite laths, and the microstructure evolution during Q&P would be discussed in Sec. IV. B in detail. The microstructures of samples A, C, D, and F after the second martensitic transformation are shown in Fig. 6. It can be seen that the second-martensite laths have formed after both one-step and two-step Q&P process, and the width of laths decreases with increasing PT and prolonging holding time. In sample F, very fine martensite laths (width less than 1 μm) can be found as shown in Fig. 6(d), and the selected area electron diffraction is given. The formation of very fine martensite laths can be owing to the high carbon content in untransformed austenite after the first martensitic transformation.Reference Wang, Zhong, Rong, Hsu and Wang17
TEM image of the morphology after a two-step Q&P heat-treatment, where an area of refined and carbon-enriched lath martensite is found.
TEM images of the second martensite formed during Q&P heat treatment: (a) sample A, (b) sample C, (c) sample D, and (d) sample F. Very fine martensite laths are found in sample F.
IV. DISCUSSION
A. Thermodynamics of carbon partitioning at PT
There are two classical partitioning theories based on different assumptions for the partitioning of substitutional elements: (i) the local equilibrium modelReference Chen, Appolaire and van der Zwaag18 in which the interface is assumed to migrate with the partitioning of both C and substitutional elements; (ii) the paraequilibrium (PE) modelReference Speer, Matlock, De Cooman and Schroth19 in which the chemical potential of carbon in martensite should be as the same as that in austenite, and the substitutional elements are assumed to be immobile. Since long-range diffusion at low temperature is limited primarily to carbon atom movements,Reference Hultgren20 the PE model seems more suitable in this work.
In the PE model,Reference Chen, Appolaire and van der Zwaag18 the substitutional elements are supposed not to redistribute among the α/γ interface, whereas the chemical potential of C remains constant across the interface. Under PE condition, the relationship between the mole fraction of carbon in α and γ phases has been given in previous worksReference Speer, Matlock, De Cooman and Schroth19,Reference Hultgren20 :
 $$X{_{\rm{CPE}}^{\rm{\gamma }}}} = X{_{\rm{CPE}}^{\rm{\alpha }}}}}{\rm{e}}{\rm{xp}}\left( {{{76789 - 43.8T - \left( {169105 - 120.4T} \right)X{{_{\rm{CPE}}^{\rm{\gamma }}}}}} \over {{\rm{RT}}}}} \right)\quad ,$$
where  $X{_{\rm{CPE}}^{\rm{\alpha }}}}$ and
 $X{_{\rm{CPE}}^{\rm{\gamma }}}}$ are the PE mole fraction of carbon in α and γ phases, respectively, R is the universal gas constant, and T is the absolute temperature. Equation (3) describes a locus of phase compositions at any temperature. The total carbon can be given by aggregating the carbon content in each phase, with the conservation law of mass being applied:
 $${f_{\rm{\alpha }}}X{_{\rm{CPE}}^{\rm{\alpha }}} + {f_{\rm{\gamma }}}X{_{\rm{CPE}}^{\rm{\gamma }}} = X_{\rm{C}}^{{\rm{alloy}}}\quad ,$$
where  $X_{\rm{C}}^{{\rm{alloy}}}$ is the mole content of carbon in alloy.
The combination of Eqs. (3) and (4) can represent PE condition. It should be noted that the partitioning of carbon might alter the total number of atoms in each phase, thus changing the fraction of α and γ phases. Since this effect is too slight to be calculated, it is not addressed here.
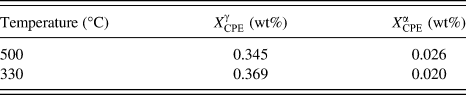
The solutions of Eqs. (3) and (4) at 500 and 330 °C are listed in Table II, and the result indicates that the partitioning of carbon from martensite to austenite would take place due to the same carbon content in either phase after the first martensitic transformation. The carbon contents in α and γ phases would reach the PE concentration if time is long enough.
Calculated PE carbon contents in martensite and austenite at 500 and 330 °C applying PE model.
B. Microstructural evolution during Q&P
The lath martensite, which is the most important structure in ferritic heat-resistance steel, is composed of substructures, i.e., packets and blocks. Different from plate martensite, the lath martensites do not traverse across prior-austenite grains during martensitic transformation.Reference Apple, Caron and Krauss21 The nucleation of martensite is heterogeneous and initially limited by the scarcity of available nucleation site, and it is autocatalyzed by internal boundaries, i.e., grain boundaries and martensite–austenite interfaces.Reference Guimarães and Rios22 For lath martensites, a packet is initiated by a nucleation event catalyzed by grain boundaries,Reference Morito, Saito, Ogawa, Furuhara and Maki23 thus, it is assumed that packets count as the units of martensitic transformation.Reference Guimarães and Rios22 The packets initially nucleate in prior-austenite grain boundaries and then grow into grains.
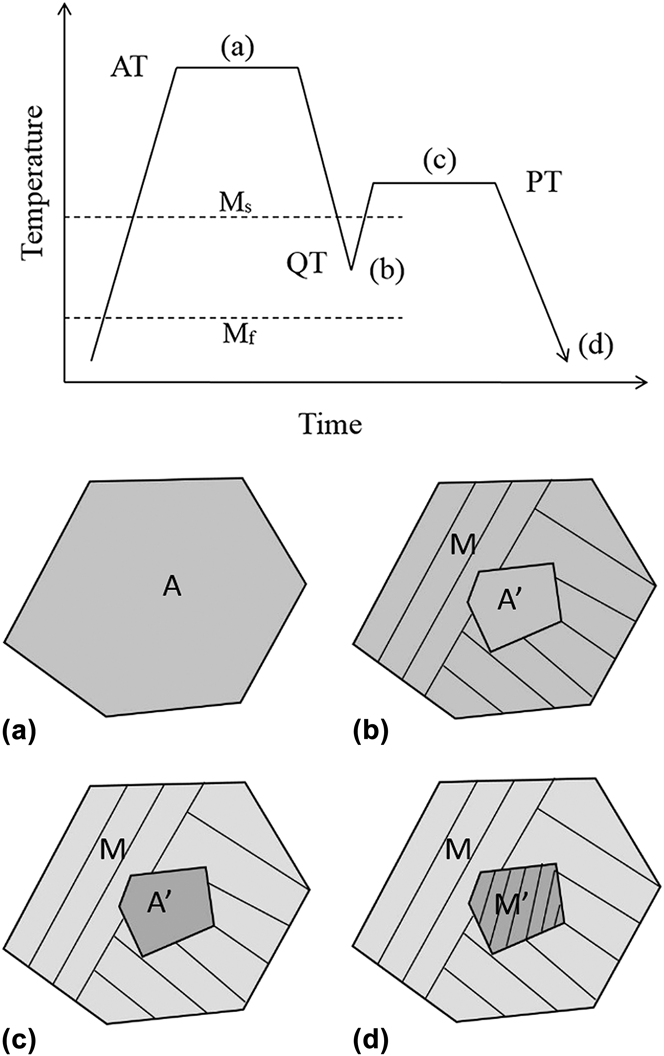
The microstructural evolution during Q&P is illustrated in Fig. 7. (i) After austenitization, homogeneous austenite grains are produced, with second phases dissolved. (ii) As the steel is quenched from full austenite structure to QT, the first martensitic transformation takes place, which is uncompleted because QT is higher than Mf. Since a unit of martensitic transformation is counted as a packet, which initially nucleates at grain boundaries and then grows gradually into grain center with the temperature decreasing, untransformed austenite would be retained in the grain with temperature cooling to QT. At this temperature, the carbon content in martensite and in untransformed austenite is the same. (iii) Then the steel is heated to PT at which carbon atoms escape from martensite into untransformed austenite following the partitioning kinetics, leading to the carbon enrichment in untransformed austenite. (iv) Finally, the steel is cooled down to RT during which the second martensitic transformation occurs and carbon-enriched untransformed austenite transformed to martensite. Both the Ms and Mf of the second martensitic transformation decrease and the martensite laths are refined due to the carbon enrichment.
Schematic image of the microstructure evolution, which consists of four steps: (a) austenitization, (b) first martensitic transformation, (c) carbon partitioning, and (d) second martensitic transformation.
D. The kinetics of second martensitic transformation below PT
1. Model derivation
a. Nucleation
Since the nucleation of martensite is time-dependent, the volume density of nucleation sites n V(T) is given byReference Guimarães and Rios22:
 $${n_{\rm{V}}}(T) = n_{\rm{V}}^0\left( {{{\Delta G - \Delta G({T^*})} \over {kT}}} \right)\quad ,$$
with ΔG as the chemical driving force available for phase transformation, T* the highest temperature at which nucleation sites become viable, k the Boltzmann constant,  $n_{\rm{V}}^0$ the value of n V at T = T*. The number of martensite units per unit volume N V(T) is equal to
 $\varsigma \cdot {n_{\rm{V}}}\left( T \right)$, where
 $\varsigma$ is a proportionality factor,Reference Guimarães and Rios22 suggesting that not all the nucleation sites turn into martensite units, and the value of the proportionality factor is difficult to obtain either by the experimental or theoretical methods.Reference Gao, Liu, Di, Yu and Yan24 Thus, the assumption that the number of martensite units per unit volume is equal to the volume density of nucleation sites is applied, and then it follows:
 $${N_{\rm{V}}}(T) = N_{\rm{V}}^{\rm{0}}\left( {{{\Delta G - \Delta G({T^*})} \over {kT}}} \right)\quad .$$
Substituting a well-known approximation,  $\Delta G = \left| {\Delta S} \right|({T_{{\rm{eq}}}} - T)$,Reference Mittemeijer16 where T eq is the temperature at which martensite is in equilibrium with austenite, ΔS is the martensitic transformation entropy, the final description for martensite unit number per unit volume can be obtained as follows:
 $${N_{\rm{V}}}(T) = N_{\rm{V}}^0\left( {\left| {{{\Delta S} \over k}} \right| \cdot {{{T^*} - T} \over T}} \right)\quad .$$
b. Growth
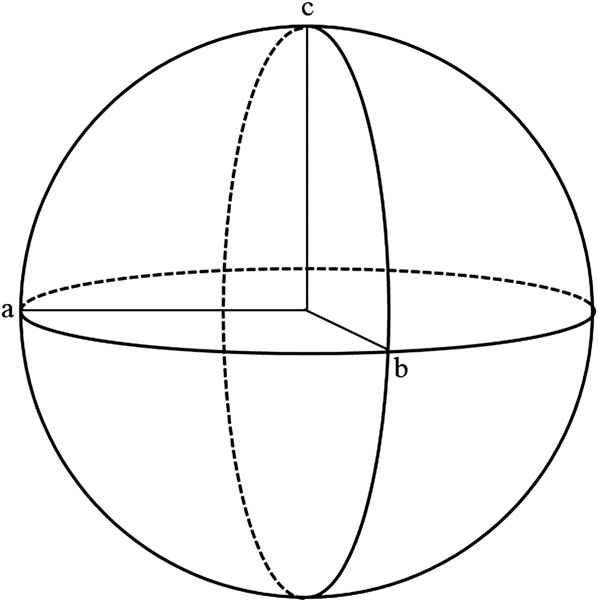
Assume that the shape of martensite lath is ellipsoid as illustrated in Fig. 8. a, b, and c are the three axes of the ellipsoid, where a = b > c. The mean volume of one martensite unit in extended space is obtained as
 $${{\rm{\nu }}_{\rm{e}}} = {4 \over 3}{\rm{\pi }}abc = {4 \over 3}{\rm{\pi }}{r^2}w = {4 \over 3}{\rm{\pi }}{r^3}{\rm{\alpha }}\quad {\rm{,}}$$
where r = a = b is the half-length of the martensite lath, w = c is the half-width of the martensite lath, and  ${\rm{\alpha }} = {\textstyle{w \over r}}$ is the aspect ratio of martensite lath. The mean volume of the untransformed austenite grains at QT is small, and they are directly segmented by martensite laths generated during the second martensitic transformation.Reference Morito, Saito, Ogawa, Furuhara and Maki23 Thus, r is also equal to the mean diameter of the untransformed austenite grains, and then νe = αq′, where q′ is the mean volume of untransformed austenite grains. The equation
 $q\prime = {f_{\rm{\gamma }}} \cdot q$ is then used to simplify the calculation. And Eq. (8) finally turns into
 $${{\rm{\nu }}_{\rm{e}}} = {f_{\rm{\gamma }}} \cdot aq\quad {\rm{,}}$$
where q is the mean volume of prior-austenite grains.
Schematic image of a martensite lath, which is ellipsoid.
The extended volume fraction can be obtained by the following equation:
 $${X_{\rm{e}}} = {N_{\rm{V}}} \cdot {{\rm{\nu }}_{\rm{e}}} = {f_{\rm{\gamma }}} \cdot {\rm{\alpha }}qN_{\rm{V}}^{\rm{0}}\left( {\left| {{{\Delta S} \over k}} \right| \cdot {{{T^*} - T} \over T}} \right)\quad .$$
c. Impingement
The equation between volume fraction and extended volume fraction can be derived based on the classical Johnson–Mehl–Avrami–Kologoromov (JMAK) equationReference Avrami25,Reference Avrami26 :
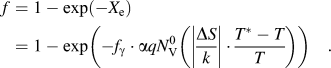 $$f = 1 - \exp \left( { - {X_{\rm{e}}}} \right) = 1 - \exp \left( { - {f_{\rm{\gamma }}} \cdot {\rm{\alpha }}qN_{\rm{V}}^{\rm{0}}\left( {\left| {{{\Delta S} \over k}} \right| \cdot {{{T^*} - T} \over T}} \right)} \right)\quad .$$
2. Model application and parameters discussion
As indicated in Eq. (11), the model of the second martensitic transformation is associated with several parameters, such as  ${f_{\rm{\gamma }}}$,
 $q,N_{\rm{V}}^{\rm{0}}$$$$\left| {{\textstyle{{\Delta S} \over k}}} \right|$, α, and T*. The f γ can be calculated from the change of thermal dilation; q can be calculated by
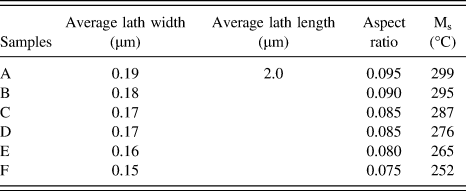
 $q = {\textstyle{4 \over 3}}{\rm{\pi }}{r_{\rm{\gamma }}}^3$, where r γ is the mean radius of prior-austenite grains; α can be calculated by dividing the width by length of martensite laths which can be measured from TEM images; although the value of T* is just above the martensite start temperature,Reference Van Bohemen and Sietsma27 it is assumed that
 ${T^*} \cong {{\rm{M}}_{\rm{s}}}$ for convenience. The values of Ms and α are listed in Table III.
 $N_{\rm{V}}^{\rm{0}}$ and
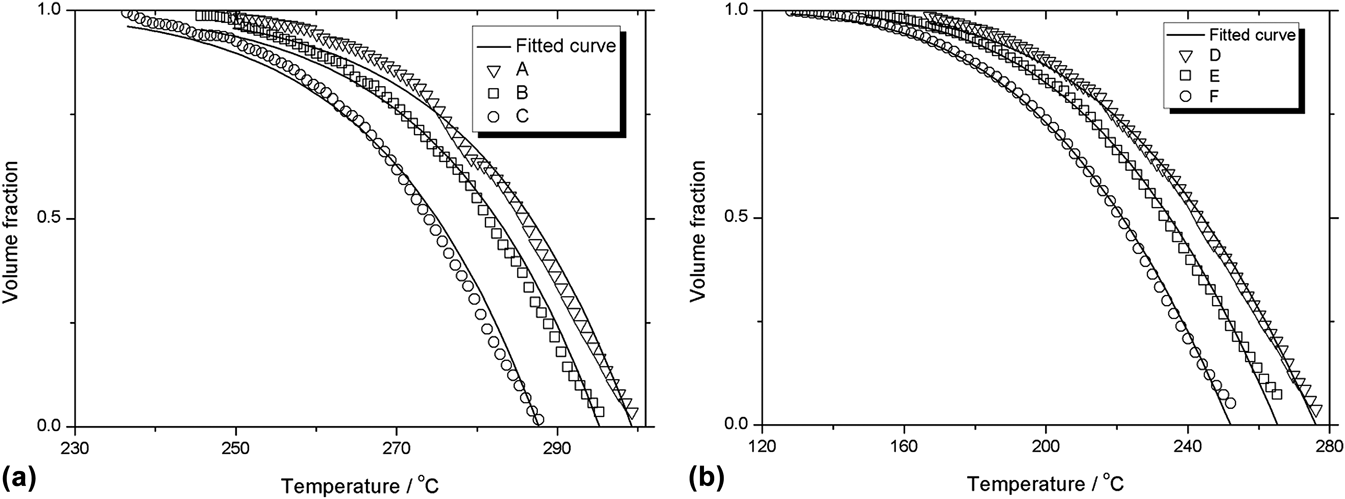
 $\left| {{\textstyle{{\Delta S} \over k}}} \right|$ are the two variables which can be obtained by fitting Eq. (11) with experimental data. A series of fitted sigmoid curves are shown in Fig. 9, which are consistent with the experimental data. The fitted value of
 $N_{\rm{V}}^{\rm{0}}$,
 $\left| {{\textstyle{{\Delta S} \over k}}} \right|$, and standard deviation (SD) are listed in Table IV.
Values of Ms and α in second martensitic transformation.
Fitted curves with experimental data of second martensitic transformation in (a) one-step Q&P and (b) two-step Q&P.
Fitted value of  $N_{\rm{V}}^{\rm{0}}$,
 $\left| {{\textstyle{{\Delta S} \over k}}} \right|$, and SD.
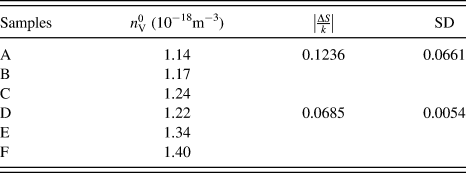
The retardation of the starting and finishing temperatures of the second martensitic transformation is clearly shown in Table III. Carbon portioning at PT would lead to the carbon enrichment in the untransformed austenite, and larger super-cooling degree is required to drive the transformation for more stable austenite. It should be noted that  $N_{\rm{V}}^0$ increases as holding time prolongs and holding temperature increases along with the decrease of average width of martensite laths. It is suggested that elevated temperature can accelerate the partitioning rate of carbon and lead to the carbon enrichment in untransformed austenite. Previous workReference Foroozmehr, Najafizadeh and Shafyei28 has proved that high carbon content in austenite would refine martensitic structure, including packets, blocks, and laths. Laths are produced by autocatalysis, and significant plastic accommodation might occur in austenite matrix to relieve transformation strain.Reference Bowles and Dunne29 As carbon content in austenite increases, the strain of martensitic transformation could not be easily relieved by plastic accommodation, which is associated with the higher strength of austenite due to solid solution hardening by higher carbon content and lower transformation temperature. Considering this, more laths should be produced to relieve the strain, thus causing the refinement of laths.Reference Bokros and Parker30
The martensitic transformation entropy can be represented by the following equationReference Ren, Miura, Zhang, Otsuka, Tanaka, Koiwa, Suzuki, Chumlyakov and Asai31:
 $$\Delta S = - Ae_{\rm{M}}^2\quad ,$$
where e M is the lattice distortion (or transformation strain) at transformation temperature, A(>0) is a coefficient dependent on compositions and not very sensitive to temperature. It is indicated clearly in Eq. (12) that decrease of entropy always takes place during martensitic transformation, and the magnitude of entropy change associated with martensitic transformation is proportional to the square of transformation strain. Therefore, transformation entropy is mainly determined by transformation strain. Since samples treated by two-step Q&P are thermally held at 500 °C (higher than 330 °C), the dispersion of solute atoms is more homogeneous than that in samples treated by one-step Q&P, leading to less strain accumulated during transformation. In addition, high temperature is conducive to relief of the strain accumulated during the first martensitic transformation, which can affect the transformation strain during the second martensitic transformation. Therefore, the value of  $\left| {{\textstyle{{\Delta S} \over k}}} \right|$ in samples A, B, and C is higher than that in samples D, E, and F. The high values of SD in samples A, B, and C are caused by the fluctuation of dilatometric date due to the large strain and solute inhomogeneity in one-step Q&P.
V. CONCLUSIONS
One-step and two-step Q&P heat treatments are applied to 9Cr–1.8W–0.3Mo ferritic heat-resistant steel during which carbon partitioning, microstructure evolution, and martensitic transformation behavior are investigated:
(1) The phase transformation during the Q&P process is examined by high-resolution differential dilatometer, and accurate information of phase transformation can be obtained. Microstructures of the second-martensite are examined by TEM, and the refined martensite laths can be detected.
(2) During the first martensitic transformation, a packet is considered as the unit of martensite, which nucleates at prior-austenite grain boundaries and grows into grains. The first martensitic transformation ceases when the temperature drops down to QT, leading to the retaining of untransformed austenite in the center of prior-austenite grains.
(3) Carbon partitioning from martensite into untransformed austenite takes place as the temperature is kept at PT in which case the PE concentration of carbon follows the rule of PE model. The carbon partitioning leads to the carbon enrichment in untransformed austenite.
(4) The second martensitic transformation takes place as the temperature decreases from PT to RT, and the kinetic model is developed. The retardation of onset and end temperature of the second transformation is the result of austenite stabilization caused by carbon enrichment. The laths formed during the second transformation is finer, which is consistent with the value of
 $N_{\rm{V}}^{\rm{0}}$. The magnitude of entropy change is proportional to the square of transformation strain, which is in agreement with the difference of $\left| {{\textstyle{{\Delta S} \over k}}} \right|$ in one-step and two-step Q&P.


ACKNOWLEDGMENTS
The authors are grateful to the National Natural Science Foundation of China (Grant Nos. 50834011, 51204121, and 51104107) and the Major State Basic Research Development Program (973 Program) (No. 2014CB046805) for grant and financial support.