Introduction
Imposex (i.e. the superimposition of male sexual characteristics – penis included – onto female gastropods; Smith, Reference Smith1971) has been reported for hundreds of species worldwide (e.g. Shi et al., Reference Shi, Huang, Zhu, Yu and Xie2005). The firm link established between this anomaly and tributyltin (TBT) pollution from antifouling paints led OSPAR (the Convention for the Protection of the Marine Environment of the NE Atlantic) to include its recording within the mandatory monitoring programme (OSPAR, 2004). The species recommended was Nucella lapillus (L.) (a rocky shore carnivore, see Bryan et al., Reference Bryan, Gibbs, Hummerstone and Burt1986), but others such as Tritia reticulata (L.) (a soft-bottom carrion feeder, see Stroben et al., Reference Stroben, Oehlmann and Fioroni1992) were also proposed; even if imposex is largely irreversible, its monitoring is an effective way of assessing changes in TBT effects at the population level. Many works have since shown imposex decrease as a result of legal restrictions, both within the OSPAR area (Guomundsdottir et al., Reference Guomundsdottir, Ho, Lam, Svavarsson and Leung2011; Wilson et al., Reference Wilson, Minchin, McHugh, McGovern, Tanner and Giltrap2015; Laranjeiro et al., Reference Laranjeiro, Sanchez-Marin, Oliveira, Galante-Oliveira and Barroso2018) and beyond (Harding et al., Reference Harding, Unger, Mann, Jestel and Kilduff2013; Kim et al., Reference Kim, Hong, Shin and Shim2017; Cacciatore et al., Reference Cacciatore, Brusa, Noventa, Antonini, Moschino, Formalewicz, Gion, Berto, Gabellini and Marin2018).
In Galicia (NW Spain) we started monitoring TBT at a regional scale with N. lapillus and T. reticulata in 1996 and 2000, respectively. Results over more than one decade have proved substantial improvement as determined by both the TBT body burden (Ruiz et al., Reference Ruiz, Albaina, Carro and Barreiro2015) and some partial imposex observations (Ruiz et al., Reference Ruiz, Carro, Albaina, Couceiro, Quintela and Barreiro2017). This continued effort has also compiled some considerable databases on biometric and imposex indices that deserve further exploration. Thus, the present work aims at detailing and summarizing this regional study to produce some insights on both basic marine biology features and their potential application to pollution monitoring.
Materials and methods
Sampling and imposex assessment
Nucella lapillus
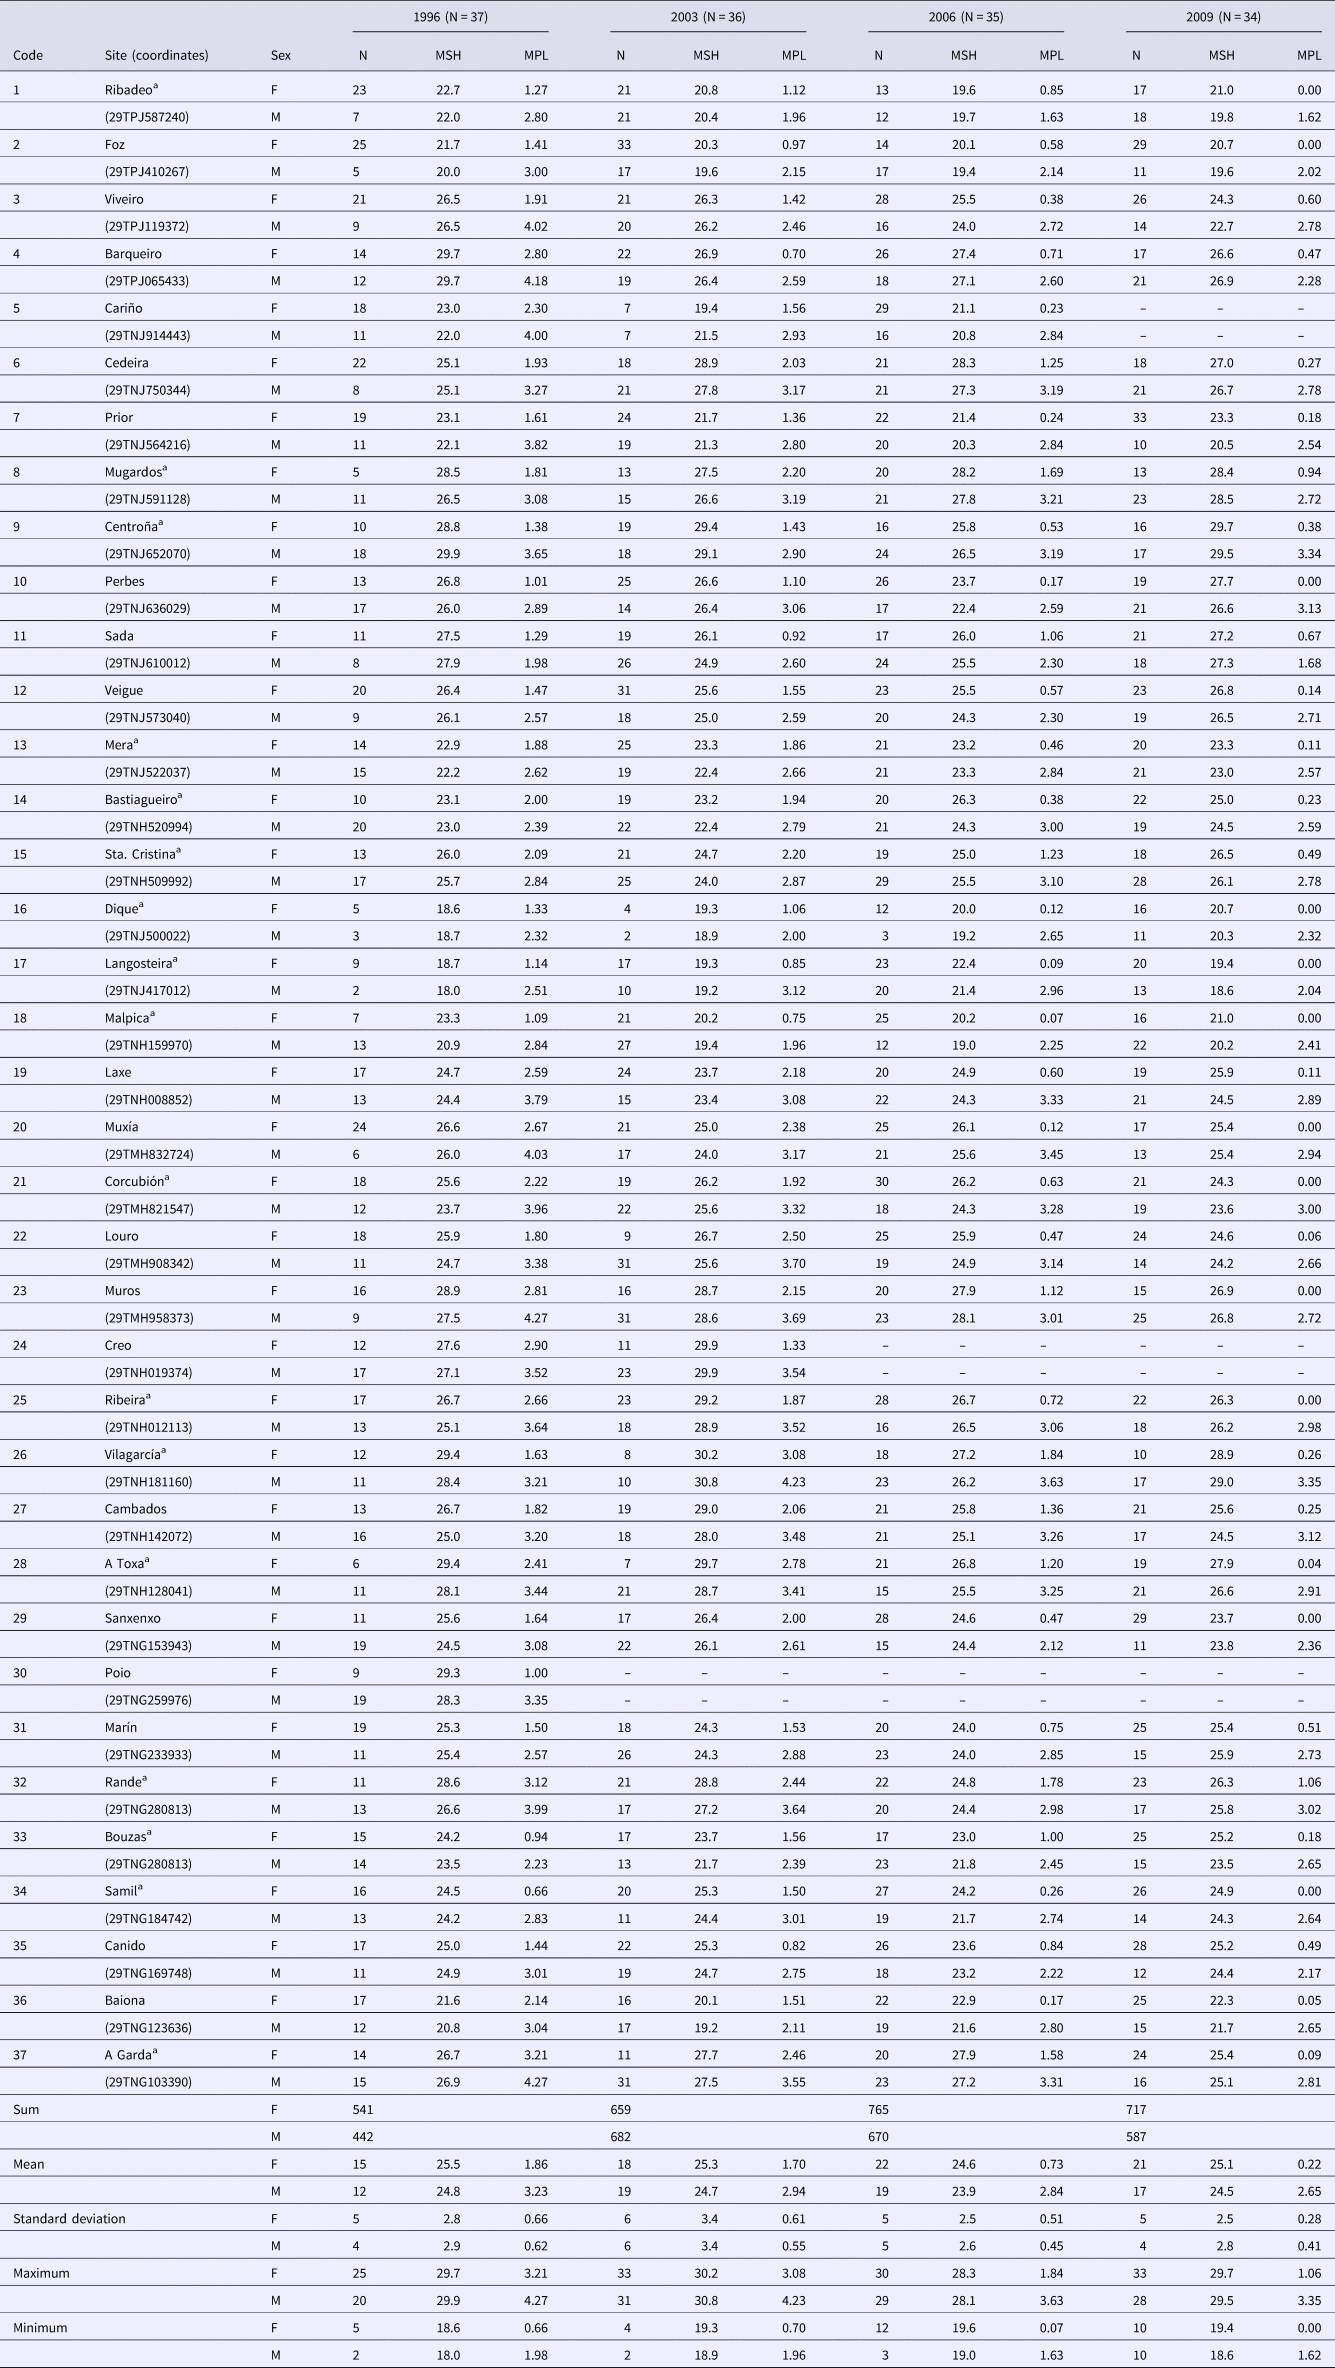
The baseline survey for this species was conducted in July–September of 1996 and sampled 37 populations; their location is detailed in a print map and a Google one (see Ruiz et al., Reference Ruiz, Quintela and Barreiro1998, Reference Ruiz, Carro, Albaina, Couceiro, Quintela and Barreiro2017, respectively), and their UTM coordinates are given in Table 1. All of them were revisited in the summer of 2003 and every 3 years thereafter, but unknown factors precluded the collection of a sufficient sample in one site per subsequent summer campaign (i.e. N = 37, 36, 35 and 34, respectively for 1996, 2003, 2006 and 2009). The collection and treatment of specimens is described in Ruiz et al. (Reference Ruiz, Quintela and Barreiro1998, Reference Ruiz, Carro, Albaina, Couceiro, Quintela and Barreiro2017), where full details (including maps, shell and penis measurements, and participation in QUASIMEME international ring tests) have been previously published. Briefly, sampling by hand during low tide aimed at collecting ≥30 toothed (i.e. adult) animals, which were within a few hours transported in a cooler to the laboratory. They were there kept in aquaria with seawater (35 psu, 15 ± 1 °C) for a minimum of 24 h before dissection under a stereo microscope; evidently parasitized specimens were rejected. Finally, opercula were removed and each sex was pooled per site in vials that were frozen until the chemical analysis of female tissues (see results in Ruiz et al., Reference Ruiz, Albaina, Carro and Barreiro2015). Shell height (SH) was measured to the nearest 0.01 mm with digital callipers before extracting the soft parts for close examination; only specimens within an established SH range (from 17.5 to 32 mm, see Ruiz et al., Reference Ruiz, Carro, Albaina, Couceiro, Quintela and Barreiro2017, for rationale) are dealt with here. Every penis length (PL) was gauged as above for SH and imposex assessed as proposed by Gibbs et al. (Reference Gibbs, Bryan, Pascoe and Burt1987) and recommended by OSPAR (2003); aphallic females were classified according to a very similar scheme by Barreiro et al. (Reference Barreiro, Quintela and Ruiz1999). The parameters determined in individual samples were: (i) The incidence or percentage of females with any sign of imposex (I%). (ii) The mean female penis length (MFPL). (iii) The mean male penis length (MMPL). (iv) The relative penis size index (RPSI = 100 × [MFPL3/MMPL3]). (v) The vas deferens (VD) sequence index (VDSI): the arithmetic mean of all the vas deferens sequence (VDS) values (integers from 0 to 6) assigned to single females. The first indication of imposex in this species (and therefore the individual VDS score of 1) typically is the proximal section of the VD. The VDSI data reported here have been previously published by Ruiz et al. (Reference Ruiz, Carro, Albaina, Couceiro, Quintela and Barreiro2017).
Biometric data for samples of Nucella lapillus collected along four surveys, including code and site (with UTM coordinates) of the populations studied, sex (F for female and M for male) and number of individuals selected (N), mean shell height (MSH, mm), mean penis length (MPL, mm) and summary statistics

Female N and MSH were first published by Ruiz et al. (Reference Ruiz, Carro, Albaina, Couceiro, Quintela and Barreiro2017).
a Butyltin tissue concentrations were repeatedly determined in these 17 sites, see Ruiz et al. (Reference Ruiz, Albaina, Carro and Barreiro2015).
Tritia reticulata
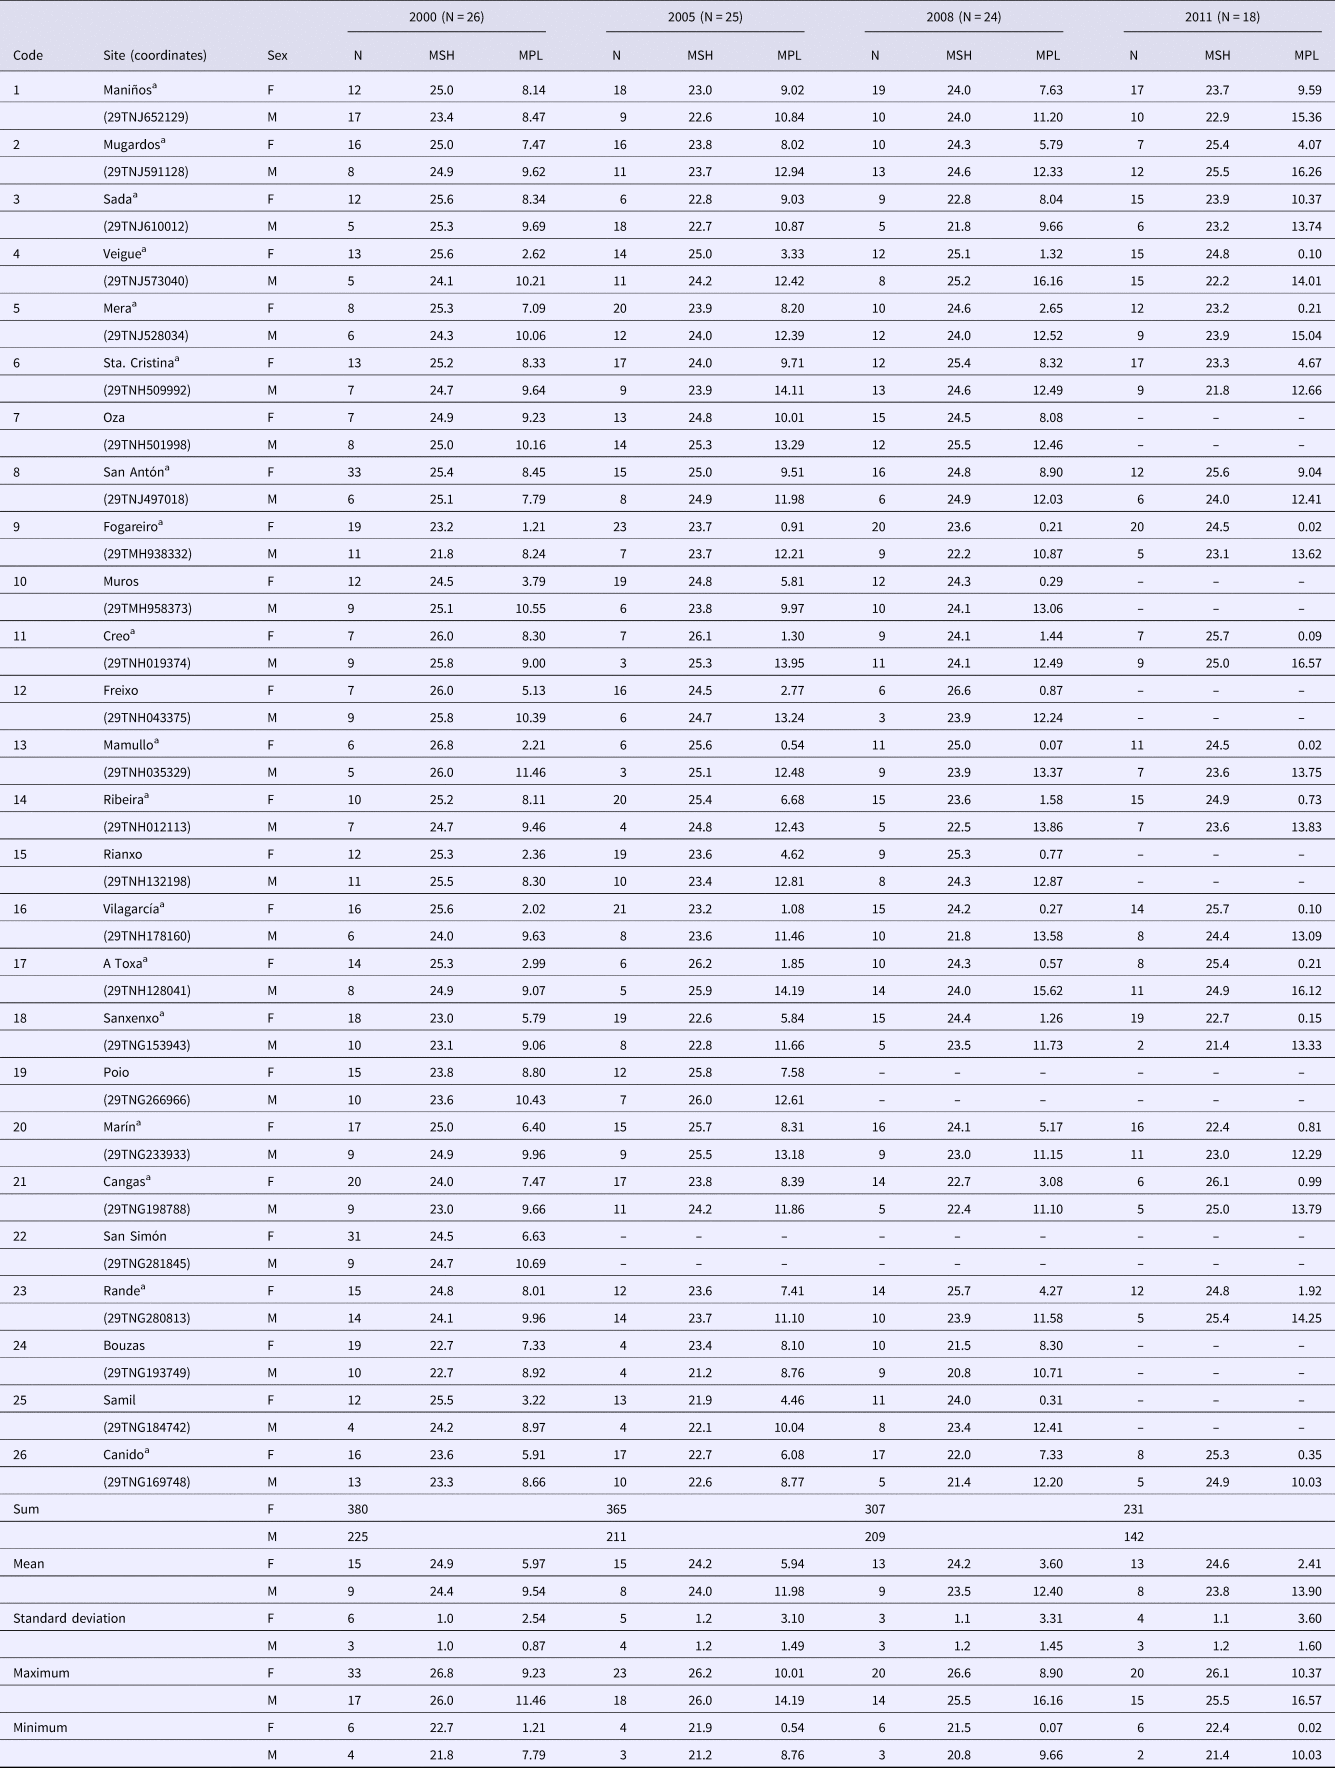
Our first regional survey with this species was carried out during February and March of 2000 and included 26 populations; their position is detailed in a print map and a Google one (see Ruiz et al., Reference Ruiz, Barreiro and González2005, Reference Ruiz, Carro, Albaina, Couceiro, Quintela and Barreiro2017, respectively), and their UTM coordinates are given in Table 2. All sites were resampled in the same months of 2005 and 2008, but unknown factors led to the collection of an insufficient number of animals in one site per subsequent winter campaign (i.e. N = 26, 25 and 24, respectively for 2000, 2005 and 2008). In addition, the number of sampling localities in a last winter survey (2011) was reduced down to 18 due to financial constraints. Gastropods were collected and treated as detailed in Ruiz et al. (Reference Ruiz, Barreiro and González2005, Reference Ruiz, Carro, Albaina, Couceiro, Quintela and Barreiro2017), where full details (including maps, shell and penis measurements, and participation in QUASIMEME international ring tests) have been previously published. In summary, at least 30 of the largest specimens were collected by hand during low tide and transported to the laboratory within a few hours. They were depurated in aquaria with seawater (18 psu, 12 ± 1 °C) for at least 48 h before being processed as for the species above (see the results of chemical analyses in Ruiz et al., Reference Ruiz, Albaina, Carro and Barreiro2015), the only difference being that T. reticulata needed to be narcotized for examination. Only specimens within an established SH range (from 20–27 mm, see Ruiz et al., Reference Ruiz, Carro, Albaina, Couceiro, Quintela and Barreiro2017) are dealt with here. Imposex was gauged according to Stroben et al. (Reference Stroben, Oehlmann and Fioroni1992) and OSPAR (2003), as described in Barreiro et al. (Reference Barreiro, González, Quintela and Ruiz2001). The following parameters in individual samples were determined much as for Nucella lapillus above: I%; MFPL; MMPL; the relative penis length index (RPLI = 100 × [MFPL/MMPL]); and VDSI (integers from 0 to 4). The first indication of imposex in this species (and therefore the singular VDS score of 1) develops distally, and consists almost always of a tiny penis behind the right tentacle. The VDSI data reported here have been previously published by Ruiz et al. (Reference Ruiz, Carro, Albaina, Couceiro, Quintela and Barreiro2017).
Biometric data for samples of Tritia reticulata collected along four surveys, including code and site (with UTM coordinates) of the populations studied, sex (F for female and M for male) and number of individuals selected (N), mean shell height (MSH, mm), mean penis length (MPL, mm) and summary statistics

Female N and MSH were first published by Ruiz et al. (Reference Ruiz, Carro, Albaina, Couceiro, Quintela and Barreiro2017).
a Butyltin tissue concentrations were repeatedly determined in these 18 sites, see Ruiz et al. (Reference Ruiz, Albaina, Carro and Barreiro2015).
Statistical treatment
After checking for normality and variance homogeneity, the mean shell height of both females and males (MFSH and MMSH, respectively) in the four surveys per species (N = 34–37 and N = 18–26 for Nucella lapillus and Tritia reticulata, respectively, see above) were subject to parametric ANOVA in order to explore differences within sex. Later, differences between sexes were checked with a pairwise contrast per species, either a parametric t-test when datasets were normally distributed or a Mann–Whitney (Wilcoxon) W-test (MWW) when sets were not so.
As for all the other variables considered (MFPL, MMPL, I%, RPSI, RPLI and VDSI), their change over time was explored as in Ruiz et al. (Reference Ruiz, Carro, Albaina, Couceiro, Quintela and Barreiro2017) for VDSI with pairwise contrasts testing for differences between every couple of consecutive surveys. In addition, for these tests to be as robust as possible, the number of populations considered in each contrast equalled to the lowest of each pair of successive surveys: N = 36 for 1996 vs 2003, N = 35 for 2003 vs 2006, and N = 34 for 2006 vs 2009 (for N. lapillus); and N = 25 for 2000 vs 2005, N = 24 for 2005 vs 2008, and N = 18 for 2008 vs 2011 (for T. reticulata). The significance levels are depicted below as NS, *, ** and ***, respectively for P > 0.05, P < 0.05, P < 0.01 and P < 0.001. It has to be noted that non-parametric methods are generally considered to be simpler and more robust than parametric ones but, in turn, the latter are more powerful.
Results
Nucella lapillus
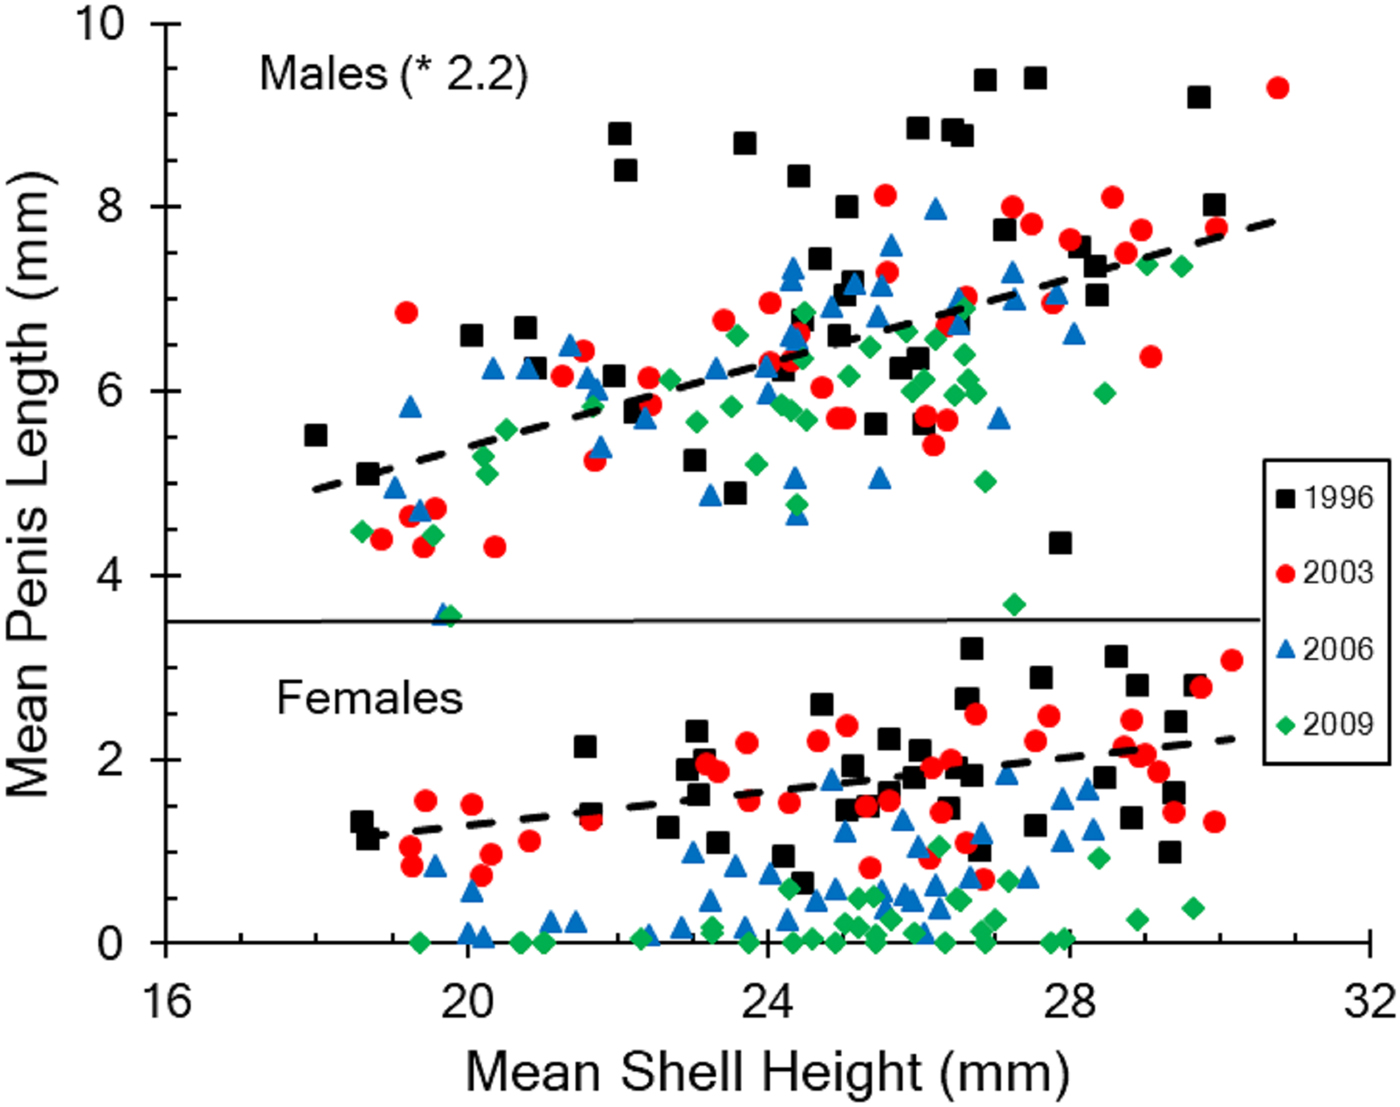
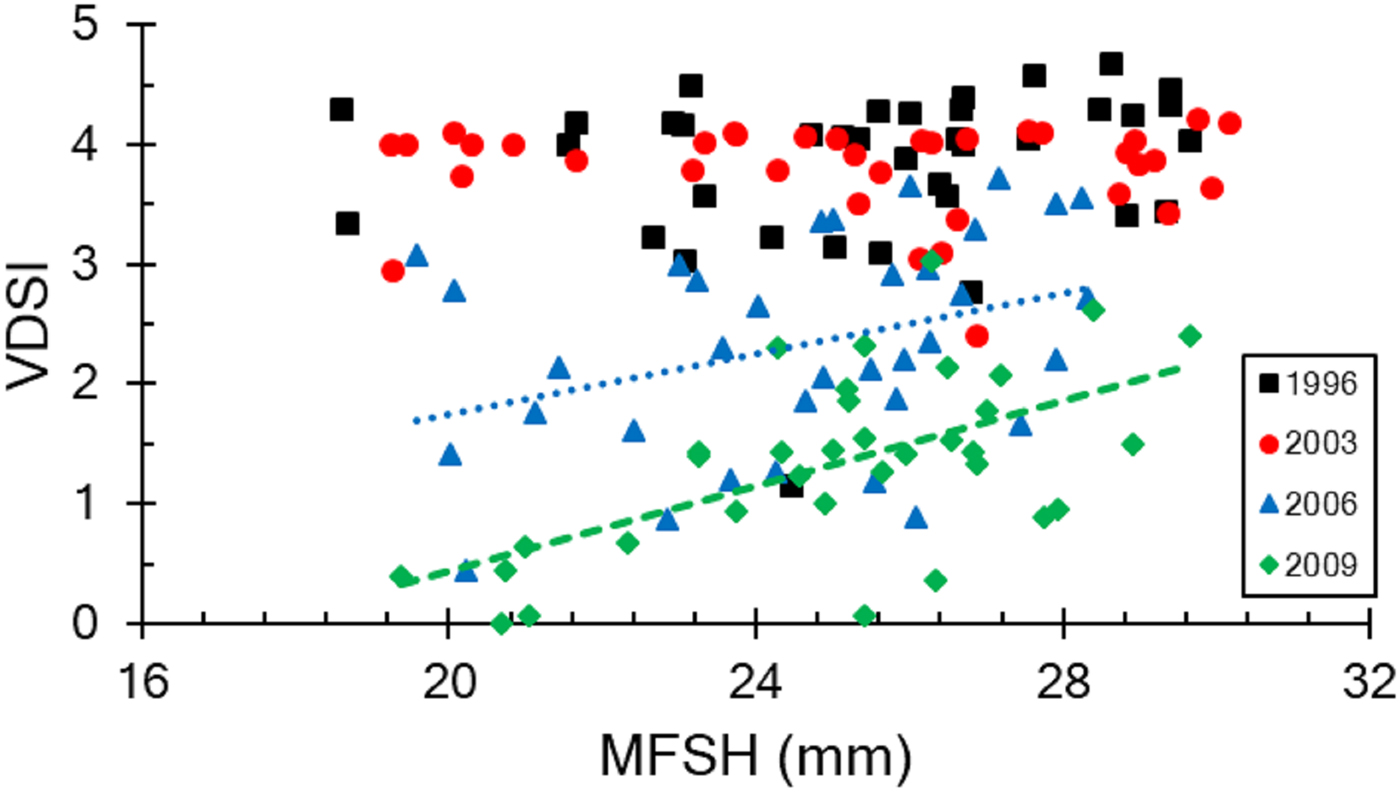
Biometric results for the four surveys with this gastropod (N = 37, 36, 35 and 34, respectively for 1996, 2003, 2006 and 2009) are shown in Table 1; they all refer to specimens of the selected size (i.e. SH from 17.5–32 mm). A total of 5063 individuals distributed over 142 samples were considered, and in only 8 out of them there were fewer than 6 representatives of either sex. The mean number of animals computed per site in each campaign ranged from 15 ± 5 to 22 ± 5 and from 12 ± 4 to 19 ± 6, respectively for females and males. The mean shell height for females (MFSH) and males (MMSH) ranged from 24.6 ± 2.5 to 25.5 ± 2.8 and from 23.9 ± 2.6 to 24.8 ± 2.9, respectively. This variation, however, did not result in significant MSH differences within sex along the four surveys (ANOVA, F = 0.64 and 0.68, respectively for MFSH and MMSH, P > 0.5 in both cases); the differences between sexes were neither statistically relevant (MWW test for N = 142, NS). As for the mean penis length, in 1996 the regional MFPL was 1.86 ± 0.66 (N = 37), and the situation showed little change by the onset of the 2003 EU total TBT ban (1.70 ± 0.61, t test for N = 36, NS). However, this regulation quickly caused MFPL to decrease at virtually all sites, so that the regional average significantly diminished in 2006 (0.73 ± 0.51, t test for N = 35, ***) and further from here to 2009 (0.22 ± 0.28, MWW test for N = 34, ***), when 12 samples were for the first time composed of only penis-free females. On the other hand, MMPL appeared to decrease from 1996 (3.23 ± 0.62, N = 37) to 2003 (2.94 ± 0.55), but differences were not significant (MWW test for N = 36, NS); thereafter it remained quite similar in 2006 (2.84 ± 0.45, t test for N = 35, NS) and 2009 (2.65 ± 0.41, t test for N = 34, NS). This may be better appreciated in Figure 1 plotting the mean penis length in all samples of both sexes vs their corresponding mean shell height; MMPL values in Table 1 have been multiplied by 2.2 for a better view. There was a significant linear relationship for males (N = 142, R 2 = 0.30, ***) and for each one of the three female groups as well: 1996–2003 (N = 73, R 2 = 0.20, ***), 2006 (N = 35, R 2 = 0.31, ***) and 2009 (N = 34, R 2 = 0.19, **).
Biometric and imposex indices. Plot of the mean penis length in males (MMPL, top) and females (MFPL, bottom) against their corresponding mean shell height in samples of Nucella lapillus collected along four surveys. Trend lines are shown only for males and the homogeneous female group resulting from pooling together data from the first two campaigns, see text for further explanation.

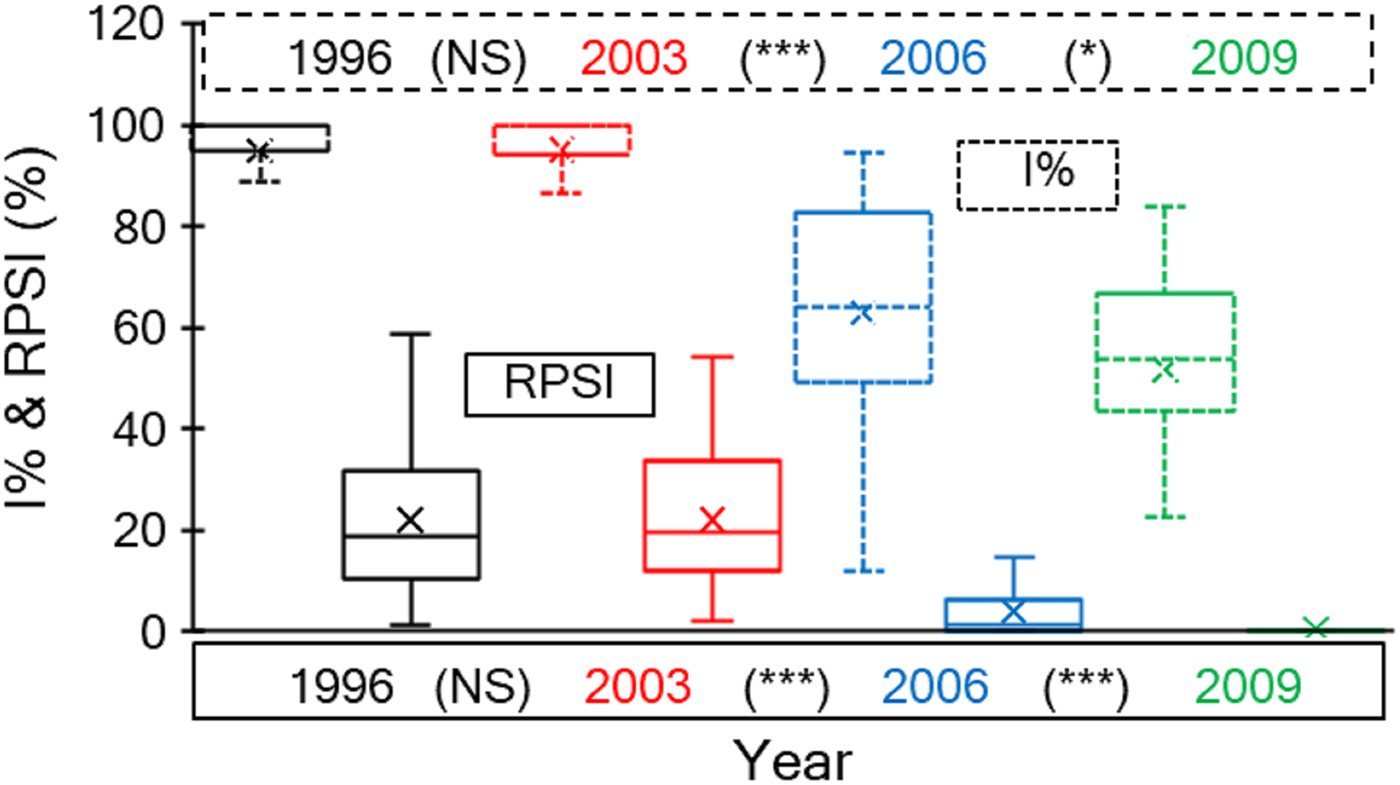
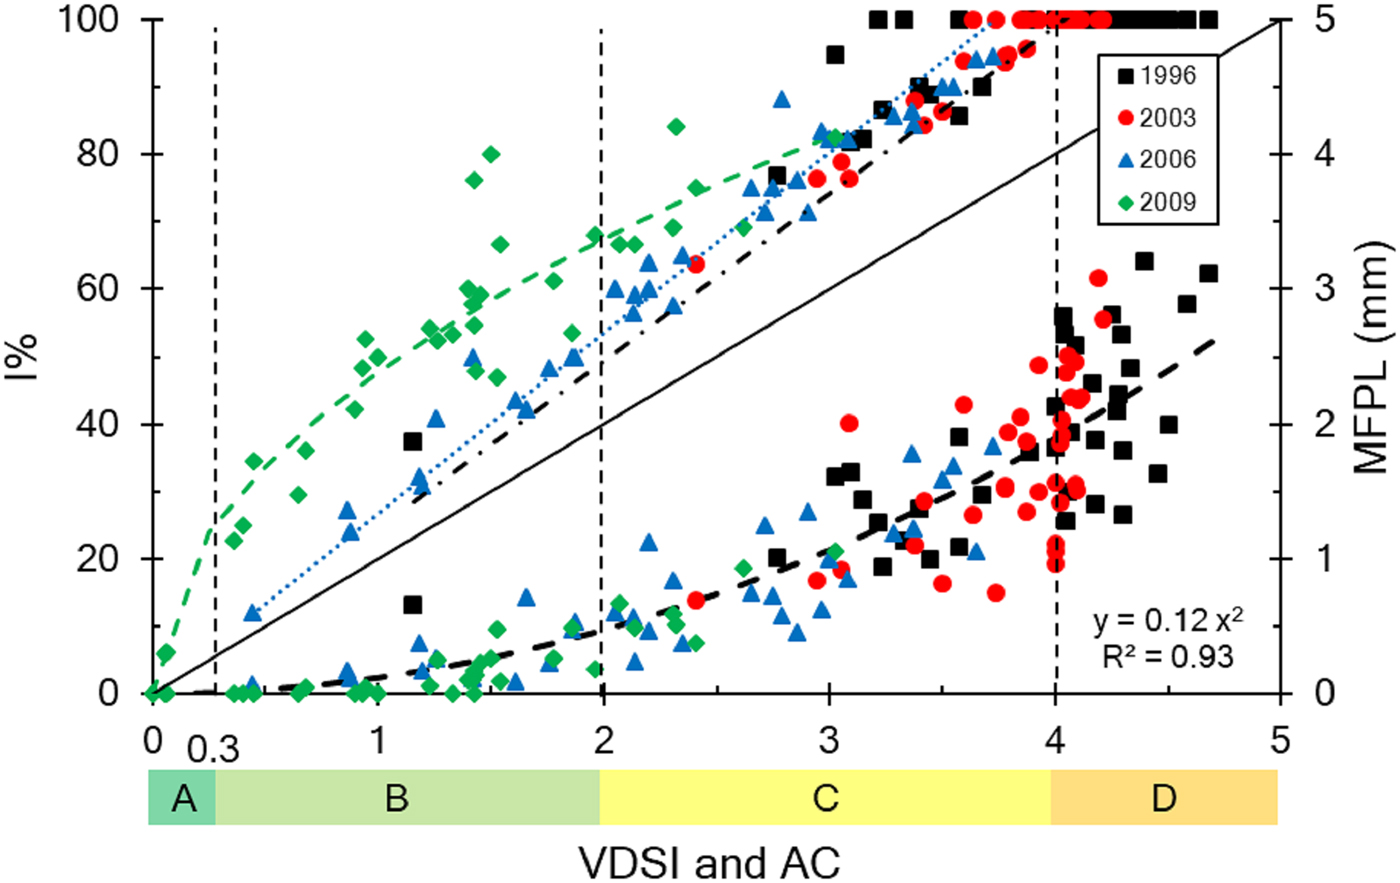
Supplementary Table S1 collects the values of all three imposex indices; those for RPSI in 1996 were first published by Ruiz et al. (Reference Ruiz, Quintela and Barreiro1998), but some may be different here because now we have computed all females within the established SH range (see above). The evolution of I% and RPSI along these 13 years closely mirrors the VDSI decrease first published in Ruiz et al. (Reference Ruiz, Carro, Albaina, Couceiro, Quintela and Barreiro2017), and can be better appreciated in Figure 2. Values for I% were highest in 1996 (95 ± 12, N = 37) and 2003 (95 ± 9), with no significant differences between them (MWW test for N = 36, P > 0.05). However, they declined later in 2006 (63 ± 22, MWW test for N = 35, ***) and further from here to 2009 (52 ± 22, t test for N = 34, *). Similarly, RPSI was topmost in 1996 and 2003 (22.10 ± 14.93 and 22.12 ± 14.08, respectively, t test for N = 36, NS) and decreased in 2006 (3.95 ± 5.33, MWW test for N = 35, ***) and again in 2009 (0.57 ± 1.43, MWW test for N = 34, ***). RPSI values in the first of these three groups (1996–2003, N = 73) did not correlate with the corresponding MFSH, but later there was a significant (if weak) relationship for both 2006 (N = 35, R 2 = 0.13, *) and 2009 (N = 34, R 2 = 0.13, *) (figures not shown). The same circumstance was observed when plotting VDSI vs MFSH (Figure 3): there was no relationship in 1996–2003 (N = 73) but subsequently the linear relationship was significant in 2006 (N = 35, R 2 = 0.13, *) and moderately strong in 2009 (N = 34, R 2 = 0.35, ***). Finally, the concomitance between imposex measurements in all samples is summarized in Figure 4. The close fit between I% and their corresponding VDSI is adequately described in two of the groups established (i.e. 1996–2003, and 2006) by a simple linear model, with similar slope (25.72 ± 1.39) and strength (R 2 > 0.99, ***) in either case. Linearity would also be appropriate for the third group (i.e. 2009), but data from this last study reach the strongest fit with a square root X function (y = 47.74 x 0.5, R 2 > 0.98, ***). As for the MFPL, a squared X model fitted the correlation with VDSI in each of the three groups, with similar coefficients (0.11 ± 0.01 and 0.91 ± 0.02, respectively for the quadratic and the determination one). In addition, since individual curves overlapped consecutively and all together spanned the full VDSI range, data from all surveys were pooled to get the single curve displayed in Figure 4 (R 2 = 0.93, ***). A similar correlation was found between RPSI and VDSI (figure not shown).
Biometric and imposex indices. Box plot of the imposex incidence (I%, broken lines) and the relative penis size index (RPSI, solid lines) in samples of Nucella lapillus collected along four surveys. Boxes range from Q1 to Q3, with the median across, the mean represented with an x and the tails indicating the minimum and maximum values that are not outliers (not shown). The significance of statistical contrasts between pairs of consecutive surveys is indicated in parentheses, see text for further explanation.

Biometric and imposex indices. Plot of the vas deferens sequence index (VDSI) against their corresponding mean female shell height (MFSH) in samples of Nucella lapillus collected along four surveys. The lines represent the trend for 2006 (dotted blue) and 2009 (dashed green).

Biometric and imposex indices. Plot of the imposex incidence (I%, left) and the mean female penis length (MFPL, right) against the vas deferens sequence index (VDSI) in samples of Nucella lapillus collected along four surveys. The bottom colour-coded scale refers to the OSPAR scheme (2004), with capital letters denoting the corresponding Assessment Class (AC). The I% lines represent the trend for 1996–2003 (dot-and-dash black), 2006 (dotted blue) and 2009 (dashed green).

Tritia reticulata
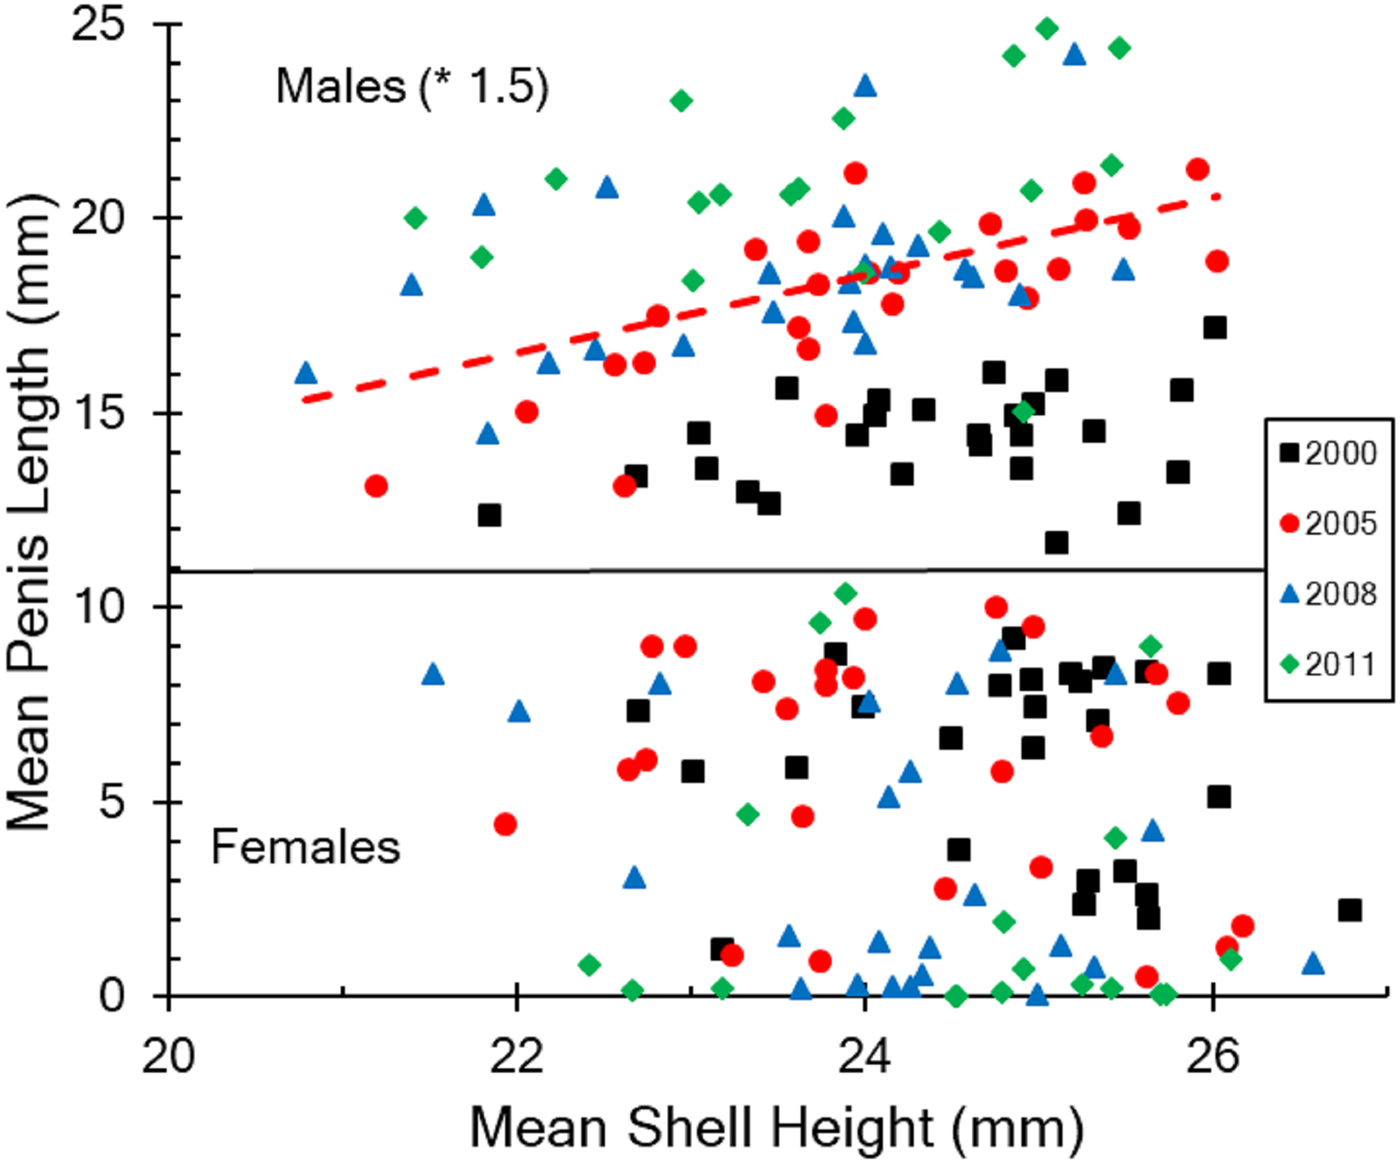
Table 2 gathers biometric results for the four surveys with this gastropod (N = 26, 25, 24 and 18, respectively for 2000, 2005, 2008 and 2011); they all refer to specimens of the selected size (i.e. SH from 20 to 27 mm). A total of 2070 individuals distributed over 93 samples were computed, and in 17 out of them the amount of representatives for either sex was below 6 (down to a minimum of 2 males in site 18, 2011). The mean number of animals considered per site in each campaign ranged from 13 ± 3 to 15 ± 6 and from 8 ± 3 to 9 ± 3, respectively for females and males. The mean shell height for females (MFSH) and males (MMSH) ranged from 24.2 ± 1.2 to 24.9 ± 1.0 and from 23.5 ± 2.6 to 24.4 ± 1.0, respectively. While this variation did not result in significant MSH differences within sex along the four surveys (ANOVA, F = 2.16 and 2.51, respectively for MFSH and MMSH, P > 0.5 in both cases), the difference between sexes was statistically relevant (t test for N = 93, **). As for the mean penis length, in 2000 the average MFPL in the area was 5.97 ± 2.54 (N = 26), and the situation exhibited little change in 2005 (5.94 ± 3.10, t test for N = 25, NS). However, MFPL was lower in 2008 (3.60 ± 3.31, t test for N = 24, *), and the subsequent drop in 2011 was not significant (2.41 ± 3.60, MWW test for N = 18, P > 0.05). On the contrary, MMPL significantly increased from 2000 (9.54 ± 0.87, N = 26) to 2005 (11.98 ± 1.49, MWW test for N = 25, ***), remained quite similar in 2008 (12.40 ± 1.45, t test for N = 24, NS), and increased again in 2011 (13.90 ± 1.60, t test for N = 18, *). This may be better grasped in Figure 5 plotting the mean penis length in all samples of both sexes vs their corresponding mean shell height; MMPL values in Table 2 have been multiplied by 1.5 for clarity. There was a significant linear relationship in only one out of the three male groups (2005–2008, N = 49, R 2 = 0.32, ***) and in none of the two female pooled penis sets.
Biometric and imposex indices. Plot of the mean penis length in males (MMPL, top) and females (MFPL, bottom) against their corresponding mean shell height in samples of Tritia reticulata collected along four surveys. The line represents the trend for a homogeneous subset resulting from pooling together the 2005 and 2008 campaigns, see text for details.

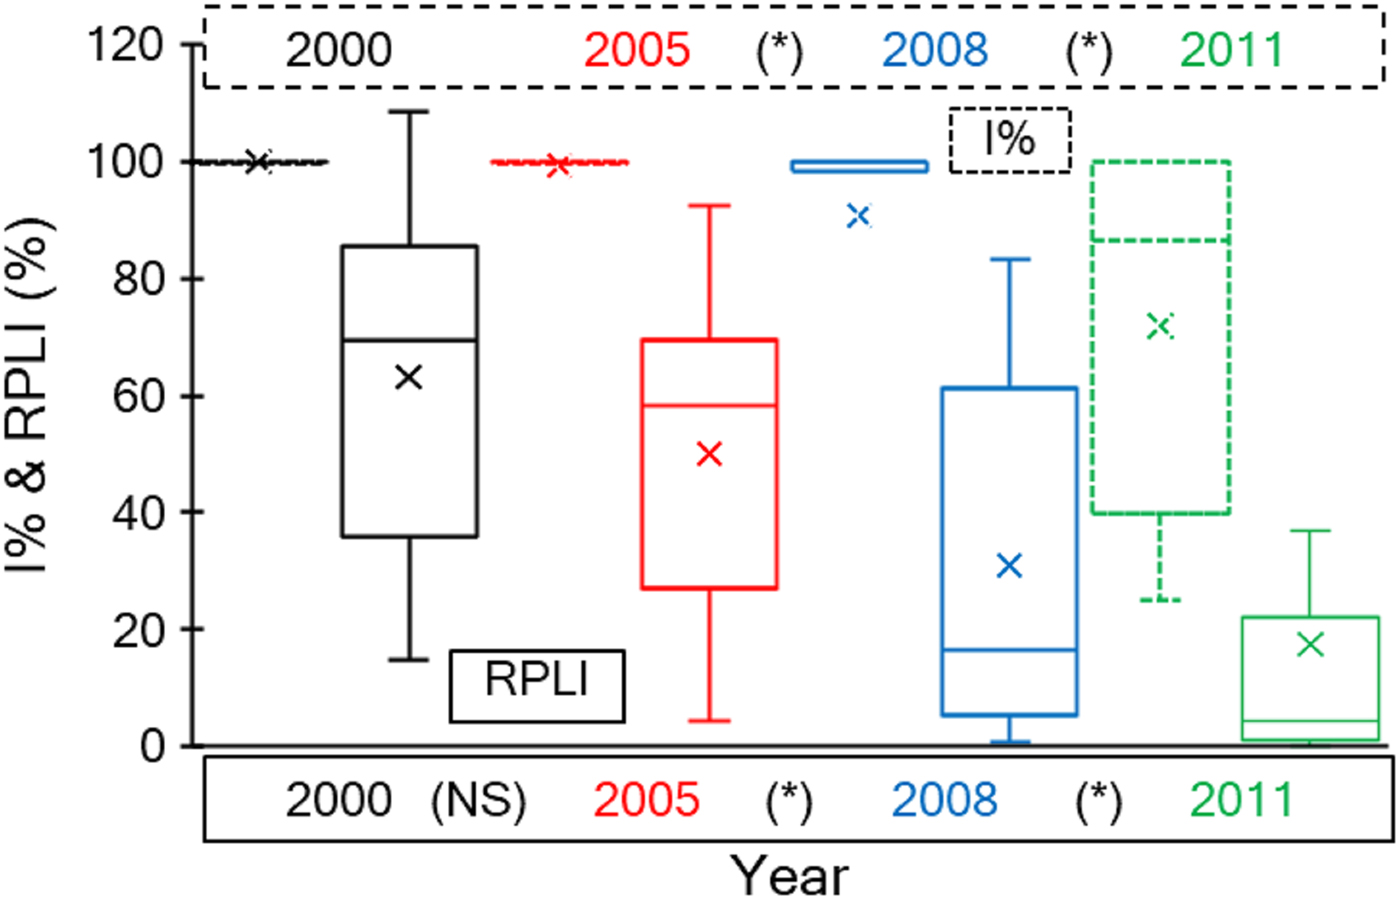
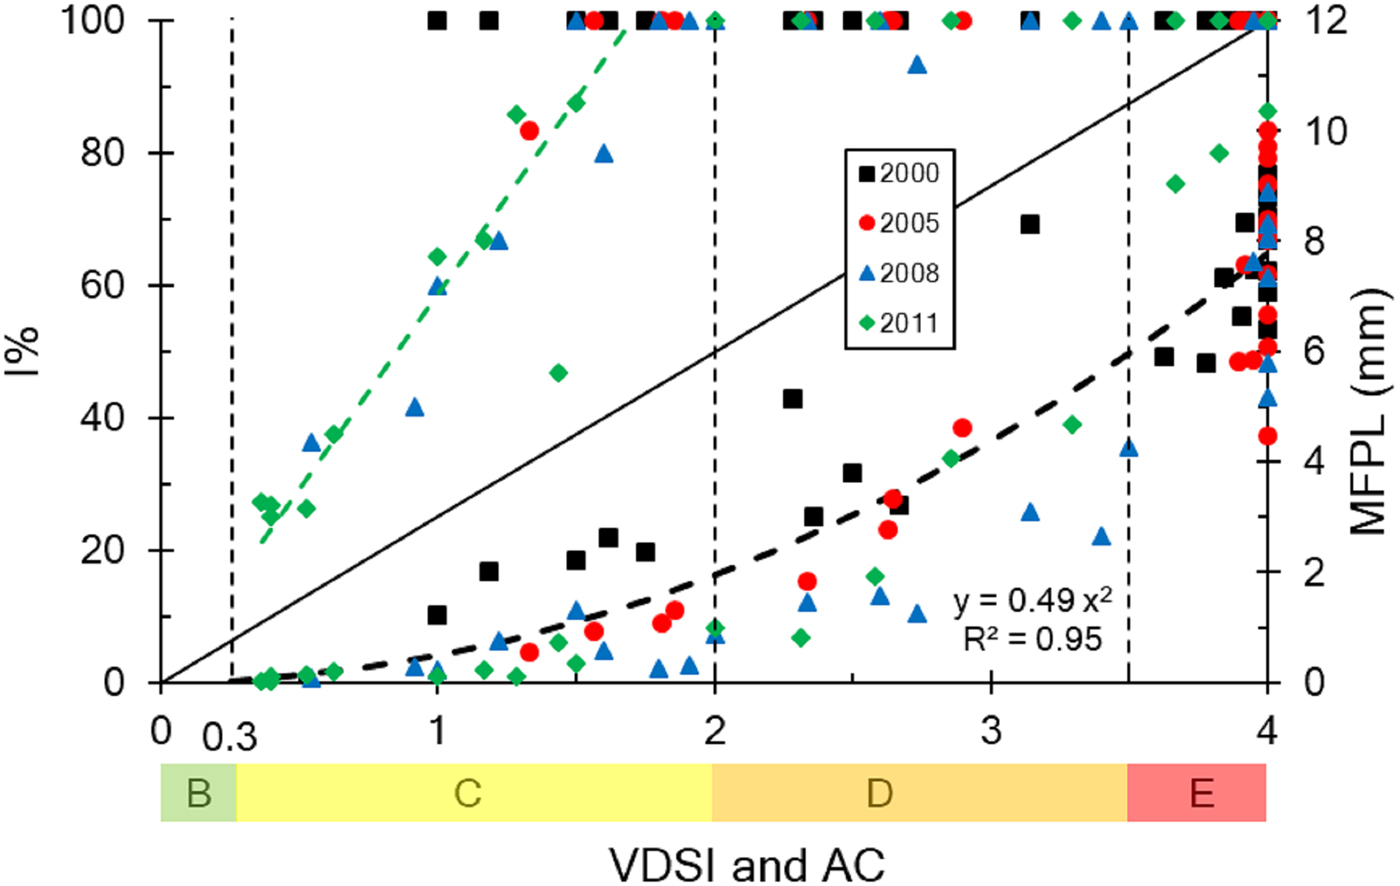
Supplementary Table S2 gathers the numbers for all three imposex indices; those for RPLI in 2000 were first published by Ruiz et al. (Reference Ruiz, Barreiro and González2005), but may be slightly different here because we have only computed now those females within the established SH range (see above). The progression of I% and RPLI along these 11 years can be better viewed in Figure 6. Values for I% were extreme in 2000 (all 26 sites at 100%) and 2005 (99 ± 3.3, N = 25), declined later in 2008 (91 ± 19, MWW test for N = 24, *) and further from here to 2011 (72 ± 32, MWW test for N = 18, *). Likewise, RPLI was highest in 2000 and 2005 (63.08 ± 27.70 and 50.97 ± 27.26, respectively, t test for N = 25, NS), decreased in 2008 (30.88 ± 29.42, t test for N = 24, *) and again in 2011 (17.49 ± 26.24, MWW test for N = 18, *). This two-step drop of I% and RPLI along these 11 years do not match the VDSI decrease (first published in Ruiz et al., Reference Ruiz, Carro, Albaina, Couceiro, Quintela and Barreiro2017), where the only significantly lower values belonged to the 2011 survey. When plotted against the corresponding MFSH, no correlation was observed for the three RPLI groups nor for the two VDSI datasets (figures not shown). The parallelism between imposex measurements is lastly briefed in Figure 7 plotting I% in all samples vs their corresponding VDSI. Observations cover the full range of neither variable, but a linear function (y = 58.75 x, R 2 = 0.97, ***) fits to samples with VDSI < 2. Virtually all sites with higher VDSI show the topmost I% value, independently of the survey. As for the MFPL, a squared X function fitted the correlation with VDSI in each of the two established groups (i.e. 2000–2005, and 2008–2011), with close coefficients (0.48 ± 0.02 and 0.95 ± 0.03, respectively for the quadratic and the determination one). The curve in Figure 7 results from merging them both (R 2 = 0.95, ***). A similar relationship was found between RPLI and VDSI (figure not shown).
Biometric and imposex indices. Box plot of the imposex incidence (I%, broken lines) and the relative penis length index (RPLI, solid lines) in samples of Tritia reticulata collected along four surveys. Boxes range from Q1 to Q3, with the median across, the mean represented with an x and the tails indicating the minimum and maximum values that are not outliers (not shown). The significance of statistical contrasts between pairs of consecutive surveys is indicated in parentheses, see text for further explanation.

Biometric and imposex indices. Plot of the imposex incidence (I%, left) and the mean female penis length (MFPL, right) against the vas deferens sequence index (VDSI) in samples of Tritia reticulata collected along four surveys. The bottom colour-coded scale refers to the OSPAR scheme (2004), with capital letters denoting the corresponding Assessment Class (AC). The I% line represents the trend for samples with VDSI <2.

Discussion
This work details our effort to monitor TBT pollution in Galicia by gauging its biological effects in two common NE Atlantic intertidal gastropods. On the one hand, it shows that regional water quality improved following the 2003 EU total TBT ban, confirming previous conclusions based on the chemical analyses of tissues (Ruiz et al., Reference Ruiz, Albaina, Carro and Barreiro2015) and partial imposex observations (Ruiz et al., Reference Ruiz, Carro, Albaina, Couceiro, Quintela and Barreiro2017). It thus conforms to other studies that, using the large geographic range of Nucella lapillus, have verified imposex decrease throughout Atlantic Europe: from the northernmost reaches such as Iceland (Guomundsdottir et al., Reference Guomundsdottir, Ho, Lam, Svavarsson and Leung2011) and Norway (Schøyen et al., Reference Schøyen, Green, Hjermann, Tveiten, Beylich, Øxnevad and Beyer2019), to mid-latitude areas such as the UK (Nicolaus & Barry, Reference Nicolaus and Barry2015) and Ireland (Wilson et al., Reference Wilson, Minchin, McHugh, McGovern, Tanner and Giltrap2015), and further down to the southernmost limits in Portugal (Laranjeiro et al., Reference Laranjeiro, Sanchez-Marin, Oliveira, Galante-Oliveira and Barroso2018). Although international comparisons are not straightforward even within the OSPAR area due to national particularities (e.g. beginning and timing of surveys, application of TBT partial bans, number of sites in the sampling networks, etc.), all these studies agree in that the Ecological Quality Objective (EcoQO) set by OSPAR (2004) is generally met. In this respect, the recent report that all 2017 samples in the Norwegian network (N = 8) are free of imposex (Schøyen et al., Reference Schøyen, Green, Hjermann, Tveiten, Beylich, Øxnevad and Beyer2019) constitute some most welcome news that will be hopefully mirrored elsewhere in the coming years. On the other hand, this work compiles biometric data extending over more than 10 years per species to offer novel insights on both basic marine biology features and their potential application to pollution monitoring, as follows.
Biometrics
These two snails are conspicuous in Atlantic Europe and other coasts and, therefore, have for long been the subject of many biological studies. More precisely, the finding that they suffer from imposex and are valid to assess TBT pollution (e.g. Bryan et al., Reference Bryan, Gibbs, Hummerstone and Burt1986; Stroben et al., Reference Stroben, Oehlmann and Fioroni1992) promoted their use in biomonitoring exercises over the last decades. However, while many such works included the customary measurement of the animals’ shell height (SH) in addition to genital records, few have studied the relationship between both datasets (and hardly ever at a regional scale and over more than a sampling season). In doing so, the current results show negligible SH variation within sex for either species, in concurrence with Galante-Oliveira et al. (Reference Galante-Oliveira, Oliveira, Ferreira, Santos, Pacheco and Barroso2011). They reported no significant difference in MFSH when 12 populations of Nucella lapillus spread from north to south Portugal were repeatedly sampled (from 2003 to 2006 and 2008) and analysed together; no comparable revision is known for Tritia reticulata. In these homogeneous conditions, the assessment of imposex change can confidently be performed with no need to normalize biometric parameters by specimen size. In turn, the selection of our samples to comply with an established SH range (see Materials and methods above) precludes further inference on the medium term trend of any species size. On the other hand, our results on SH variation between sexes do not appear to agree with previous findings (see Son & Hughes, Reference Son and Hughes2000, and references therein) that N. lapillus females tend to be larger than males. However, our approach in the selection and treatment of samples was unlike theirs, probably inappropriate to discern this specific question. This applies to T. reticulata too, which actually displayed some sexual dimorphism in size (i.e. MFSH was significantly higher than MMSH). Our field sampling method using bait to attract specimens probably adds some behavioural aspects complicating the interpretation of SH results for T. reticulata but, unfortunately, no literature on these subjects seems to be available.
With respect to the mean penis length in both gastropods, the observations that in females (MFPL) it decreased from the first two surveys to the last two was to be expected following the known beneficial effects of the 2003 EU total TBT ban. On the contrary, the changes recorded for T. reticulata males (i.e. it increased from 2000 to 2005–2008 and to 2011) are rather surprising. Our samplings concentrated on the same calendar months to avoid the MMPL seasonal variation (due to temperature-dependent sexual maturation stage) documented in both species (e.g. Gibbs et al., Reference Gibbs, Bryan, Pascoe and Burt1987; Barroso & Moreira, Reference Barroso and Moreira1998, respectively for N. lapillus and for T. reticulata). Therefore, other field and/or laboratory factors have to be invoked to account for such odd variation. For instance, the finding by Bailey & Davies (Reference Bailey and Davies1991) that penis growth was stimulated in males (as well as in females) in response to field TBT exposure might justify the minor MMPL drop in N. lapillus, but it is of no help to explain the increase in T. reticulata. Moreover, gastropods' parasites are known to have a castrating impact and a reducing effect on male penis size, possibly even at their early stages (Morley, Reference Morley2006; Rato et al., Reference Rato, Russel-Pinto and Barroso2009b). Thus, while we discarded evidently infested specimens (see Materials and methods above), the possibility that immature infections went overlooked cannot be rejected. In addition, we were unaware that N. lapillus males close to egg capsules clusters had larger penises than those further away (Galante-Oliveira et al., Reference Galante-Oliveira, Oliveira, Santos, Pereira, Pacheco and Barroso2010), and it is thus possible that our collections inadvertently contributed to male penis variability. Finally, extended handling time (Minchin & Davies, Reference Minchin and Davies1998) and narcotization (Huet et al., Reference Huet, Fioroni, Oehlmann and Stroben1995) lead to larger penis length in N. lapillus, but we never sedated these samples nor needlessly prolonged any assessment. The latter also applies to T. reticulata, which samples were always narcotized as required. Whether our laboratory protocol differed enough to account for the consistent MMPL increase over time is unlikely. Alternatively, other environmental factors (e.g. climatic) may have something to do with these unexpected results, but we have no empirical nor bibliographic justification to put forward any reasonable proposal. We must, though, bear them in mind when it comes to understand RPLI changes (see below).
The correlations found between the mean penis length (MPL) and the mean shell height (MSH) in both sexes of N. lapillus (Figure 1) have been reported for other gastropods (e.g. Vasconcelos et al., Reference Vasconcelos, Moura, Barroso and Gaspar2011; Castro & Fillmann, Reference Castro and Fillmann2012). The strength, significance and slope of the linear trends are typically higher in males, reflecting that the relationship is a natural, ontogenetic one. However, imposex is known to be a dose-dependent anomaly (e.g. Bryan et al., Reference Bryan, Gibbs, Burt and Hummerstone1987) whereby females mirror the genital development of males in their populations (Gibbs et al., Reference Gibbs, Bryan, Pascoe and Burt1987), and therefore the growth of their TBT-imposed penises is subject to some secondary SH dependence too. Figure 1 further shows that, while the relationship in males is consistent over time despite some MMPL variability (due to factors including those discussed above), MFPL gradually decreased after 1996–2003; as a consequence, its correlation with MFSH fades away so that in 2009 it is only sustained by fewer than two-thirds of the sites initially considered. There is little doubt that this association will eventually disappear as populations with no penis-bearing females proliferate in response to decreasing TBT pollution. As for T. reticulata, there was no correlation whatsoever between MFPL and MFSH, and in Figure 5 it is actually hard to distinguish the statistically contrasted MFPL drop from 2000–2005 to 2008–2011. On the contrary, the upward trend detected in the three MMPL groups (i.e. from 2000 to 2005–2008 and to 2011) is quite apparent. In fact, data in every one of these three male groups seem to be associated with the corresponding MMSH, as expected (e.g. see Rato et al., Reference Rato, Ferreira, Santos and Barroso2009a). However, the correlation was significant only for the middle one (N = 49), probably because the regressions for the other two suffered from a limited number of observations (N = 26 and N = 18, respectively for 2008 and 2011) and/or the presence of some outliers.
Thus, there are some marked contrasts between the observations on both species (see Figure 1 vs Figure 5): while the expected MFPL decrease is progressive and uniform only for N. lapillus, both adjectives can be applied to the unprecedented MMPL increase in T. reticulata. It has to be noted that the former is a stenotopic species (i.e. with strict environmental requirements) of restricted mobility (e.g. Crothers, Reference Crothers1985) and, because it accumulates TBT mostly from water (Bryan et al., Reference Bryan, Gibbs, Hummerstone and Burt1989), it is regarded as a quickly reacting matrix (Ruiz et al., Reference Ruiz, Carro, Albaina, Couceiro, Quintela and Barreiro2017). Individuals at a given site are hence exposed to relatively homogeneous conditions, populations narrowly reflecting the specific level of water TBT they suffer. Therefore, in a scenario of sustained and widespread pollution decrease N. lapillus respond as a consistent biomonitor, progressively in time and uniformly in space. On the contrary, the eurytopic character of T. reticulata increases its tolerance to a range of environmental factors and enables the wider distribution of populations along the estuary, where individuals move following tidal and seasonal rhythms (Tallmark, Reference Tallmark1980). This gastropod may thus dwell in different thermal habitats, their sexual maturation stage changing from site to site and even within the same population (Tallmark, Reference Tallmark1980, reported differences in the time of spawning up to 3–4 weeks due to vertical temperature gradients). These changes must be accompanied by fluctuations in the penis length of males (see above), and likely in that of conpopulation females suffering imposex. In addition, T. reticulata takes up considerable amounts of TBT from the sediments it inhabits, particularly if they are sandy; fine grained organic-rich muds result in lower accumulation but may delay the response to improving conditions (Pope, Reference Pope1998). All these considerations probably justify some of the MFPL inconsistency recorded which, if substantial, has not completely eclipsed its own significant decrease after the mid 2000s. However, these biological features do not suffice to explain a MMPL variability that, rather than being erratic, appears graded along surveys and consistent across the area. Again, we are at a loss to understand this observation.
Imposex
Nucella lapillus
The temporal evolution of all measurements of imposex in this species were in phase along the study period (see Table 1 and Figure 1 for MFPL, Supplementary Table S1 and Figure 2 for I% and RPSI, and Supplementary Table S1, Figure 3 and Ruiz et al., Reference Ruiz, Carro, Albaina, Couceiro, Quintela and Barreiro2017, for VDSI). This sequential reduction of effects (from the early- to the mid- and then to the late-2000s) partially conforms to the pace of change in their causative agent as chemically determined in the same specimens: the TBT body burden differentiated between the first two surveys (1996–2003) and the last two (2006–2009) (see Ruiz et al., Reference Ruiz, Albaina, Carro and Barreiro2015). This concurrence confirms the quick success of the 2003 EU total TBT ban. It is likely due to the biological characteristics of this species, which enable both direct reaction to water TBT (see above) and rapid population renewal (individuals mature when 2–3 years old, see Gibbs, Reference Gibbs1999). As for the disagreement between both datasets on the changes occurred (or not) between 2006 and 2009, it is not thought to be due to false biological positives. Differences were clear-cut and significant in all imposex measurements, and MFPL and derived RPSI are free of specimens size caveats because there was no SH heterogeneity either within or between sex. We rather think the dissimilarity is caused by TBT desorption from sediments, a natural phenomenon expected to occur in environments where water quality begins to improve. We have previously discussed how N. lapillus is prone to be affected by such a passive diffusion of hydrophobic TBT so that persistent tissue concentrations in 2009 can be explained (Ruiz et al., Reference Ruiz, Albaina, Carro and Barreiro2015).
On the other hand, TBT pollution before the 2003 EU total ban was such that most populations showed a VDSI close to 4; as usual, RPSI was more variable (Supplementary Table S1), but the interesting point is that both were irrespective of MFSH (see Figure 3 for VDSI). Later, as soon as TBT declined, indices also decreased, but seemingly more pronouncedly in populations of smaller SH. This was repeated in the last survey, when the correlation between VDSI and MFSH was highly significant. In this respect, Galante-Oliveira et al. (Reference Galante-Oliveira, Oliveira, Ferreira, Santos, Pacheco and Barroso2011) proved that individual VDS (and consequently the VDSI) in N. lapillus is dependent on SH. They thus confirmed a longstanding belief of plain reasoning: larger females within a given population are normally older, have been exposed to TBT pollution for a longer period, and therefore suffer more from its adverse effects (e.g. develop higher VDS). This relationship is critical when we are to assess imposex change in a scenario of decreasing TBT, and prompted our SH selection in samples (see Materials and methods). Now Figure 3 implies that VDSI is related to SH not only at the local but also at the regional scale, and that such association is masked when the sole responsible agent is high and widespread enough to homogenize the imposex response throughout the area. A similar relationship is less obvious for MFPL and derived RPSI because TBT is not the only determinant of penis length (see Figure 1 and text above).
It is well known that the interaction between the phenotypic plasticity in N. lapillus and the physical action of waves results in exposed enclaves of shorter SH inhabiting the open coast, and sheltered populations of longer shells located inside estuaries (e.g. Crothers, Reference Crothers1985; Gibbs, Reference Gibbs1993). With the advent of antifouling TBT paints, this gradient overlapped with another one established by the dilution of the pollutant released in the more protected upper reaches (where activities releasing TBT such as marinas, shipyards, dry docks, etc. tend to concentrate) towards the mouth of the estuary and beyond (e.g. see Figure 5 in Ruiz et al., Reference Ruiz, Quintela and Barreiro1998, showing such a TBT downstream gradient in the estuary of Vigo). For instance, the 5 left-most 2009 samples in Figure 3 (code 1, 2, 16, 17 and 18) can be considered as exposed, and the 5 right-most ones (code 8, 9, 10, 26 and 28) as sheltered (see Ruiz et al., Reference Ruiz, Quintela and Barreiro1998, for a print map or Ruiz et al., Reference Ruiz, Carro, Albaina, Couceiro, Quintela and Barreiro2017, for a Google one). The average MFSH, imposex (MFPL, RPSI and VDSI) and TBT tissue concentration in 1996 in the former group (all data from Table 1 and Supplementary Table S1, N = 5 except TBT, N = 4, see Ruiz et al., Reference Ruiz, Albaina, Carro and Barreiro2015, and references therein) were 21.0 ± 2.2 mm, 1.25 ± 0.13 mm, 10.65 ± 4.87, 3.72 ± 0.49 and 122 ± 134 ng Sn g−1 DW (or ppb Sn DW), respectively; in the latter they were 28.6 ± 1.1 mm, 1.65 ± 0.52 mm, 15.46 ± 12.37, 3.85 ± 0.74 and 402 ± 222 ppb Sn DW, respectively. In 2009 there were negligible MFSH differences in either the exposed or the sheltered group (20.6 ± 0.7 mm and 28.5 ± 0.8 mm, respectively), but imposex had decreased considerably in the latter (average MFPL, RPSI and VDSI were at 0.32 ± 0.38 mm, 0.85 ± 1.80 and 1.67 ± 0.80, respectively) and to a larger extent in the former one (there was no penis-bearing female in these 5 samples, and mean VDSI was 0.31 ± 0.27). There is no doubt these drops were caused by some huge TBT declines (down to 8 ± 5 and 55 ± 40 ppb Sn DW, respectively for the exposed and the sheltered sites). Variability between these two extreme groups may be considerable due to site singularity, but data from all 34 samples in 2009 confirm a significant and consistent trend. Therefore, it is concluded that the association found between VDSI and MFSH would not come from a direct dependence but from the inverse relationship between other two latent, causative, variables: TBT pollution and wave exposure, respectively.
Tritia reticulata
All imposex measurements in samples of this species (see Table 2 and Figure 5 for MFPL, Supplementary Table S2 and Figure 6 for I% and RPLI, and Supplementary Table S2 and Ruiz et al., Reference Ruiz, Carro, Albaina, Couceiro, Quintela and Barreiro2017, for VDSI) and their TBT body burden (Ruiz et al., Reference Ruiz, Albaina, Carro and Barreiro2015) agree in that values in 2011 were lower than in 2000. However, there is some uncertainty on what was the rhythm of change between those 11 years: while TBT residues and MFPL coincide in separating only two groups (2000–2005 and 2008–2011), both RPLI and I% split the latter in two, and VDSI did not significantly decrease until 2011. Even if the precise timing of events may not be critical now, it seems interesting to go deeper into these findings, particularly as they incompletely agree with those by Bryan et al. (Reference Bryan, Burt, Gibbs and Pascoe1993). These authors concluded that, when environmental TBT concentrations decline rapidly, analysis of tissues provides a far better indication of change than measurements of population imposex. In doing so we have first to recall the circumstances of our studies: (i) T. reticulata responses were predicted to be delayed with respect to Nucella lapillus because cohort replacement is slower in the former species (individuals in Ría de Aveiro mature when 4–5 years old and can live up to at least 11 years, see Barroso et al., Reference Barroso, Moreira and Richardson2005). (ii) In addition, since the sediments it dwells in constitute a matrix less responsive to pollution changes than water, surveys for this infaunal carrion feeder were carried out some time behind those for the rocky shore carnivore. (iii) As the regional approach to this study included every available type of sample (from ports to marinas, from urban to aquaculture areas), variability was anticipated to be important. And (iv), because the number of populations sampled was lower than for N. lapillus, the resolution of the statistics employed may not be powerful enough to cope with that dispersion.
In a first instance, MFPL and RPLI observations on T. reticulata would seem free of any size caveat because there was no SH heterogeneity within sex. However, the factual MMPL growth (from 2000 to 2005–2008 and to 2011, see Table 2 and Figure 5) may have interfered with penis length marks and indices. For example, it may be thought that the lack of MFPL change from 2000 to 2005 resulted from some compromise between an increasing force (male penises to be imitated significantly enlarged by an average of 25% in the same period, see Table 2) and a decreasing one (TBT in tissues dropped by 40% in those 5 years, see Ruiz et al., Reference Ruiz, Albaina, Carro and Barreiro2015). In the same vein, it is likely that the RPLI substantial reduction from 2008 to 2011 (see Figure 6) in the absence of significant MFPL change (see Table 2) was facilitated by the concurrent MMPL rise (by a further 12%). In view of the inexplicably large MMPL variability, neither MFPL nor the combined RPLI can be calibrated against other indices of TBT pollution (e.g. concentration in tissues, VDSI), and their reliability is consequently demoted. As for VDSI, the finding that it was the slower measure to detect change (until 2011) may be due to the usage of the standard 0–4 VDSI scale (see Materials and methods). It has already been discussed how, by adopting a response gauge that is readily saturated (in the first three surveys aggregated an average 43% of samples reached the top value, see Supplementary Table S2), we have probably overlooked some of the finer changes detected elsewhere thanks to a scale of wider range (see Ruiz et al., Reference Ruiz, Carro, Albaina, Couceiro, Quintela and Barreiro2017).
A graphical summary
Lastly, Figure 4 plots I% and MFPL vs VDSI for all four Nucella lapillus surveys; the time evolution of imposex is thus condensed in a single graph. With a similar pattern, Figure 7 gathers all three indices for Tritia reticulata. Both figures include the colour-coded Assessment Classes (ACs) established from the VDSI scale, originally in N. lapillus and later in T. reticulata (OSPAR, 2004). This type of chart displaying the relationship between different measures is common practice in imposex works, from some of the first reports (Bryan et al., Reference Bryan, Gibbs, Hummerstone and Burt1986) to the latest ones (e.g. Cacciatore et al., Reference Cacciatore, Brusa, Noventa, Antonini, Moschino, Formalewicz, Gion, Berto, Gabellini and Marin2018). While the former employed primitive indices to illustrate the phenomenon in N. lapillus as it was unveiled, the latter propose using imposex in other gastropods as an indicator of the impact of TBT within the European Union Water Framework Directive.
The relationship between I% and VDSI comes as no surprise since the continuous former variable is fully dependent on the ordinal latter one: as soon as VDSI is determined, the I% can be calculated straight away (see Materials and methods above). Although the character of these plots is thus merely descriptive, they still offer some interesting insights, particularly when several surveys or species are compared. In the case of N. lapillus (Figure 4), the simple linear model fitting the association in two of the I% (or VDSI) groups established (i.e. 1996–2003 and 2006) renders the total I% at VDSI around 4 and beyond (AC D). These topmost values were never found in the third group (i.e. 2009) which, rather, includes the only three samples in AC A ever found (see Supplementary Table S1). Thus, a square root X curve describes better how the shape of the relationship between imposex incidence and severity changed in this last regional sampling. With respect to T. reticulata, Figure 7 shows that I% is consistently at its maximum during the first two surveys, when most VDSI values were above 2 (ACs D and E). As VDSIs below that boundary (AC C) become more common over the last two samplings, a correlation between both variables is developed, although no site reaches the lowest ranges just yet.
On the other hand, the existence of females with complete vas deferens but no penis at all (e.g. Barreiro et al., Reference Barreiro, Quintela and Ruiz1999, Reference Barreiro, González, Quintela and Ruiz2001, respectively for N. lapillus and T. reticulata) demonstrates that these two structures are somehow independent of each other. However, both are caused by TBT pollution, and therefore some correlation between them is to be expected (as was found elsewhere when using the RPLI, e.g. Barroso et al., Reference Barroso, Moreira and Bebianno2002). Here we prefer to deal with the absolute female penis length because it is the direct measure, free of interferences such as the unexplained MMPL variability presented above.
The relationship between both accessory organs follows the same model in either species, with quadratic coefficients differing by a factor of 4.1; this probably results from the distinct nature of the penises, more elongated in T. reticulata. In this species the coefficient of determination is also slightly stronger, perhaps because the correlation is qualitatively more appropriate since its earliest VDS stage of 1 includes a tiny penis while none in N. lapillus (see Materials and methods above). In any case, the correlation sustains some useful applications since it allows the close estimate of a sample VDSI from the mere appraisal of its MFPL. Practitioners are aware that assessing penis length in sacrificed females is easier and quicker: penises (always located behind the right tentacle) have just to be measured, while the categorization of a vas deferens requires the meticulous examination of the whole floor of the pallial cavity. Besides, the VD cannot be observed in its entirety without shell removal and dissection (i.e. killing the animal), while PL can be gauged in living females subject to reversible narcotization; for N. lapillus this was shown to be feasible, if delicate, by Gibbs (Reference Gibbs2005). Such a non-destructive procedure minimizes the impact of imposex surveys (e.g. de Azevedo et al., Reference de Azevedo, Rocha-Barreira, Matthews-Cascon and Castro2012), taking particular care of those populations previously depleted by TBT and/or other stressors; in retrospect, this technique could have been beneficial for some of our N. lapillus enclaves. Moreover, ACs can be directly guessed from penis length values. Figure 4 shows that most N. lapillus samples with MFPL from ~0.5 to 2 mm correspond to the yellow C, and samples above that range belong to the orange D; penises below 0.5 mm are more problematic to measure and interpret, but this seems of a lesser importance since in any green case (AC A or B) the EcoQO is met (OSPAR, 2004). As for T. reticulata, when MFPL lies within the same 0.5–2 mm range it would also be linked with AC C, and values above (but below 6 mm) with AC D (see Figure 7); again, smaller sizes are more difficult to assign since the only green AC (B, in compliance with the EcoQO) requires an average penis primordium below 0.04 mm. It is remarkable that, no matter which species, any sample's AC can be consistently derived from its MFPL (at least over a considerable portion of their respective ranges).
Author ORCID
J. M. Ruiz, 0000-0002-0893-6175
Supplementary material
The supplementary material for this article can be found at https://doi.org/10.1017/S0025315419000535.
Acknowledgements
Thanks are due to A. Míguez and other BIOCOST staff for help with fieldwork, and to reviewers for constructive criticism.
Financial support
Through the years this work was partially funded by some Spanish Ministries (MCyT REN2001-0899/MAR, and MEC CTM2004-04496/MAR, co-funded by the European Fund for Regional Development), the Xunta de Galicia (Projects XUGA 10301A96, 10309B97, PR404A99/133, and PGIDIT05PXIC10302PN), the Universidade da Coruña (UDC, Equipos Consolidados 2004), and also by some Cooperation Agreements between the UDC and the Instituto Español de Oceanografía (IEO). B.C. received a postgraduate fellowship from Deputación da Coruña, and L.C. and N.A. from FPU-MEC (AP2002-0928 and AP2006-03231, respectively). The institutions had no other role than providing funding.