Introduction
The Bay of Bengal Large Marine Ecosystem is an embayment in the north-east Indian Ocean bordered by Sri Lanka, India, Bangladesh, Malaysia, Thailand, Myanmar, Indonesia and the Maldives. It is the largest bay in the world and is characterized by spatial and temporal variability in productivity (Dwivedi & Choubey, Reference Dwivedi, Choubey, Sherman, Okemwa and Ntiba1998). The Bay comprises a multispecies fishery that is exploited by a multitude of gears, with catches from nearshore waters supported by lower trophic level groups and those from offshore waters dominated by higher trophic level groups. Globally, the family Sphyraenidae, popularly known as barracudas, is represented by only one genus, Sphyraena, with 27 species (Nelson et al., Reference Nelson, Grande and Wilson2016), of which 10 species are known to exist in the Bay (Rajesh et al., Reference Rajesh, Rohit, Abdussamad and Viswambharam2020). Of these 10 species, five, namely S. jello (Cuvier, 1829), S. obtusata (Cuvier, 1829), S. barracuda (Edwards, 1771), S. putnamae (Jordan & Seale, 1905) and S. qenie (Klunzinger, 1870) form a fishery of considerable importance. Landings of barracuda in the western part of the Bay have been increasing, albeit with wide annual fluctuations from 0.02 million tonnes in 2012 to <0.01 million tonnes in 2014–15 and to nearly 0.03 million tonnes in 2018–19. More than two-thirds of all barracuda species are caught using trawlnets, and the rest are caught using other gears. During 2018–19, ~3% of the trawl landings in the western Bay of Bengal were composed of barracudas (Sivadas et al., Reference Sivadas, Zacharia, Sarada, Narayanakumar, Kizhakudan, Margaret, Surya, Remya, Rajkumar, Chhandaprajnadarsini, Manojkumar, Jagadis, Kavitha, Saleela, George, Laxmilatha and Gopalakrishnan2019; Manas et al., Reference Manas, Sathishkumar, Ghosh, Divipala, Roul, Rohit, Mini and Abdussamad2020; Roul et al., Reference Roul, Pradhan, Manas, Ghosh, Ganga, Abdussamad, Mini and Rohit2020; Sivadas et al., Reference Sivadas, Margaret, Vinothkumar, Mini and Abdussamad2020). Sphyraena putnamae, contributing nearly a quarter of the total barracuda landings, has emerged as one of the dominant barracuda resources in the region (personal communication from Pelagic Fisheries Division, Central Marine Fisheries Research Institute, Kochi, India). Semi-pelagic fish trawls with cod-end meshes that vary in size from 20–30 mm operate at depths of >30 m and catch shoaling pelagic finfishes; of these fishes, S. putnamae constitutes an important resource. In addition, large individuals are occasionally caught offshore in gillnets (mesh size of 175–200 mm) and hooks and lines (hook number 3). Owing to the absence of reports on the status of stocks, conservation measures for the species are lacking.
Sphyraena putnamae inhabits tropical waters of the Indian and Pacific Oceans, and probably, competes with similar large pelagic predators for the available forage. Enhanced landings of S. putnamae are a result of the compensatory increase in its abundance due to rapid declines in the biomass of its competitors, such as tuna, billfishes and sharks, which are being increasingly targeted along the western Bay of Bengal (Varghese et al., Reference Varghese, Somvanshi and Dalvi2014). However, similar to the global trend observed for large pelagic predators (Myers & Worm, Reference Myers and Worm2003), the situation may reverse rapidly with shifts in the targeted catch and the presently abundant S. putnamae species could become depleted in the near future. Collapse of high-level predator populations due to selective targeted fishing triggers trophic cascades, which negatively impact prey–predator regulations in trophic webs, leading to shifts in the ecosystem (Heithaus et al., Reference Heithaus, Frid, Wirsing and Worm2008). Ecosystem models, widely adopted for the management of apex predators, are data intensive and require detailed information on trophic linkages and their interactions along with information on energy transfer, consumption and production across different trophic levels of the ecosystem. Thus, understanding the composition of prey species and the trophic level is paramount, particularly because these apex predators exert substantial influence through top-down control on the abundance of consumers and primary producers at lower trophic levels of pelagic food webs (Pauly et al., Reference Pauly, Christensen, Guenette, Pitcher, Sumaila, Walters, Watson and Zeller2002). For example, a dramatic decline in the abundance of large sharks off South Africa resulted in the proliferation of smaller elasmobranchs, whose sole predators were large sharks, subsequently leading to the decline in the population of bony fish at lower levels of the food web (Baum & Worm, Reference Baum and Worm2009). Similarly in the Black Sea, due to a sharp decline in the population of pelagic predators, the density of planktivores increased, leading to decreased zooplankton and increased phytoplankton with subsequent eutrophication (Daskalov, Reference Daskalov2002). Moreover, the predation risk induces plastic and genetic alterations in prey traits; such as changes in the prey behaviour, morphology, and life-history and physiology, similar to the consequences observed in reef fishes off north-west Australia when the population of shark was wiped out through fishing (Hammerschlag et al., Reference Hammerschlag, Barley, Irschick, Meeuwig, Nelson and Meekan2018).
Studies on food and feeding aspects of some barracuda species have been conducted globally; these species include S. jello and S. obtusata from Arabian Sea (Premalatha & Manojkumar, Reference Premalatha and Manojkumar1990); S. guachancho from the eastern Atlantic Ocean (Akadje et al., Reference Akadje, Diaby, LeLoc'h, Konan and N'da2013); S. viridensis from Azores (Barreiros et al., Reference Barreiros, Santos and De Borba2002); S. jello from Persian Gulf (Hosseini et al., Reference Hosseini, Jamili, Valinssab, Vosoghi and Fatemi2009); S. chrysotaenia and S. flavicauda from the Gulf of Suez (Osman et al., Reference Osman, El Ganainy and Amin2019); S. viridensis, S. sphyraena and S. chrysotaenia from Rhodes Island (Kalogirou et al., Reference Kalogirou, Mittermayer, Pihl and Wennhage2012); S. ensis from the southern shelf of Colombia and south-eastern Gulf of California (Lopez-Peralta & Arcila, Reference Lopez-Peralta and Arcila2002; Moreno-Sanchez et al., Reference Moreno-Sanchez, Palacios-Salgado, Granados-Amores, Abitia-Cardenas and Escobar-Sanchez2019); S. barracuda off Colombia (Hooker et al., Reference Hooker, Castro-Gonzalez, Howard, Quintero and Sanabria2007); and S. sphyraena from Cape Coast (Aggrey-Fynn et al., Reference Aggrey-Fynn, Korsah and Appiah2013). Most barracudas, except S. flavicauda, are specialized piscivores, with finfishes constituting 70% to close to 100% of the prey species. For S. flavicauda, crustaceans and finfishes contribute more or less equally to the diet. Interspecies and intraspecies variations in diet of barracudas depending on the locally available prey are evident worldwide; however, a few individual species-specific studies have reported that the prey composition does not vary greatly across sexes, sizes and seasons.
Feeding preferences, dynamics and strategies of S. putnamae are poorly understood, and only one study from the north Persian Gulf (Mohammadizadeh et al., Reference Mohammadizadeh, Valinassab, Jamili, Matinfar, Bahri-Shabanipour and Mohammadizadeh2010) has reported some aspects of the feeding intensity and prey preference for a period of 1 year by using samples from the fish market. In the study (Mohammadizadeh et al., Reference Mohammadizadeh, Valinassab, Jamili, Matinfar, Bahri-Shabanipour and Mohammadizadeh2010), all dietary prey items were in a semi-digested fragmented state because of the long time interval between sample capture and analysis, and therefore, the qualitative and quantitative analysis of prey items could not be performed. Because of the lack of information on the trophic role of S. putnamae, consequences of removal or reduction of other trophic resources on S. putnamae are unclear, and therefore, investigating the trophic ecology of this species is essential for obtaining information on trophic relationships, which will facilitate the development of management or conservation strategies. In addition, knowing the dietary niche and trophic organization of S. putnamae is essential to understand the prey-resource partitioning and competition with cohabiting predators for available prey species. The present study provides a detailed and comprehensive account on the trophodynamics of the sawtooth barracuda. This study was an initial attempt to determine the feeding ecology of S. putnamae for understanding trophic interactions at the top levels of the food web. The knowledge acquired will contribute to ecosystem-based fisheries management in the Bay of Bengal.
Materials and methods
Sample collection
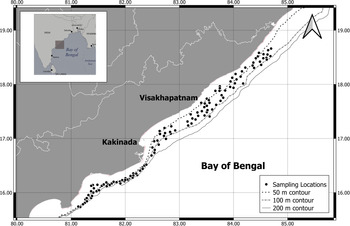
Two commercial, mechanized multiday trawlers, which were operating semi-pelagic fish trawls along the western Bay of Bengal from the fishing harbours of Visakhapatnam (17.696°N 83.301°E) and Kakinada (16.984°N 82.279°E) (Figure 1); performing 2–3 fishing voyages of 6–10-day duration each in a month, were provided with log-sheets for recording the fishing details. Sphyraena putnamae caught by both craft during the various hauls in each fishing voyage were collected randomly on landing, twice or thrice every month at Visakhapatnam and Kakinada over the 3-year study period from January 2017 to December 2019. Sample collection was suspended during May due to the annual ban on mechanized trawling from mid of April to mid of June along this coast. The collected iced samples were placed in insulated ice boxes immediately upon landing and were transported to the laboratory at the Visakhapatnam Regional Centre of Central Marine Fisheries Research Institute, India. All the samples were analysed on the same day to prevent prey digestion in the stomach. The fork length (LF) of individual fishes was measured to the nearest millimetre (mm), and the total weight was measured to 0.1 g precision; the sex of the fishes was also recorded. A total of 763 individuals (260 in 2017, 255 in 2018 and 248 in 2019), varying in LF and weight from 14.7 to 123.0 cm and 20 to 6104 g, respectively, were analysed during the study period. Individuals analysed in each month and pooled for the 3-year study period are indicated in parentheses in Table 1.
Map of western Bay of Bengal with sampling locations and depth contours.

Seasonal feeding intensity of Sphyraena putnamae

Owing to spatio-temporal variations in trophic interactions among mobile predators, that move either in search of favourable environmental conditions or to take advantage of seasonal prey pulses, the estimation of seasonal variations in the prey composition and niche width is imperative for comprehensively understanding an animal's niche. Moreover, ontogenic shifts in the prey type and size, which are common in large predatory fishes, maximize the intake of energy and nutrients. Therefore, all aspects of food and feeding were examined with respect to months/seasons (winter from December to February, representing the 1st quarter; summer from March to April, representing the 2nd quarter; monsoon from June to August, representing the 3rd quarter; and post-monsoon from September to November, representing the 4th quarter) and sizes (<30.0 cm LF, 30.0–44.9 cm LF, 45.0–59.9 cm LF and ≥60 cm LF). Stomachs of the individual fish were cut open, all prey contents were sorted and identified to the lowest taxon possible. Prey numbers were recorded, individually measured and weighed to 1.0 mm and 0.01 g precision. Prey identification was performed visually (Fischer & Whitehead, Reference Fischer and Whitehead1974; Fischer & Bianchi, Reference Fischer and Bianchi1984; Smith & Heemstra, Reference Smith and Heemstra1986, Carpenter & Niem, 1998; Psomadakis et al., Reference Psomadakis, Osmany and Moazzam2015; Sathianandan et al., Reference Sathianandan, Jayasankar, Mini, Kuriakose, Bharti, Manu, Paul and Augustine2017), and, when required, aided using a trinocular microscope. Unidentifiable semi-digested (half or more digested) finfishes were expressed as such, whereas for identifiable prey individuals in low or moderate states of digestion, weights were reconstituted from length measurements. Accumulated non-assimilated items (such as fish scales, hard parts including fish bones and otoliths, eyeballs, crustacean shells and cephalopod beaks) and non-animated objects (plastics) were discarded. For assessing the adequacy of sampling in describing the diet, a cumulative prey curve was constructed (Ferry & Cailliet, Reference Ferry and Cailliet1996).
Feeding intensity
Feeding intensities were assessed according to the degree of fullness of the stomach in relation to the size of the fish. The stomach state was assessed on the basis of distension and degree of fullness (Pillay, Reference Pillay1952) and was classified on a six-point scale as empty (0% full), trace (<5% full), 25% full, 50% full, 75% full and 100% full. However, for the analysis, the number of categories for stomach states was reduced to three, and the modified categories were: empty and trace, part-full (25% and 50% full), and full (75% and 100% full). Vacuity and fullness of the stomach were assessed by month, sex and size. Additionally, the predator–prey weight ratio was estimated using the log-transformed equation proposed by Hahm & Langton (Reference Hahm and Langton1984) for the assessment of the feeding intensity.
Feeding preference
The diet composition was assessed using two compound indices, namely the Index of Relative Importance (IRI%) (Pinkas et al., Reference Pinkas, Oliphant and Iverson1971) and Prey-specific Index of Relative Importance (PSIRI%) (Brown et al., Reference Brown, Bizzarro, Cailliet and Ebert2012). IRI% was calculated by summing the numerical (%N) and gravimetric (%W) percentage values and multiplying the sum by the frequency of occurrence percentage value (%FO) (Baker et al., Reference Baker, Buckland and Sheaves2014). PSIRI% was computed by averaging the prey-specific numerical (%PN) and gravimetric (%PW) percentage values and multiplying the average with the %FO. Prey-specific numerical (%PN) and gravimetric (%PW) abundance was estimated using the following equation (Amundsen et al., Reference Amundsen, Gabler and Staldvik1996):
 $$A_{{\rm PS}i} = 100\sum S_i\sum S_{Ti}^{{-}1} $$
where A PSi is the prey-specific abundance of prey i (by number, %PNi or by weight, %PWi), ∑Si is the total number or weight of prey i in all stomachs, and ∑S Ti is the total prey number or weight of all stomachs containing prey i.
Both IRI% and PSIRI% were evaluated for different seasons, sexes and sizes. From a perusal of the values obtained using both indices, it was observed that 11 out of the 28 prey groups were consumed singly, and many of the remaining prey groups exhibited high prey-specific abundances close to unity; therefore, the use of IRI% for further statistical computations was deemed appropriate. IRI% was square-root transformed and the Bray–Curtis similarity index was estimated for measuring the prey overlap or similarity. Similarity percentage (SIMPER) was used to identify prey species that could discriminate between seasons, sexes and sizes. One-way analysis of similarity (ANOSIM), a non-parametric and multivariate analysis of variance, was used to evaluate significant differences in prey similarities. ANOSIM uses a test statistic R ranging from 1 to +1, where higher positive values indicate more significant dissimilarity between groups than within groups. For determining ANOSIM's Global R statistic, data were randomly permuted 999 times for a distribution, whereas for the determination of ANOSIM's Pairwise R statistic, 35 random permutations of data were performed. Both SIMPER and ANOSIM were based on Bray–Curtis similarity values. Multivariate analyses were performed using PRIMER v. 6 (Clarke & Gorley, Reference Clarke and Gorley2006).
Feeding strategy
Predators with a diverse diet or a broad dietary niche are termed as generalists, whereas those with low prey diversity or a narrow niche width are termed specialists (Amundsen et al., Reference Amundsen, Gabler and Staldvik1996). Dietary niche was obtained using the Levin's Standardized Niche Breadth Index (BA):
 $$B_A = ( {B-1} ) ( {n\ndash 1} ) ^{{-}1}$$
where B is Levin's Niche Breadth Index, and n is the total number of prey species.
The Levin's Niche Breadth Index (B) was calculated using the following equation:
 $$B = \left({\sum P^2_j } \right)^{{-}1}$$
where Pj is the proportion of prey species j in the diet.
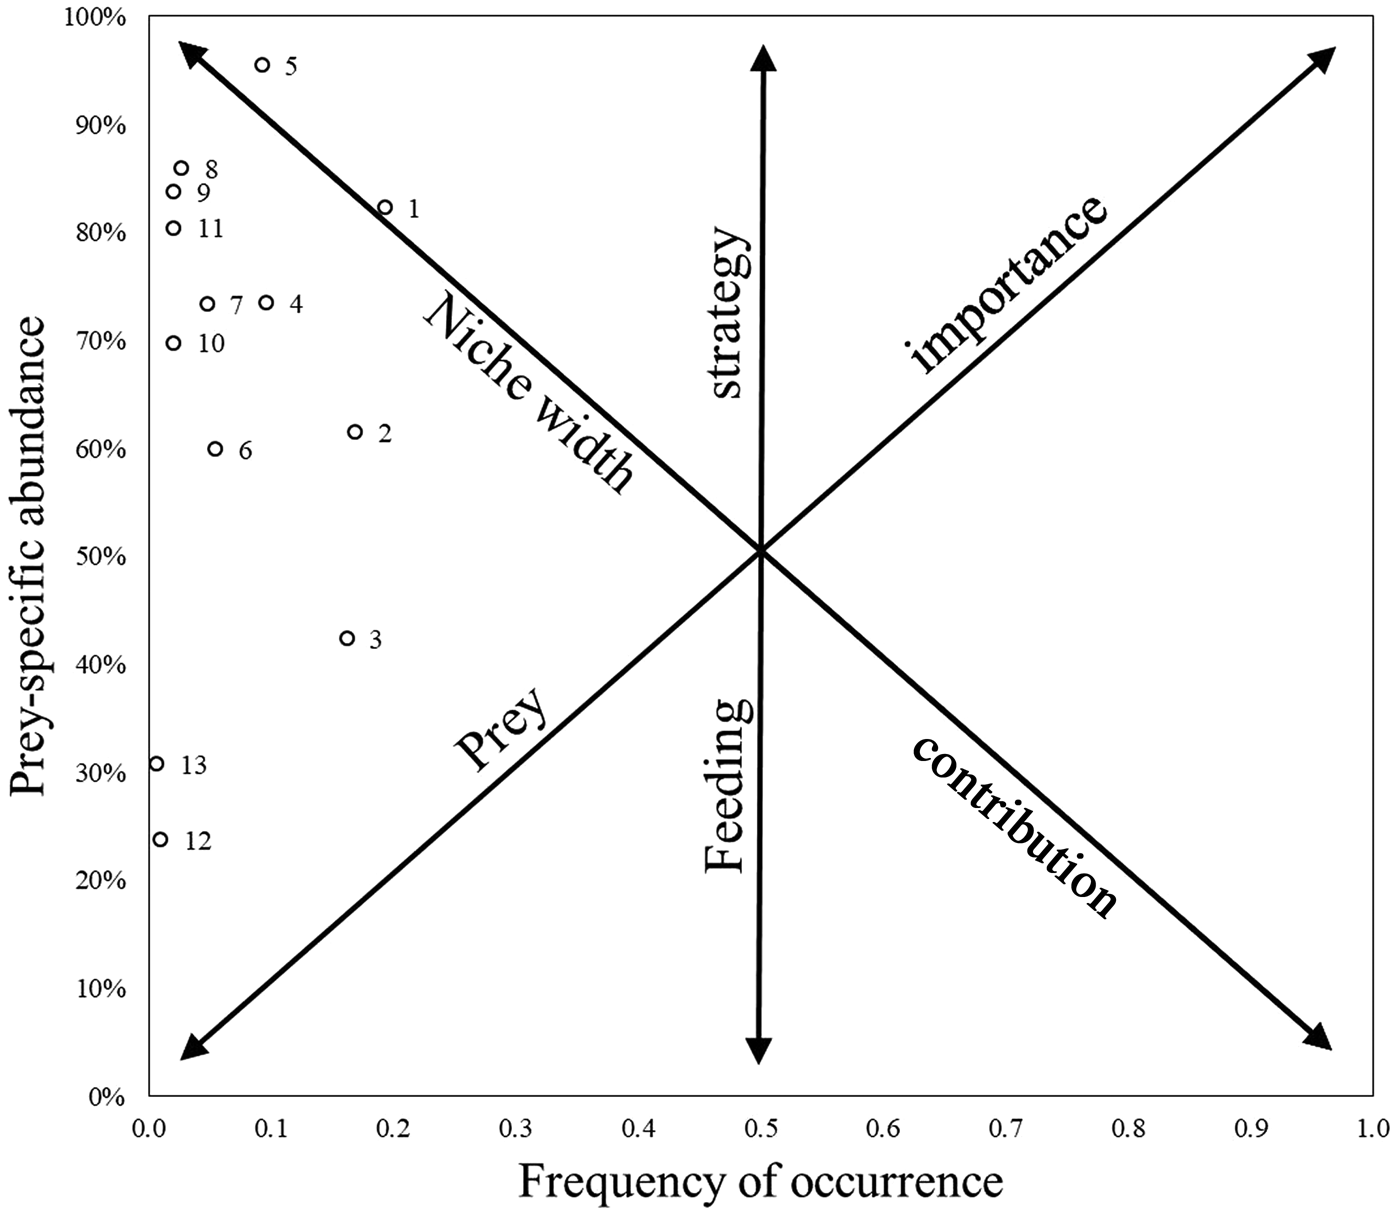
The index ranges from 0 to 1, with 0 signifying that the species consumes a single prey and 1 signifying that the species consumes available prey in equal proportions. The feeding strategy of S. putnamae was interpreted from the scatter plot constructed using the graphical method described by Costello (Reference Costello1990) and modified by Amundsen et al. (Reference Amundsen, Gabler and Staldvik1996), wherein the averaged prey-specific abundances by number and weight were plotted against the frequency of occurrence. The vertical axis represents the feeding strategy in terms of specialization or generalization, with specialists having prey points positioned in the upper part of the plot and generalists having prey points positioned in the lower part. Four feeding strategies can be deciphered from the diagram: if prey points are positioned towards the upper left corner it indicates specialization on different prey types by individual predators; if prey points are positioned towards the lower right part it indicates a generalized feeding strategy with individual variations in dietary breadth; if a single or few prey points are situated to the upper right corner and the rest close to origin it indicates population specialization towards the dominant prey types and occasional consumption of other preys; and if prey points are located all over it indicates a mixed feeding strategy with varying degrees of specialization and generalization on different prey types (Amundsen et al., Reference Amundsen, Gabler and Staldvik1996). To elucidate the feeding strategy, we excluded unidentified semi-digested (half or more digested) prey items. The trophic level of S. putnamae was calculated from the proportion and trophic level of each prey species in the diet by using the equation given by Christensen & Pauly (Reference Christensen and Pauly1992). Trophic level values for each prey species reported by Das et al. (Reference Das, Hazra, Das, Giri, Chanda, Maity and Ghosh2018) were adopted; the value of the group was assigned to those species whose values were not available.
Results
Feeding intensity
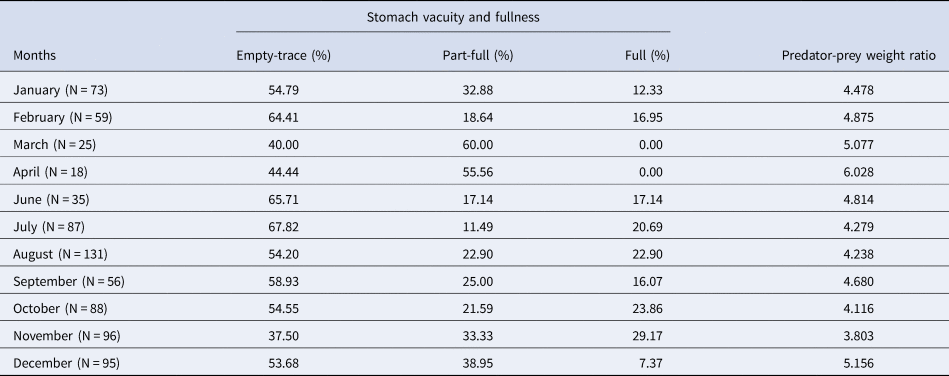
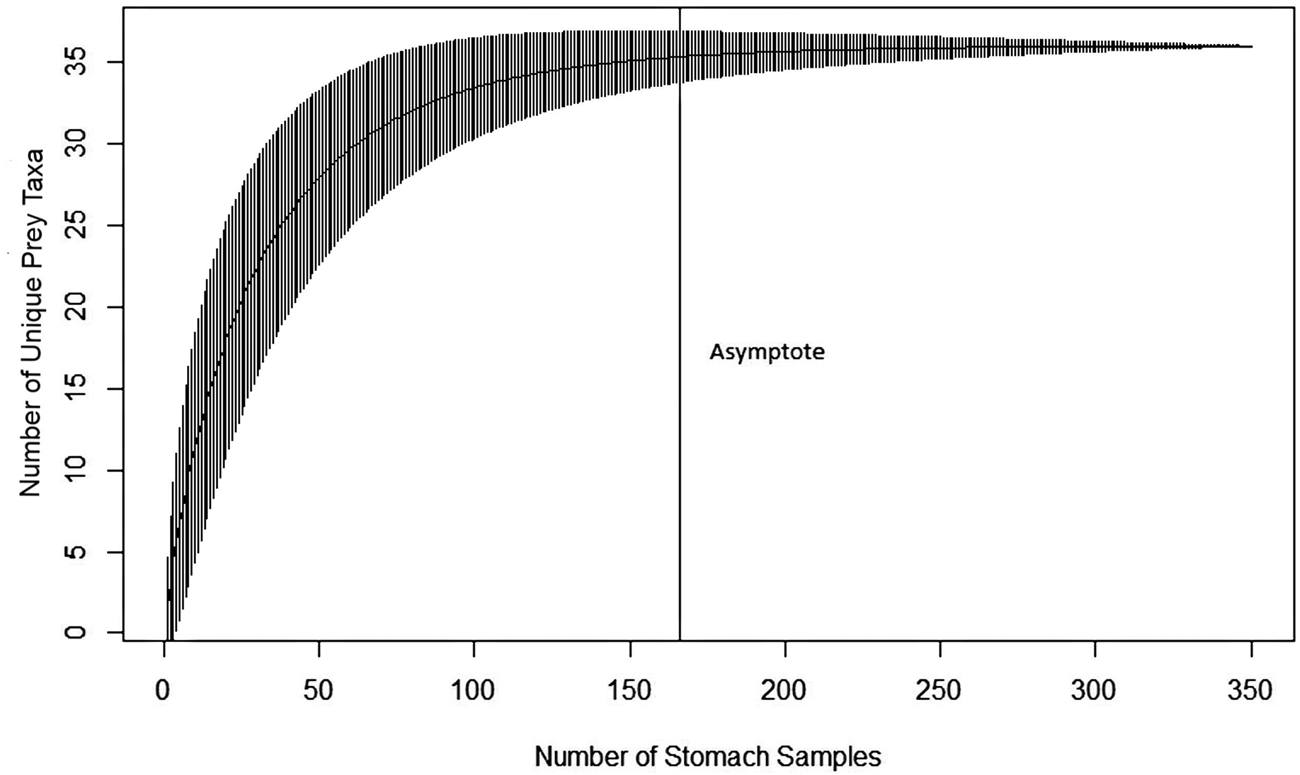
The cumulative prey curve (Figure 2) for Sphyraena putnamae reached an asymptote, which signifies that the number of stomachs analysed was sufficient to describe the diet diversity and breadth (prey stabilization occurred at 165 stomachs). Of the 763 individuals (461 females, 294 males and 8 indeterminates) analysed, 54.8% (N = 418) had either empty stomachs or stomachs with trace amounts of food, 27.3% (N = 208) had part-full stomachs, and 18.0% (N = 137) had full stomachs. Stomach vacuity was 54.76% in males and 54.01% in females. In both sexes, 26.87% and 27.98% individuals had part-full stomachs, whereas 18.37% and 18.00% individuals had full stomachs. The predator–prey weight ratio was 4.48 in males and 4.55 in females, which indicates a similar feeding intensity among both the sexes. Table 1 presents the stomach vacuity and fullness and the predator–prey weight ratio during different months. The highest feeding intensity, with the lowest stomach vacuity and the smallest predator–prey weight ratio, was observed in the month of November. In general, the feeding activity was more pronounced during July–November, with relatively higher proportion of full stomachs and smaller predator–prey weight ratios. The absence of full stomachs in March and April coupled with high predator–prey weight ratios signifies the lowest feeding activity during these months. The feeding intensity was found to increase with an increase in the body size of the fish (Table 2). The lowest feeding activity, with high stomach vacuity and greater predator–prey weight ratio, was observed in fishes with <30.0 cm LF. In fishes with 30.0–44.9 cm LF and in those with ≥60.0 cm LF, active feeding was recorded with low stomach vacuities and less predator–prey weight ratios.
Cumulative prey curve exhibiting the relationship between the number of unique prey taxa and the sampled stomachs for Sphyraena putnamae. The vertical line indicates the asymptote of the curve. The error bars on the mean represents the confidence intervals from standard deviation (standard error of the estimate).

Feeding intensity by size of Sphyraena putnamae

Feeding preference
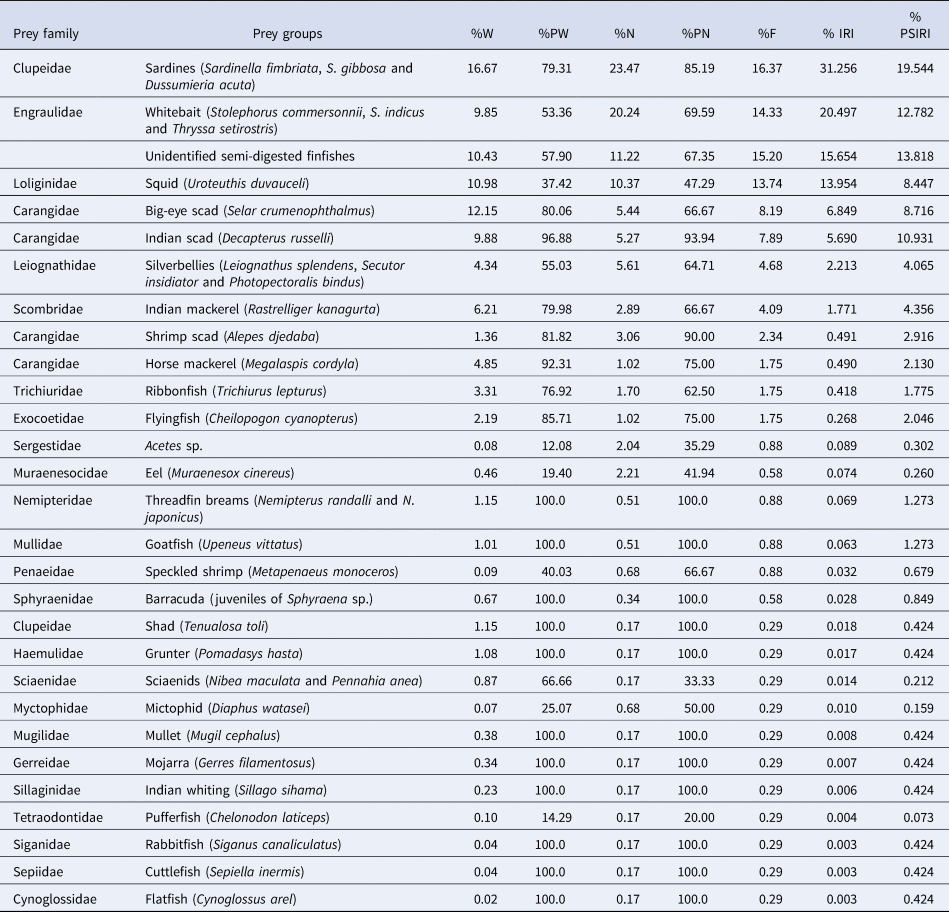
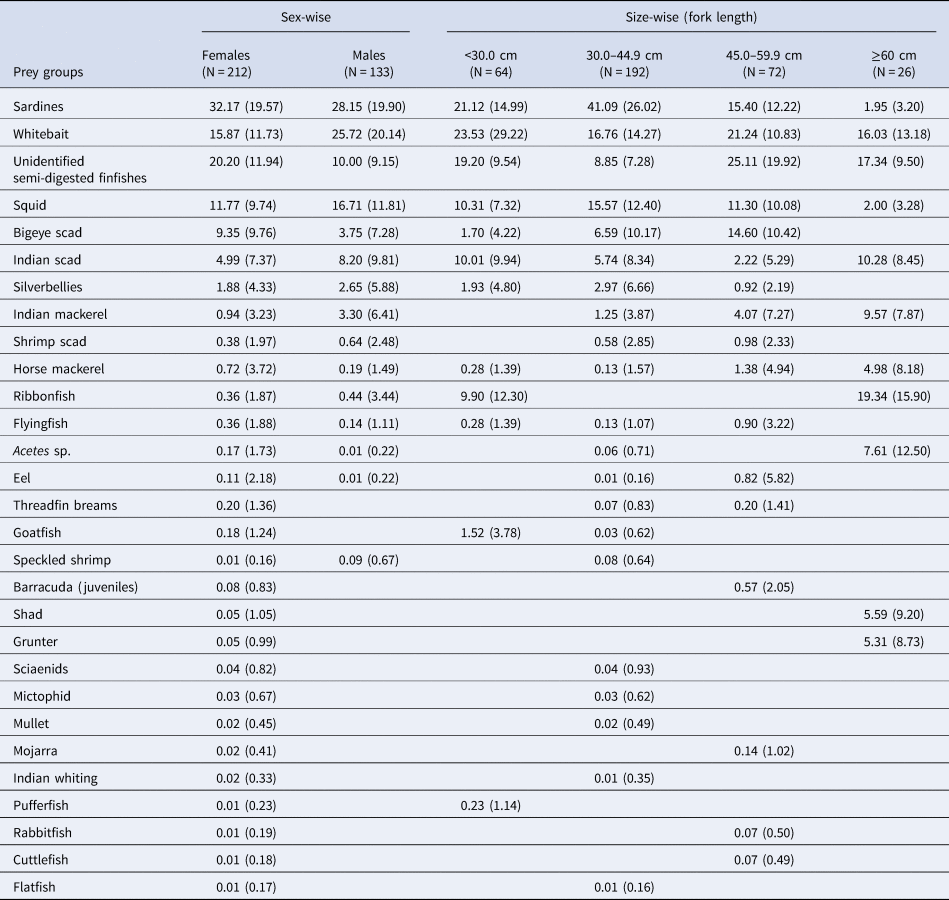
The diet of S. putnamae comprised of 36 prey species; with 32 teleost species, two crustacean species and two cephalopod species. Teleosts were the most abundant (85.92% by IRI; 90.15% by PSIRI), followed by cephalopods (13.96% by IRI; 8.87% by PSIRI). Contribution by crustaceans to the diet was meagre (0.12% by IRI; 0.98% by PSIRI) (Table 3). Juveniles of the same genus, Sphyraena were also encountered in the stomachs in small amounts (0.30% by IRI; 0.85% by PSIRI), pointing to the cannibalistic behaviour of S. putnamae. Table 4 depicts the prey groups of males and females and in different size ranges. The sex-wise analysis of dietary components revealed 82.17% similarity between males and females. The dissimilarity (17.83%) was contributed chiefly by varying occurrences of unidentified semi-digested finfish (2.21%), bigeye scad (1.86%), whitebait (1.81%), Indian mackerel (1.41%), squid (1.09%), Indian scad (1.05%), threadfin breams (0.74%), goatfish (0.71%), horse mackerel (0.69%) and sardines (0.61%).
Dietary importance of various prey groups for Sphyraena putnamae during 2017–19 (W = Weight, PW = Prey-specific Weight, N = Number, PN = Prey-specific Number, F = Frequency of Occurrence, IRI = Index of Relative Importance and PSIRI = Prey-specific Index of Relative Importance)

Sex and size based prey importance (IRI%) in Sphyraena putnamae (values in parentheses indicate PSIRI%)

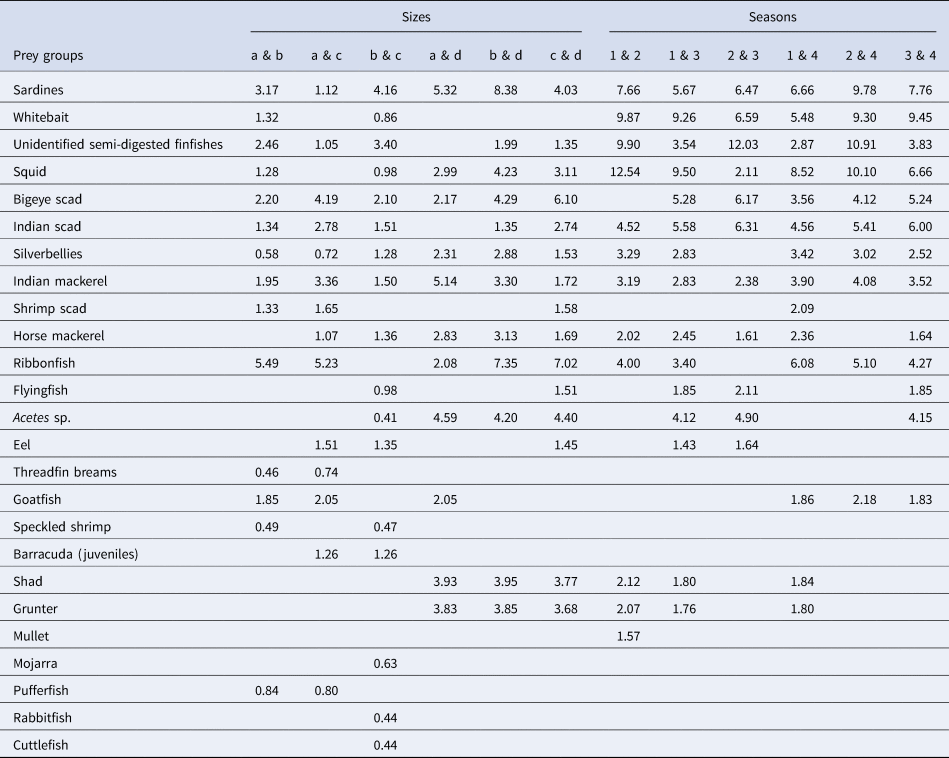
Feeding preferences were found to vary significantly with the body size (ANOSIM Global R = 0.257, P = 0.013); prey in fishes of ≥60.0 cm LF were found to significantly differ from those in fishes measuring 30.0–44.9 cm LF (ANOSIM Pairwise R = 0.360, P = 0.033) and 45.0–59.9 cm LF (ANOSIM Pairwise R = 0.331, P = 0.033). The average dissimilarity in prey between fishes measuring <30.0 cm LF and 30.0–44.9 cm LF, between those measuring <30.0 and 45.0–59.9 cm LF, and between those measuring 30.0–44.9 and 45.0–59.9 cm LF were 27.20, 30.36 and 25.31%, respectively (Table 5). Diet in fishes measuring ≥60.0 cm LF was dissimilar to the tune of 40.75, 53.50 and 50.01% respectively from that of fishes measuring <30.0, 30.0–44.9 and 45.0–59.9 cm LF (Table 5).
Contribution of major prey species (90% cut-off for low contribution) to the observed average dissimilarities between sizes (a, b, c and d indicate sizes <30.0, 30.0–44.9, 45.0–59.9 and ≥60 cm LF) and seasons (1, 2, 3 and 4 represent quarters 1, 2, 3 and 4) based on one-way SIMPER

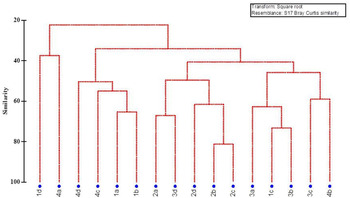
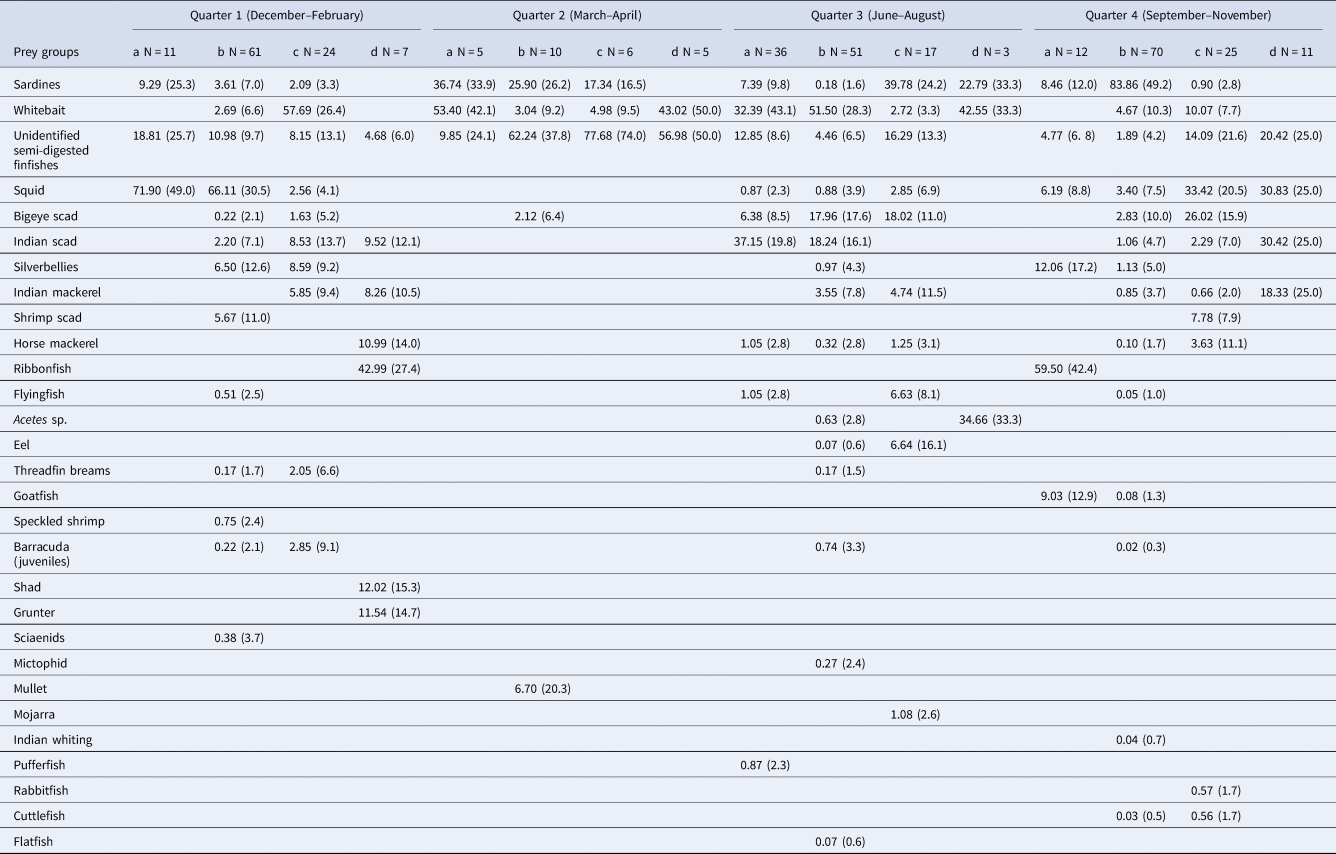
During the winter months of December–February (N = 103), squid was the preferred prey that formed 51.87% by IRI and 21.20% by PSIRI of the dietary constituents, followed by whitebait (10.09% by IRI; 10.12% by PSIRI), silverbellies (6.66% by IRI; 9.18% by PSIRI), Indian scad (4.34% by IRI; 7.99% by PSIRI), sardines (4.17% by IRI; 5.76% by PSIRI) and shrimp scad (3.11% by IRI; 6.86% by PSIRI). During summer (March and April) (N = 26), sardines (22.59% by IRI; 23.39% by PSIRI) and whitebait (18.32% by IRI; 26.56% by PSIRI) were the major prey. Unidentified semi-digested finfishes accounted for ~50% of the diet during summer months. During monsoon (June–August) (N = 107), whitebaits dominated the diet with an IRI and PSIRI contributions of 43.47 and 24.27% respectively, followed by the bigeye scad (16.89% by IRI; 13.20% by PSIRI), Indian scad (14.20% by IRI; 11.09% by PSIRI), and sardines (6.96% by IRI; 10.20% by PSIRI). In the post-monsoon months of September–November (N = 118), there was preponderance of sardines in the stomachs, with a share of 67.02% by IRI and 36.45% by PSIRI to the diet, followed by that of squid (9.29% by IRI; 10.42% by PSIRI), whitebait (5.74% by IRI; 8.58% by PSIRI), and bigeye scad (5.53% by IRI; 9.92% by PSIRI). Diet varied significantly (ANOSIM Global R = 0.354, P = 0.010) across seasons, with prey species encountered during summer differing significantly from those encountered during winter (ANOSIM Pairwise R = 0.5, P = 0.029), monsoon (ANOSIM Pairwise R = 0.448, P = 0.029) and post-monsoon (ANOSIM Pairwise R = 0.552, P = 0.029). The average dissimilarity between winter and summer seasons, winter and monsoon seasons, summer and monsoon seasons, winter and post-monsoon seasons, summer and post-monsoon seasons, and monsoon and post-monsoon seasons were 69.36, 66.86, 56.86, 59.29, 69.85 and 64.62%, respectively (Table 5). For each season, the size-based occurrence of prey groups is indicated in Table 6 and the corresponding cluster analysis is presented in Figure 3.
Dendrogram for hierarchical clustering of the size-wise prey composition across various seasons in Sphyraena putnamae using Bray–Curtis similarities calculated on square-root transformed Index of Relative Importance %. Where: 1, 2, 3 and 4 resemble quarters 1, 2, 3 and 4; a, b, c and d indicate sizes <30.0, 30.0–44.9, 45.0–59.9 and ≥60 cm LF; number followed by the alphabet signify the size range in that quarter, for example, 1a is <30.0 cm LF pertaining to 1st quarter.

Seasonal importance (IRI%) of prey by size in Sphyraena putnamae (values in parentheses indicates PSIRI%) (Quarters 1, 2, 3 and 4 represent winter, summer, monsoon and post-monsoon seasons respectively; a, b, c and d signifies <30.0, 30.0–44.9, 45.0–59.9 and ≥60 cm LF)

Feeding strategy
The Levin's Standardized Niche Breadth Index was found to be 0.21. Feeding was comparatively specialized with a limited niche width in fishes measuring <45.0 cm LF, and the Levin's Standardized Niche Breadth Index values varied from 0.23 to 0.36. In fishes with ≥45.0 cm LF, generalized feeding on wider prey species was reported with values ranging from 0.50 to 0.68. The niche breadth index was higher during summer (0.41), winter (0.36) and monsoon (0.31) seasons, indicating a relatively broader feeding niche, whereas it was the lowest (0.17) during post-monsoon months. The trophic level value was found to be 3.51 ± 0.13 (mean ± SE), specifying the species to be a high-level pelagic carnivore.
Despite high prey-specific abundances, all major prey groups exhibited low frequency of occurrences (Figure 4). Though the S. putnamae population as a whole appeared to be relatively generalist predators that feed on diverse prey species, groups of individuals specialized on selective prey types. The major prey species such as sardines, whitebait and squid showed relatively higher occurrences, which indicates that these species were preyed upon by more individuals. Shrimp scad, ribbonfish, theadfin bream, flyingfish, horse mackerel and eel showed low occurrences, which indicates that these species were occasional prey. The highest prey-specific abundances were for Indian scad, shrimp scad, horse mackerel and sardines, which signify that these species were consumed by individuals displaying greater specialization.
Graphical representation of feeding strategy in Sphyraena putnamae following Amundsen et al. (Reference Amundsen, Gabler and Staldvik1996). Feeding strategy depicted by plotting the prey-specific abundance (%) against frequency of occurrence (%) for dominant prey groups. The two diagonal axes represent the importance of prey and the contribution to niche width and the vertical axis defines the predator feeding strategy. Where: 1 – sardines; 2 – whitebait; 3 – squid; 4 – bigeye scad; 5 – Indian scad; 6 – silverbellies; 7 – mackerel; 8 – shrimp scad; 9 – horse mackerel; 10 – ribbonfish; 11 – flyingfish; 12 – Acetes sp.; 13 – eel.

Discussion
Sphyraena species are known to be voracious predators that use their elongated lower jaw and protruding strong teeth to pierce and expeditiously eat live prey (Habegger et al., Reference Habegger, Motta, Huber and Deban2010). Stomach vacuity in the present study was 54.8%, which was higher than that reported in the north of Persian Gulf (47.3%) (Mohammadizadeh et al., Reference Mohammadizadeh, Valinassab, Jamili, Matinfar, Bahri-Shabanipour and Mohammadizadeh2010). Globally, for other barracuda species such as S. barracuda, S. guachancho and S. chrysotaenia, the stomach vacuity has been reported to be high (range 56–63%) (Schmidt, Reference Schmidt1989; Ragheb, Reference Ragheb2003; Akadje et al., Reference Akadje, Diaby, LeLoc'h, Konan and N'da2013; Osman et al., Reference Osman, El Ganainy and Amin2019); whereas in S. ensis, S. sphyraena, S. viridensis and S. flavicauda, the stomach vacuity has been observed to be low (range 14–40.8%) (Barreiros et al., Reference Barreiros, Santos and De Borba2002; Ragheb, Reference Ragheb2003; Kalogirou et al., Reference Kalogirou, Mittermayer, Pihl and Wennhage2012; Moreno-Sanchez et al., Reference Moreno-Sanchez, Palacios-Salgado, Granados-Amores, Abitia-Cardenas and Escobar-Sanchez2019; Osman et al., Reference Osman, El Ganainy and Amin2019). High values of stomach vacuity in some species are mostly due to the physiological disturbance related to the mode of capture (Arrington et al., Reference Arrington, Winemiller, Loftus and Akin2002). For S. putnamae caught in multiday trawls along the western Bay of Bengal, the stress caused to the fishes during their capture and retention in the cod-end mesh could have resulted in regurgitation of prey due to contraction of the oesophageal muscle, leading to high incidence of empty stomachs. Peak feeding intensity during November and high feeding activity from July to November were probably related to the reproductive season of S. putnamae. During the post-spawning months when gonads are in the spent state, the space available for the stomachs to expand and be fully gorged with food materials is maximum. Additionally, following the major spawning peak, enormous accumulation of energy reserves is required for the development and maturation of gonads, and therefore, the feeding activity reaches its peak. A decrease in feeding intensity during peak spawning months has also been reported by Premalatha & Manojkumar (Reference Premalatha and Manojkumar1990), Bertoni (Reference Bertoni1994), Ragheb (Reference Ragheb2003), Hosseini et al. (Reference Hosseini, Jamili, Valinssab, Vosoghi and Fatemi2009) and Osman et al. (Reference Osman, El Ganainy and Amin2019) in S. jello, S. obtusata, S. novaehollandiae, S. chrysotaenia and S. flavicauda, respectively. Seasonal changes in the stomach vacuity and fullness as well as in the predator–prey weight ratio prompts us to infer that the peak spawning of S. putnamae in the western Bay of Bengal occurs most probably during March and April. However, for the same species from the Arabian Sea of the Indian Ocean, two spawning peaks, with a distinct peak during April–May and a less prominent peak during November–January have been reported (Rajesh et al., Reference Rajesh, Rohit, Abdussamad and Viswambharam2020).
To date, maximum LFs for S. putnamae has been found to vary from 93.0 cm (Mohammadizadeh et al., Reference Mohammadizadeh, Valinassab, Jamili, Matinfar, Bahri-Shabanipour and Mohammadizadeh2010) to 100.0 cm globally (Rajesh et al., Reference Rajesh, Rohit, Abdussamad and Viswambharam2020). The present study recorded individuals larger than 100.0-cm LF, and the maximum LF observed was 123.0 cm, with a weight of 6104 g, which is the highest ever length recorded for the species. The increase in lengths could be attributed to the difference in the area of sampling, as according to Whitehead et al. (Reference Whitehead, Bauchot, Hureau, Nielson and Tortonese1986), small barracudas are found close to coastal areas and large individuals are found in the open sea. An increase in feeding intensity with an increase in fish size was observed, which is corroborated by the values of stomach vacuity and fullness and predator–prey weight ratios. Large individuals of barracuda species possess superior abilities to scout, attack and capture compared with small individuals (Moreno-Sanchez et al., Reference Moreno-Sanchez, Palacios-Salgado, Granados-Amores, Abitia-Cardenas and Escobar-Sanchez2019). In addition, the increase in age and size is associated with several morphological alterations such as enhanced mouth gape/aperture and improved locomotive ability, which in turn increases the efficiency of predation (Labropoulou & Eleftheriou, Reference Labropoulou and Eleftheriou1997).
Similar to other tropical large pelagic species, S. putnamae is a pelagic piscivorous predator, with teleosts contributing to more than 85% of the diet. Similarly, in S. picullidae and S. barracuda from the western Indian Ocean (Randall, Reference Randall1967), S. ensis from the southern shelf of Colombia (Lopez-Peralta & Arcila, Reference Lopez-Peralta and Arcila2002), S. barracuda from Colombia (Hooker et al., Reference Hooker, Castro-Gonzalez, Howard, Quintero and Sanabria2007) and S. viridensis, S. sphyraena and S. chrysotaenia from Rhodes Island (Kalogirou et al., Reference Kalogirou, Mittermayer, Pihl and Wennhage2012), teleosts contributed 97% and 82%, 95%, 98%, >90% of the dietary constituents, respectively. Species belonging to Clupeidae, Engraulidae, Carangidae, Leiognathidae and Scombridae constituted the dominant prey. Squid also contributed significantly to the diet. Though squid dwell in deep waters, they perform diel vertical migration to the water surface (Anusha & Fleming, Reference Anusha and Fleming2014), and this is when they are preyed upon. Clupeids were observed to be the major prey species in the diet of S. ensis (Moreno-Sanchez et al., Reference Moreno-Sanchez, Palacios-Salgado, Granados-Amores, Abitia-Cardenas and Escobar-Sanchez2019) and S. sphyraena (Kalogirou et al., 2012). Barreiros et al. (Reference Barreiros, Santos and De Borba2002) have reported that barracudas consume more cephalopods and less crustaceans. Cannibalistic nature was observed to a lesser extent in S. putnamae than in S. guachancho (Akadje et al., Reference Akadje, Diaby, LeLoc'h, Konan and N'da2013). Sphyraena putnamae was observed to feed mostly on schooling epipelagic prey species; and therefore, it is deemed as a surface water feeder similar to few other barracuda species (Kalogirou et al., Reference Kalogirou, Mittermayer, Pihl and Wennhage2012; Moreno-Sanchez et al., Reference Moreno-Sanchez, Palacios-Salgado, Granados-Amores, Abitia-Cardenas and Escobar-Sanchez2019). Furthermore, the presence of actively swimming prey species belonging to the families Clupeidae, Engraulidae, Carangidae and Scombridae in the diet in large amounts suggests that the species is a fast-swimming and aggressive feeder that chases and captures its prey. According to Barreiros et al. (Reference Barreiros, Santos and De Borba2002), predation in barracudas is most effective when several individuals form schools and attack pelagic school-forming prey.
A study conducted by Mohammadizadeh et al. (Reference Mohammadizadeh, Valinassab, Jamili, Matinfar, Bahri-Shabanipour and Mohammadizadeh2010) has reported that 98% of the stomach content of S. putnamae comprises fish fragments. However, because of a considerable time-lag between the capture and analysis in the above study (Mohammadizadeh et al., Reference Mohammadizadeh, Valinassab, Jamili, Matinfar, Bahri-Shabanipour and Mohammadizadeh2010), prey species were detected in an advanced state of digestion, and hence, the qualitative and quantitative analysis of prey items could not be performed. Nevertheless, the authors (Mohammadizadeh et al., Reference Mohammadizadeh, Valinassab, Jamili, Matinfar, Bahri-Shabanipour and Mohammadizadeh2010) had recorded fragments of Indian mackerel, whitebait, Indian oil sardine, scads and silverbellies, which are consistent with the findings of the present study. Other barracuda species distributed worldwide have been reported to feed on diverse prey species, for example, S. obtusata feeds on whitebait, sardines and scads; S. jello feeds on Indian mackerel, horse mackerel, scads, lizardfishes and cuttlefishes; S. guachancho feeds on species of Clupeidae, Sphyraenidae, Carangidae and Engraulidae; S. ensis feeds on species of Clupeidae and Hemiramphidae; S. sphyraena feeds on species of Clupeidae, Atherinidae and Sparidae; S. viridensis feeds on species of Carangidae, Atherinidae and Sparidae; S. chrysotaenia feeds on breams, whitebait, horse mackerel, scads, lizardfishes and cephalopods; and S. flavicauda feeds on whitebait, penaeid shrimps and squids (Premalatha & Manojkumar, Reference Premalatha and Manojkumar1990; Barreiros et al., Reference Barreiros, Santos and De Borba2002; Ragheb, Reference Ragheb2003; Bachok et al., Reference Bachok, Mansor and Noordin2004; Dananjanie et al., Reference Dananjanie, De Croos and Dissanayake2009; Hosseini et al., Reference Hosseini, Jamili, Valinssab, Vosoghi and Fatemi2009; Kalogirou et al., Reference Kalogirou, Mittermayer, Pihl and Wennhage2012; Akadje et al., Reference Akadje, Diaby, LeLoc'h, Konan and N'da2013; Moreno-Sanchez et al., Reference Moreno-Sanchez, Palacios-Salgado, Granados-Amores, Abitia-Cardenas and Escobar-Sanchez2019; Osman et al., Reference Osman, El Ganainy and Amin2019).
Prey composition was different between individuals with <60.0 cm and >60.0 cm LF. There was a preponderance of sardines, squid and bigeye scad in the former and that of ribbonfish, shad, grunter, Indian mackerel, horse mackerel and Acetes sp. in the latter. Apart from Acetes sp., most other prey preferred by S. putnamae with >60.0 cm LF were all of large body sizes. Therefore, it is evident that in S. putnamae, the prey selectivity is influenced by mouth gape and prey body sizes. Furthermore, dietary shifts, as the fish grows in size, reduce the intraspecific competition among various age groups (Oxenford & Hunte, Reference Oxenford and Hunte1999). Similar observations in large fishes preferring bigger epipelagic and mesopelagic fishes as prey were reported in other barracudas by De Sylva (Reference De Sylva1963) and Kalogirou et al. (Reference Kalogirou, Mittermayer, Pihl and Wennhage2012). However, for S. putnamae, in various size groups of fishes measuring <60.0 cm (LF), the diet was similar, as reported earlier in S. obtusata (Dananjanie et al., Reference Dananjanie, De Croos and Dissanayake2009) and S. guachancho (Akadje et al., Reference Akadje, Diaby, LeLoc'h, Konan and N'da2013).
Fluctuations in the observed prey composition across seasons were mostly due to variations in biomass of the available prey in each season. Higher productivity, triggered by enhanced nutrient availability in the coastal waters of the Bay during summer, monsoon and post-monsoon, could have resulted in increased abundances of clupeids and engraulids, which were preyed upon in substantial amounts. In winter, S. putnamae opportunistically preyed upon squid when the biomass of clupeids and engraulids was low. Seasonal resource pulses are important components of annual energy budgets for many species, and the same was observed in the case of S. putnamae. This observation is consistent with the optimal foraging theory (Gerking, Reference Gerking1994), wherein feeding on available or abundant prey species allows S. putnamae to obtain greater energy benefits because of the less energy expenditure for search and capture of the prey. The proportion of unidentified semi-digested finfish in stomach contents was high in summer because of the extended hauling period, which resulted in a substantial delay between capture and gear retrieval, and post-capture digestion commenced during this period. Therefore, similar to most mobile large pelagic species (Oxenford & Hunte, Reference Oxenford and Hunte1999), S. putnamae forage the available and easy to catch prey species when the prey distribution is spatio-temporally uneven, thereby maximizing their feeding success. Similar seasonal alternations in prey preferences have been observed in S. barracuda, S. guachancho and S. ensis (De Sylva, Reference De Sylva1963; Bedia-Sánchez et al., 2011; Moreno-Sanchez et al., Reference Moreno-Sanchez, Palacios-Salgado, Granados-Amores, Abitia-Cardenas and Escobar-Sanchez2019) owing to fluctuations in the prey availability and abundance caused by varying environmental conditions.
A trophic level value of 3.51 ± 0.13 indicates that S. putnamae is a high-level carnivore that predates mostly the mid-level carnivores. With a strong mouth and sharp teeth, barracudas are voracious predators (Fischer & Bianchi, Reference Fischer and Bianchi1984), which locate their prey with the help of sharp visual power and strong olfactory senses (Sinha, Reference Sinha1987). The dietary breadth is a measure of trophic specialization (Amundsen et al., Reference Amundsen, Gabler and Staldvik1996), and low values indicate that S. putnamae is a specialized feeder similar to S. ensis (Moreno-Sanchez et al., Reference Moreno-Sanchez, Palacios-Salgado, Granados-Amores, Abitia-Cardenas and Escobar-Sanchez2019). A high niche breadth during monsoon and winter is probably due to the higher diversity of prey during these seasons. The dietary breadth of a predator is strongly correlated to its body size, and larger predators by virtue of their improved growth-related predatory abilities feed on a wider range of prey than smaller predators (Cohen et al., Reference Cohen, Pimm, Yodzis and Saldana1993). Similarly, in S. putnamae, the feeding strategy shifted from being specialist to generalist along with the increase in body size. Fishes measuring less than 45.0 cm LF relied heavily on a few prey species, which were consumed in abundance and resulted in a narrow food spectrum. Conversely, at ≥45.0 cm LF, fishes became more opportunistic and fed upon a wider prey spectrum, which included both small and large prey species. With an increase in the mouth and body size of the predator, ontogenic shifts in the diet content permits it to catch a wide range of prey species differing in size and type (Labropoulou & Eleftheriou, Reference Labropoulou and Eleftheriou1997).
Predators exhibit intra-population behavioural differences and move and forage differently from conspecifics; therefore, individuals or groups within a population vary considerably in their usage of habitat and resources (Jaeger et al., Reference Jaeger, Connan, Richard and Cherel2010). Individual specialization in a population is a strategy to reduce the intra-specific competition among large predators (Bolnick et al., Reference Bolnick, Svanback, Fordyce, Yang, Davies, Hulsy and Forister2003). Similar feeding strategy of individual or subgroup specialization and high between-phenotype contribution to the niche width were observed in S. putnamae, wherein all prey groups exhibited low percentage occurrences, despite high prey-specific abundances. Individuals or subgroups of S. putnamae had specialized in predating different prey types, and each prey group was consumed by only a limited fraction of the population. However, the influence of seasonal prey abundances or availability on the feeding strategy cannot be discounted, as the species was found to feed on a variety of prey groups. Possibly, temporal variations in the prey-resource availability for S. putnamae contributed to a false sense of specialization in feeding. Therefore, considering S. putnamae as an opportunistic predator rather than a specialist predator would be apt, with trophic plasticity permitting feeding on the available and abundant prey species.
The conventional stomach content analysis is often confounded by variations in prey assimilation efficiencies and hence provides only a snapshot of the prey consumed over a limited time frame. Therefore, to minimize biases between ingested and assimilated prey, combining or complementing traditional approaches with stable isotope analysis has become a key practice for estimating the trophic metrics of predators (Pacioglu et al., Reference Pacioglu, Zubrod, Sculz, Jones and Parvulescu2019). Stable isotopic ratios of carbon and nitrogen within predator tissues reflect those in their prey, which provides a proxy for the assimilated diet and thereby, illustrates the trophic position and foraging habitat. Additionally, temporal variability in the diet can be ascertained by comparing the isotopic values of multiple tissues with different turnover rates (Bearhop et al., Reference Bearhop, Adams, Waldron, Fuller and Macleod2004). In conventional studies, non-assimilated materials often tend to accumulate over a short time frame, which results in an overestimation of the concentration of these materials. Therefore, trophic level estimates are not as accurate as that obtained from isotopic ratios (Williams & Martinez, Reference Williams and Martinez2004).
Conclusion
Sphyraena putnamae, a high-level epipelagic carnivore with piscivorous predatory nature, is considered to play a crucial role in the energy transfer of pelagic ecosystems in major oceans. The present study on the trophodynamics of S. putnamae is the first comprehensive study on this species globally to delineate its role in the food web. The information generated on diet will be crucial in understanding the species ecology, trophic interrelationships, and energy flow through ecosystems for potential use in trophic ecosystem modelling, thereby facilitating ecosystem-based fishery management. Changes in the abundance of this predator may cause trophic cascades in coastal communities, leading to ecosystem shifts. Their removal by fishing would release their major prey, such as sardines, whitebait and squid, from predation, which in turn would increase the mortality rate of resources at the lower trophic levels that are being fed upon by these prey, and consequently, result in changes of the food web. However, prey-resource partitioning between S. putnamae and its competitors must be evaluated prior to concluding on trophic cascades and ecosystem shifts. Because of the sensitivity of predators to changes in the prey availability, impacts of fishing on prey species could negatively regulate the predator abundance, and therefore, the management of prey species is equally vital for ensuring a healthy predator population. Future research on seasonal changes in the prey availability and biomass along the western Bay of Bengal would help to complement the present study on the feeding strategy of S. putnamae and confirm whether the species is an opportunistic feeder like most large predators or a predator with individual or subgroup specialization. Understanding these aspects is crucial because generalist predators exert a strong top-down control on the highly diverse communities in tropical ecosystems.
Acknowledgements
We sincerely thank Dr Loveson Edward, Dr Muktha Menon, Dr Gyanaranjan Dash and Dr Pralaya Ranjan Behera and all the staff members of Visakhapatnam Regional Centre for the constant help and support provided to carry out the study. We acknowledge the contribution of Ms Natalie Simmons from Scholarly Editing and Translation Services Private Limited and Dr Nandini Menon N, Nansen Environmental Research Centre for editing the manuscript.
Financial support
This work was supported by the Indian Council of Agricultural Research (ICAR), New Delhi, India.