Introduction
Plasma-based electron accelerators employing the laser wakefield acceleration (LWFA) mechanism (Tajima and Dawson, Reference Tajima and Dawson1979) have drawn a great attention in the past decade, as they allow for extremely intense acceleration wave fields (called wakefields) to be sustained within the compact dimensions of a plasma, allowing electrons of relativistic energies within only a few mm of interaction length, depending on the plasma density and laser intensity. A typical LWFA utilizes laser pulses of sufficient intensity (normalized vector potential a0 ≥2) and ultra-short duration (≤30 fs) to reach the “bubble” or “blow-out” regime (Pukhov and Meyer-ter Vehn, Reference Pukhov and Meyer-ter Vehn2002; Tsung et al., Reference Tsung, Narang, Mori, Joshi, Fonseca and Silva2004), where wavebreaking and self-injection of the background wake fluid electrons are initiated. Here,  $a_0 = 8.6 \times 10^{10}\; \sqrt {I[W/{\rm c}{\rm m}^2]} \times \lambda [\mu m]$, where I is the laser intensity defined as
 $I = \; 2P/{\rm \pi \omega} _0^2 $, where ω0 is the laser focus spot size and λ is the laser wavelength.
State-of-the-art LWFA experiments have recently demonstrated ultrashort electron bunches (Lundh et al., Reference Lundh, Lim, Rechatin, Ammoura, Ben-Ismail, Davoine, Gallot, Goddet, Lefebvre, Malka and Faure2011) and multi-GeV electron energy gain on the order of several centimeters (Leemans et al., Reference Leemans, Gonsalves, Mao, Nakamura, Benedetti, Schroeder, Tóth, Daniels, Mittelberger, Bulanov, Vay, Geddes and Esarey2014; Wang et al., Reference Wang, Zgadzaj, Fazel, Li, Yi, Zhang, Henderson, Chang, Korzekwa, Tsai, Pai, Quevedo, Dyer, Gaul, Martinez, Bernstein, Borger, Spinks, Donovan, Khudik, Shvets, Ditmire and Downer2013). However, electron acceleration relying on wavebreaking and self-injection, which are uncontrollable processes, is less stable and chaotic, with various methods proposed or implemented to better control the injection process in wavebreaking conditions. These methods include either the use of multiple laser pulses (Fubiani et al., Reference Fubiani, Esarey, Schroeder and Leemans2004; Thomas et al., Reference Thomas, Murphy, Mangles, Dangor, Foster, Gallacher, Jaroszynski, Kamperidis, Lancaster, Norreys, Viskup, Krushelnick and Najmudin2008; Rechatin et al., Reference Rechatin, Faure, Ben-Ismail, Lim, Fitour, Specka, Videau, Tafzi, Burgy and Malka2009), modulations in the continuity of the plasma density (Bulanov et al., Reference Bulanov, Naumova, Pegoraro and Sakai1998; Schmid et al., Reference Schmid, Buck, Sears, Mikhailova, Tautz, Herrmann, Geissler, Krausz and Veisz2010), and ionization-induced injection (Clayton et al., Reference Clayton, Ralph, Albert, Fonseca, Glenzer, Joshi, Lu, Marsh, Martins, Mori, Pak, Tsung, Pollock, Ross, Silva and Froula2010; McGuffey et al., Reference McGuffey, Thomas, Schumaker, Matsuoka, Chvykov, Dollar, Kalintchenko, Yanovsky, Maksimchuk, Krushelnick, Bychenkov, Glazyrin and Karpeev2010; Pak et al., Reference Pak, Marsh, Martins, Lu, Mori and Joshi2010; Pollock et al., Reference Pollock, Clayton, Ralph, Albert, Davidson, Divol, Filip, Glenzer, Herpoldt, Lu, Marsh, Meinecke, Mori, Pak, Rensink, Ross, Shaw, Tynan, Joshi and Froula2011; Mirzaie et al., Reference Mirzaie, Li, Zeng, Hafz, Chen, Li, Zhu, Liao, Sokollik, Liu, Ma, Chen, Sheng and Zhang2015), at the cost of an increased experimental complexity, that is, use of a second laser beam, more sophisticated target designs and dual-gas mixing and so on. Moreover, for the wavebreaking regime to be accessed, most LWFA experiments to date utilize >10 TW power laser systems with typical pulse duration around 30–50 fs, due to technological availability. In recent years (Schmid et al., Reference Schmid, Veisz, Tavella, Benavides, Tautz, Herrmann, Buck, Hidding, Marcinkevicius, Schramm, Geissler, Meyer-ter-Vehn, Habs and Krausz2009; Lifschitz and Malka, Reference Lifschitz and Malka2012; Guénot et al., Reference Guénot, Gustas, Vernier, Beaurepaire, Bhle, Bocoum, Lozano, Jullien, Lopez-Martens, Lifschitz and Faure2017; Xu et al., Reference Xu, Buck, Chou, Schmid, Shen, Tajima, Kaluza and Veisz2017), sub-TW and few-TW laser systems generating single-cycle to few-cycles laser pulses were proposed or used to generate up to ~25 MeV electron beams via LWFA wavebreaking in high-density gas targets, with simulations showing electron beams of the order of ~1 fs in duration.
In this paper, we extend the scheme of ionization-induced injection by using a single high-Z gas medium, avoiding any gas mixing or multiple gas staging (Clayton et al., Reference Clayton, Ralph, Albert, Fonseca, Glenzer, Joshi, Lu, Marsh, Martins, Mori, Pak, Tsung, Pollock, Ross, Silva and Froula2010; McGuffey et al., Reference McGuffey, Thomas, Schumaker, Matsuoka, Chvykov, Dollar, Kalintchenko, Yanovsky, Maksimchuk, Krushelnick, Bychenkov, Glazyrin and Karpeev2010; Pak et al., Reference Pak, Marsh, Martins, Lu, Mori and Joshi2010; Pollock et al., Reference Pollock, Clayton, Ralph, Albert, Davidson, Divol, Filip, Glenzer, Herpoldt, Lu, Marsh, Meinecke, Mori, Pak, Rensink, Ross, Shaw, Tynan, Joshi and Froula2011). We show, via two-dimensional-particle-in-cell (2D-PIC) simulations, that <1 TW, few-cycle laser pulses can generate relativistic ~1 fs electron bunches, rendering LWFA accessible to a wider range of laser laboratories. We are, therefore, investigating greatly simplified experimental requirements, by dramatically reducing the required laser power as well as allowing for simpler target designs. Due to the extremely short duration of the drive laser pulse, a high density, non-linear wake (but not up to wavebreaking conditions) needs to be driven. To that end, high-Z gas such as O, Ne, Ar or Xe, allowing for multiple ionization levels to appear, can be used with promising results. The initial neutral density of the medium can remain at a moderate level. For example, assuming a laser pulse of 2 × 10¹⁸ Wcm−2 intensity, then via the barrier-suppression ionization mechanism of the Ammosov-Delone-Krainov (ADK) model (Ammosov et al., Reference Ammosov, Delone and Krainov1986), each Ar neutral atom interacting with such a laser field, will contribute up to 10 electrons as the appearance intensity is (I app~2.1 × 10¹⁸ Wcm−2) for Ar X (referring to the 10th ionization electron). Thus, for an initial neutral Ar density of 1019 cm−3 the equivalent electron density near the peak intensity of the laser pulse would be 1020 cm−3. Through such high electron densities, intense self-focusing/compression of the laser pulse allows for sufficiently high intensities to be reached, but at reduced values as determined in the 1D analysis in (Chen et al., Reference Chen, Esarey, Schroeder, Geddes and Leemans2012). We show that for a given laser system the choice of gas species is crucial, as each gas offers available states with different ionization energy, and consequently different injection phase/time in the plasma wake's Hamiltonian. Moreover, we believe that our simulations can explain some of the experimental work of Chen et al. (Reference Chen, Unick, Vafaei-Najafabadi, Tsui, Fedosejevs, Naseri, Masson-Laborde and Rozmus2008) and Mo et al. (Reference Mo, Ali, Fourmaux, Lassonde, Kieffer and Fedosejevs2012).
Simulations
In our investigation, we considered the interaction of 0.5 TW, 10 fs laser pulse, focused at 5 µm [full width at half maximum (FWHM)] with underdense plasma formed from single, high-Z gas species. The gases used were N, O, Ne, Ar, and Xe. We performed 2D simulations with the PIC code EPOCH (Brady and Arber, Reference Brady and Arber2011), which includes field ionization based on the ADK ionization model (Ammosov et al., Reference Ammosov, Delone and Krainov1986). The simulation window was set to 22–26 µm, with a spatial resolution of 1018 × 401 cells (37 cells per laser wavelength in x, the laser propagation direction). To avoid noise injection (Chen et al., Reference Chen, Cormier-Michel, Geddes, Bruhwiler, Yu, Esarey, Schroeder and Leemans2013), each cell contained five neutral gas particles. The entrance density ramp in the gas region was set to 15 µm.
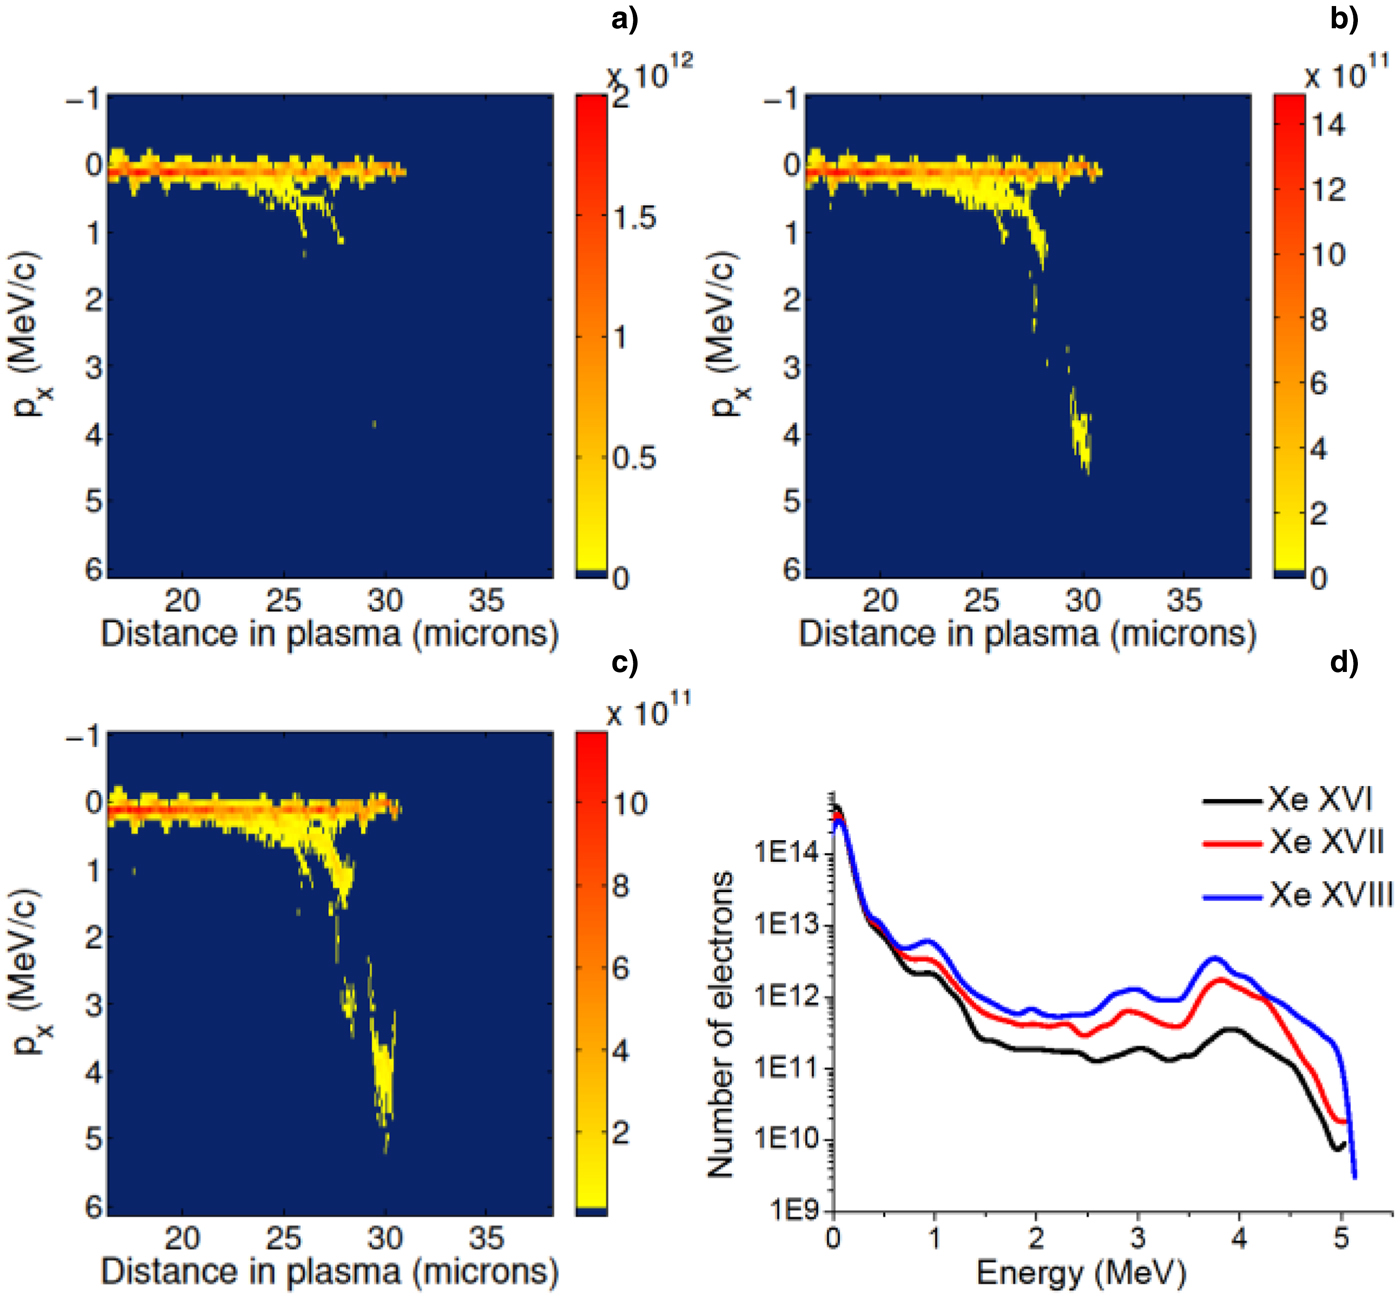
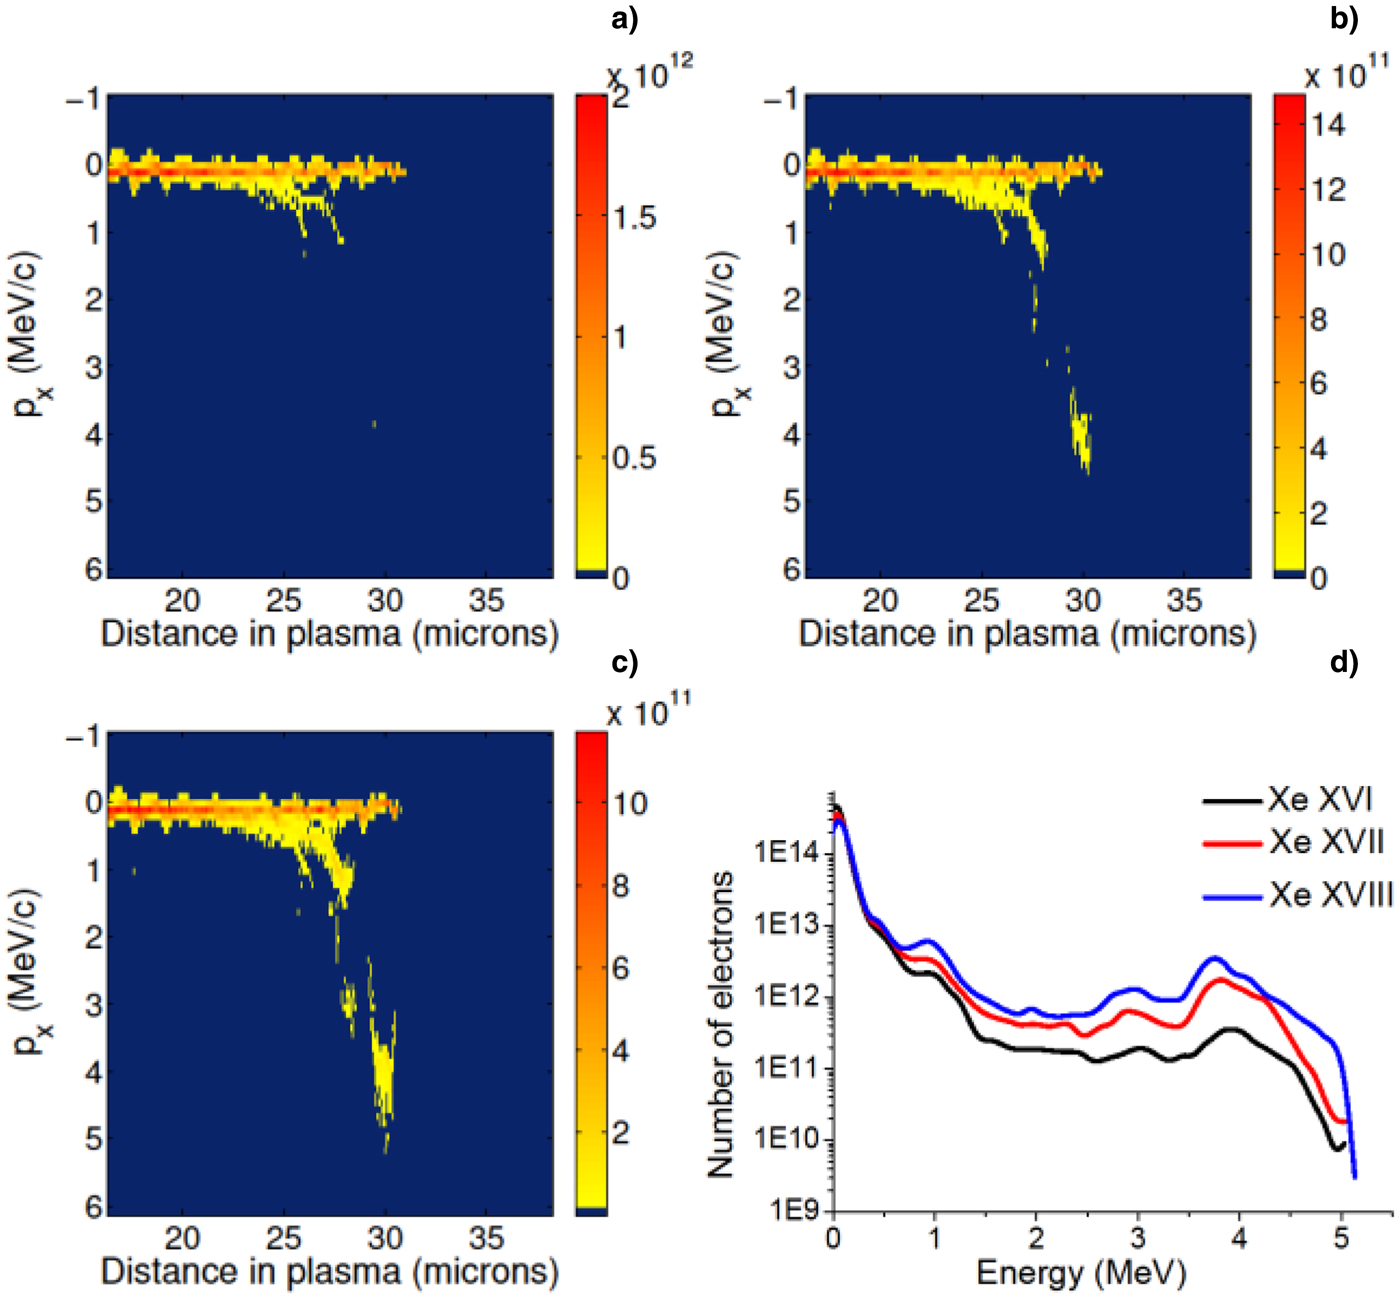
We varied only the neutral density of each type of gas, to investigate its behavior under a fixed laser pulse. The highest neutral density used was 2 × 1019 cm−3. All gas species, apart from N, produced prominent mono-energetic features on the electron spectrum only at this density, with the exception of Ar which exhibits injection at a broader range of densities, highlighting the sensitiveness on the gas choice for a given laser system. In all cases, it is the highest ionized electron states of each gas, that is, O VI, Ne VIII, Ar IX, Ar X, and Xe XVI, Xe XVII, Xe XVIII that were injected at the proper phase/time inside the wake. As different electron states of the same gas have different ionization energies, it is evident that the phase of injection will be different, thus the acceleration process will be different as shown in Figure 1, where the charge numbers and energy profiles are different for the three Xe electron species, despite gaining approximately the same maximum energy of 5 MeV.
Phase space (a–c) and spectra (d) of injected Xe electron species, 30 µm inside the plasma. The initial neutral Xe density is 2 × 1019 cm−3 and the color bar in (a–c) is number of electrons.
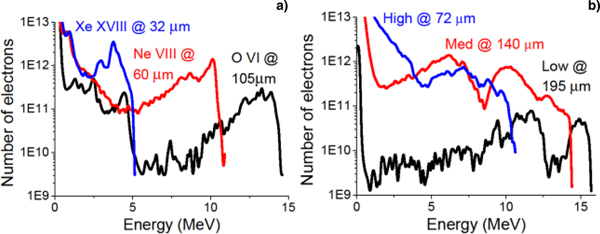
For a fixed initial neutral density the total electron density will vary for different gases, due to the overall available ionization states. For O with an initial neutral density of 2 × 1019 cm−3, up to the VI state is ionized providing a total electron density up to 1.2 × 1020 cm−3 along the path of the laser peak intensity. The high electron densities have a non-linear effect on the propagation and self-evolution of the laser pulse. Figure 2 shows the electron spectra for the highest available ionized state for the gases used. In (Fig. 2a) the spectra for O VI, Ne VIII, and Xe XVIII for 2 × 1019 cm−3 initial neutral density are shown. Oxygen, which provides the lowest total electron density, exhibits the slowest evolution that is, self-focusing/compression of the laser pulse and best phase-space rotation of injected electrons is achieved at 105 µm inside the plasma, gaining the highest maximum energy (peak at 13 MeV) and having the lowest dark current compared to Ne and Xe. Moreover, due to the slow evolution, O VI was injected in the second wake period, since the first period contained fully the self-focused/compressed pulse. At 8 × 1018 cm−3 and 1 × 1019 cm−3 initial densities, these gases showed no injection, with the exception of the Xe XVIII which at 1 × 1019 cm−3 is partially injected and accelerated during the wake's collapse.
(a) spectra at 2 × 1019 cm−3 neutral density; (b) Ar IX spectra for varying neutral densities. All spectra are taken at the moment of best phase space rotation.
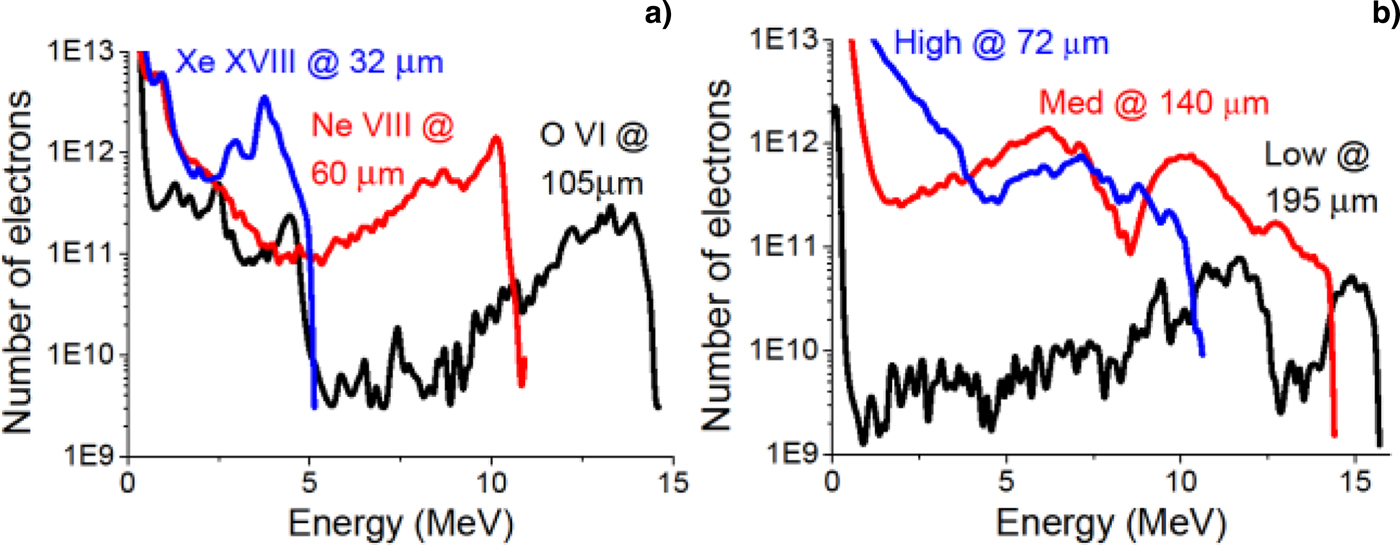
The Ar spectra are shown in Figure 2b for 8 × 1018 cm−3 (Low), 1 × 1019 cm−3 (Medium), and 2 × 1019 cm−3 (High) neutral densities. Lower densities did not produce any visible injection. At 8 × 1018 cm−3, the Ar IX electrons are injected, as the achieved maximum pulse intensity is lower due to the lower total electron density. Ar X is ionized and injected as well reaching a similar maximum energy, but its number density is 20 × lower than that of Ar IX and essentially does not contribute to the final accelerated electron beam. For the other two densities, Ar X is injected as well, albeit at lower electron numbers. Again, the slowest evolution (phase space compression at ~200 µm inside the plasma), higher maximum energy (peak at 15 MeV), and lowest dark current are observed for the lowest density. Injection at multiple buckets is evident as can be seen by the multiple peaks in the spectrum. It should be noted that N was also simulated at these conditions. N VI electrons were injected for 2 × 1019 cm−3 neutral density only, accelerated up to 16 MeV (lower total electron density, longer acceleration length, higher maximum energy) but they could hardly compose an electron beam.
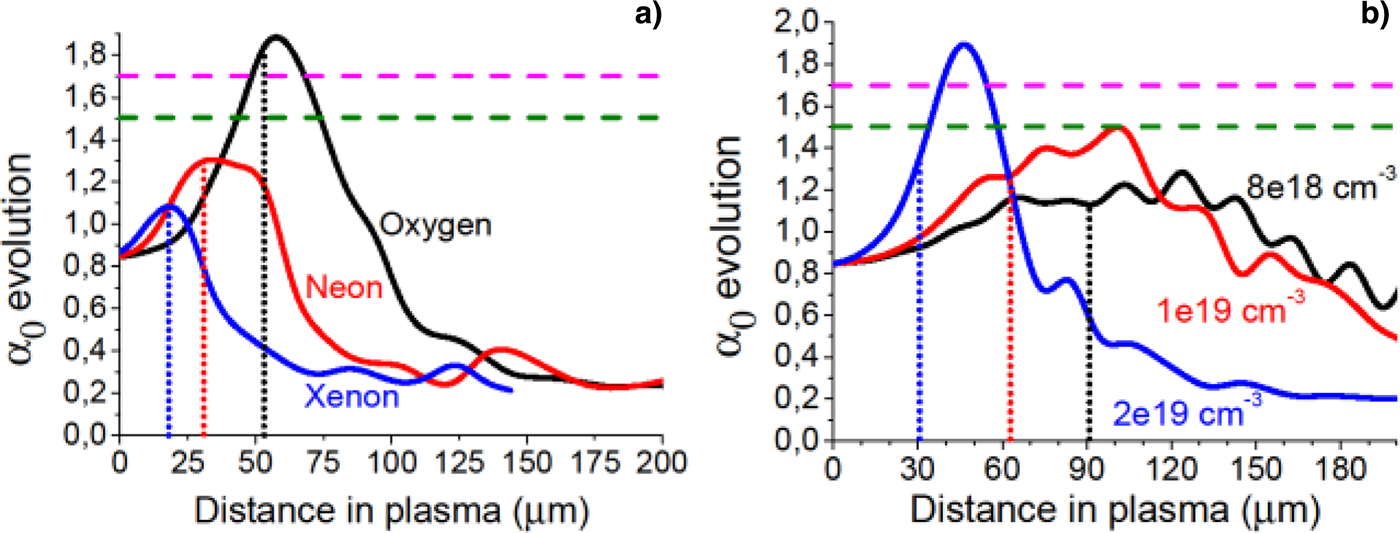
The appearance of mono-energetic electron beams with such low-power laser pulses is interesting and could be attributed to two factors. The high total electrons densities which allow for intense self-focusing/self-compression of the pulse, increasing its normalized vector potential a0, and the multiple high ionization states of the gas which provide the proper phase injected electron population. Hence, the initial laser power requirements are significantly lowered. In Chen et al. (Reference Chen, Esarey, Schroeder, Geddes and Leemans2012), a 1D theoretical analysis determined the minimum requirements for the laser pulse's a0. Specifically, a0~1.7 and a0~1.5 were given for resonant Gaussian (k pLpulse = 1, kp = 2π/λp, where λp is the plasma wavelength and L pulse is the spatial length of the laser pulse) and skewed laser pulses respectively. In our 2D investigations we find that this analysis collapses for few-cycle laser pulses (<10 fs) interacting with plasma with very high electron densities (>1020 cm−3), due to the added factors of intense self-focusing/compression, which cannot be determined in a 1D model. Due to the high densities the laser pulse is rapidly evolving, losing energy to ionization and wake generation (blue/red shift in the laser pulse spectrum) and the electromagnetic field of the pulse is essentially reduced to one or two cycles.
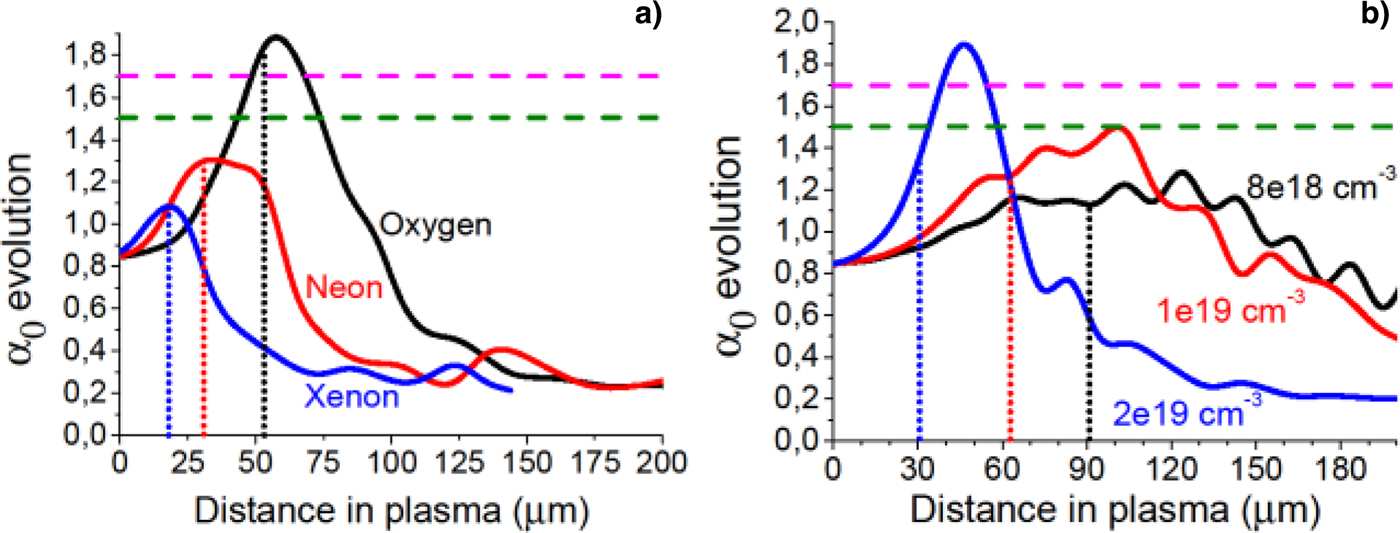
In Figure 3, the a0 evolution of the laser pulse is presented. We implemented an envelope approximation for determining a0, corrected for the modification of the pulse's wavelength due to its propagation in the high-density plasma. The lower a0 limits determined in Chen et al. (Reference Chen, Esarey, Schroeder, Geddes and Leemans2012) are not observed, with the exception of O (Fig. 3a). Electron injection from high ionization states takes place sooner than the maximum achieved a0, and as anticipated, the injection is initialized sooner for higher total electron densities as seen in both Figure 3a and 3b for all gases.
Evolution of a0. The magenta and green horizontal dashed lines are the a0 limits described in Chen et al. (Reference Chen, Esarey, Schroeder, Geddes and Leemans2012) for resonant Gaussian and skewed pulses. The vertical dotted lines show the moment of injection in each simulation.
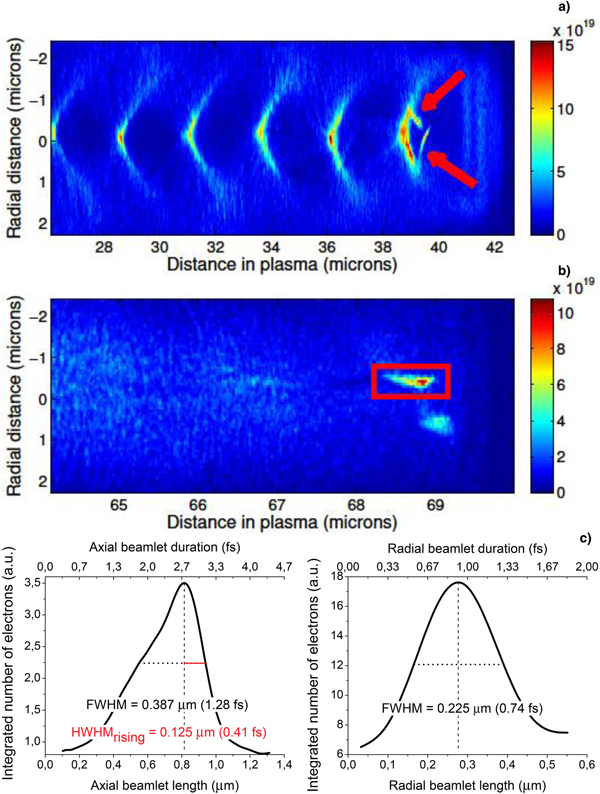
Since higher electron densities correspond to smaller wake periods, it is evident that the beamlets injected will be a fraction of the dimensions of the wake. Specifically, for a plasma density of 1.6 × 1020 cm−3 the wake period is ~3 µm, with the equivalent beamlet being a fraction of this length. In our investigations, all injected beamlets had sub-μm and occasionally sub-0.33 µm (corresponding to sub-femtosecond) dimensions. Figure 4 shows such beamlets for Ne VIII electrons for an initial neutral gas density of 2 × 1019 cm−3.
Sub-μm electron beamlet generation. In (b) the red box is dimensionally analyzed in (c).
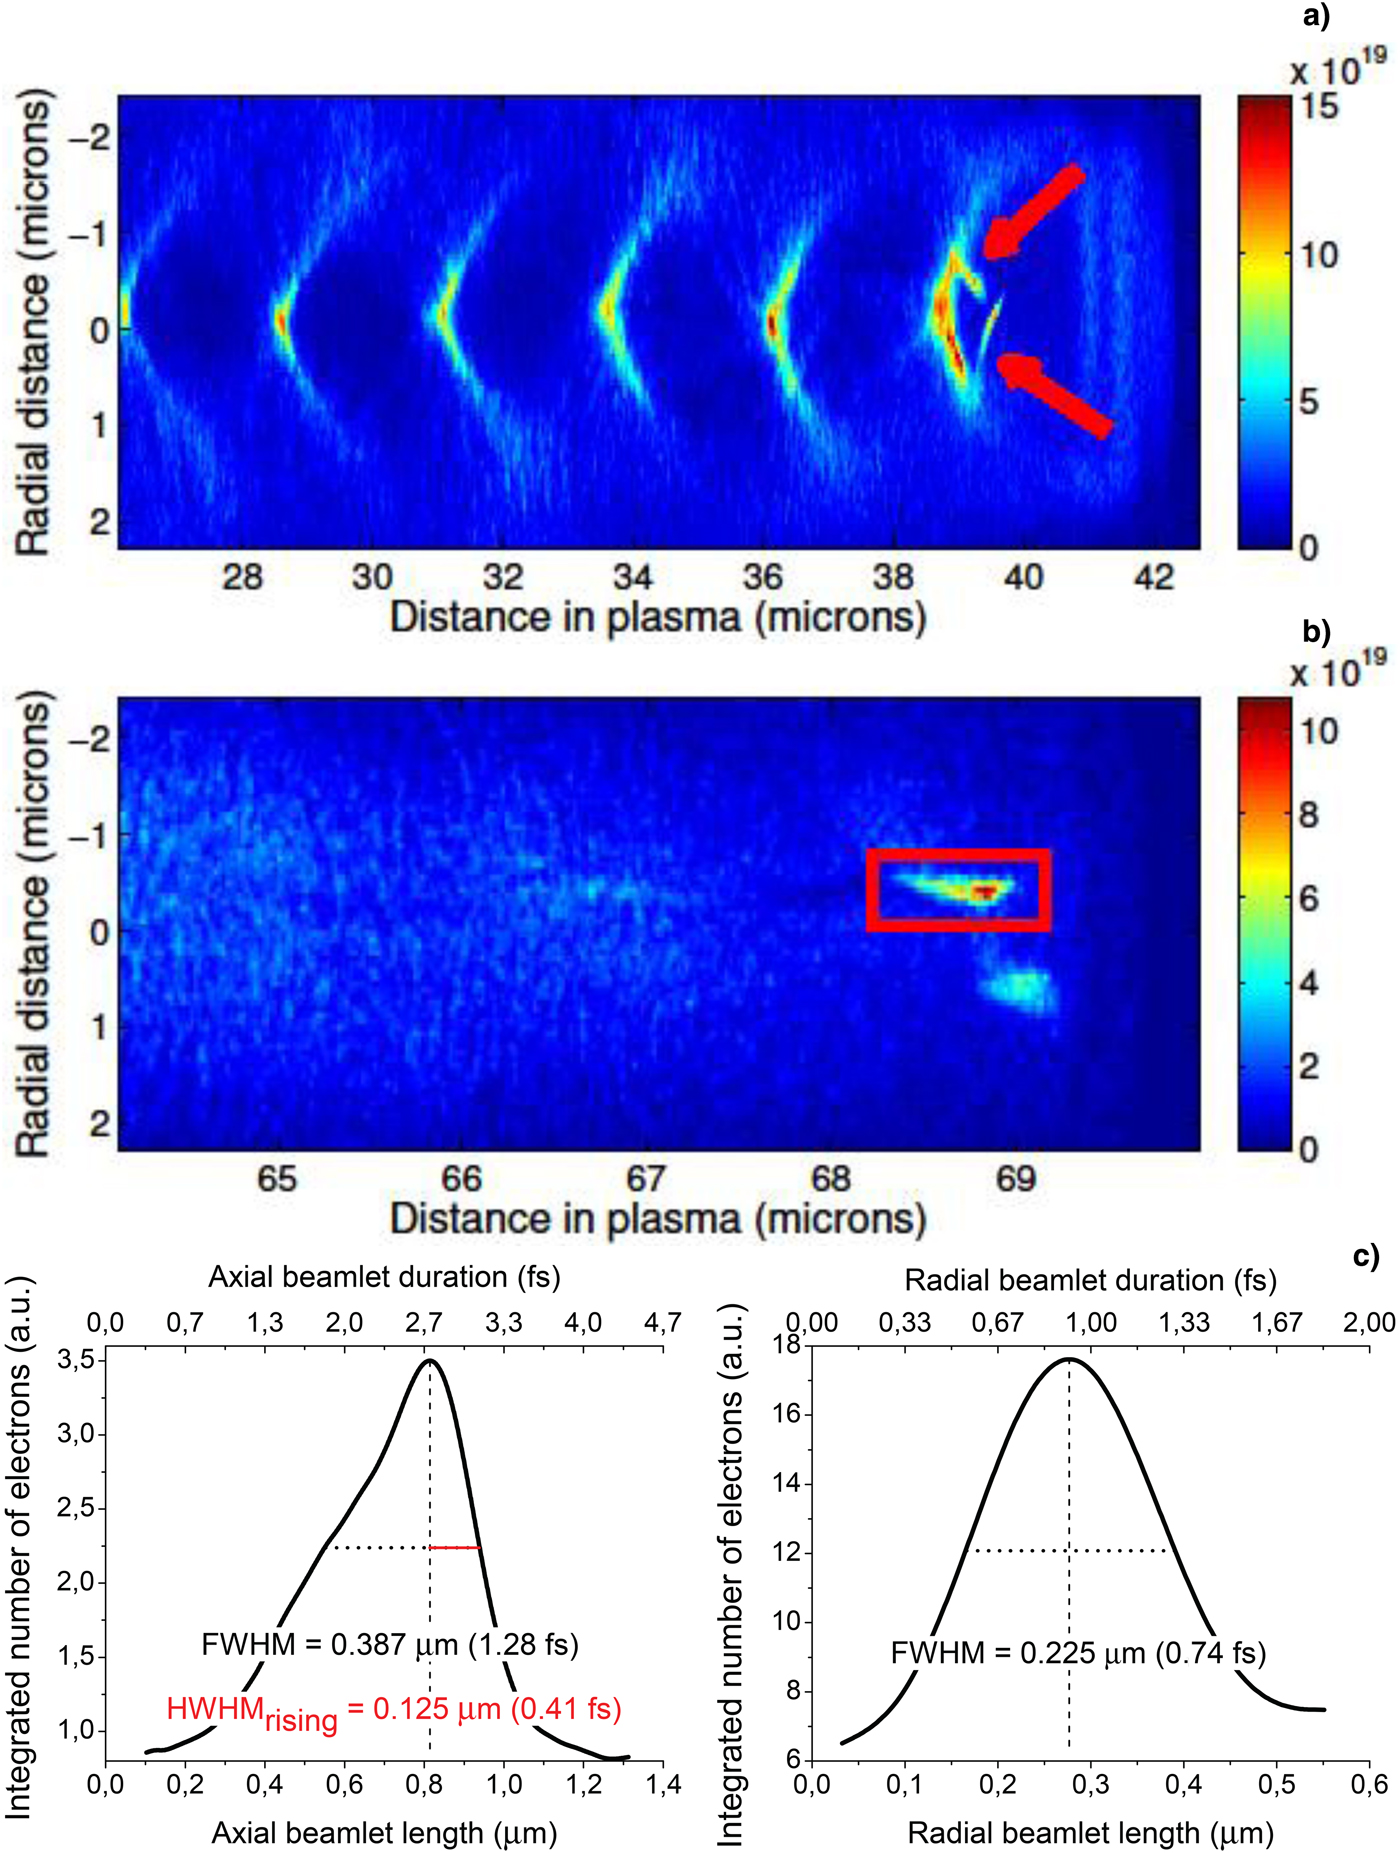
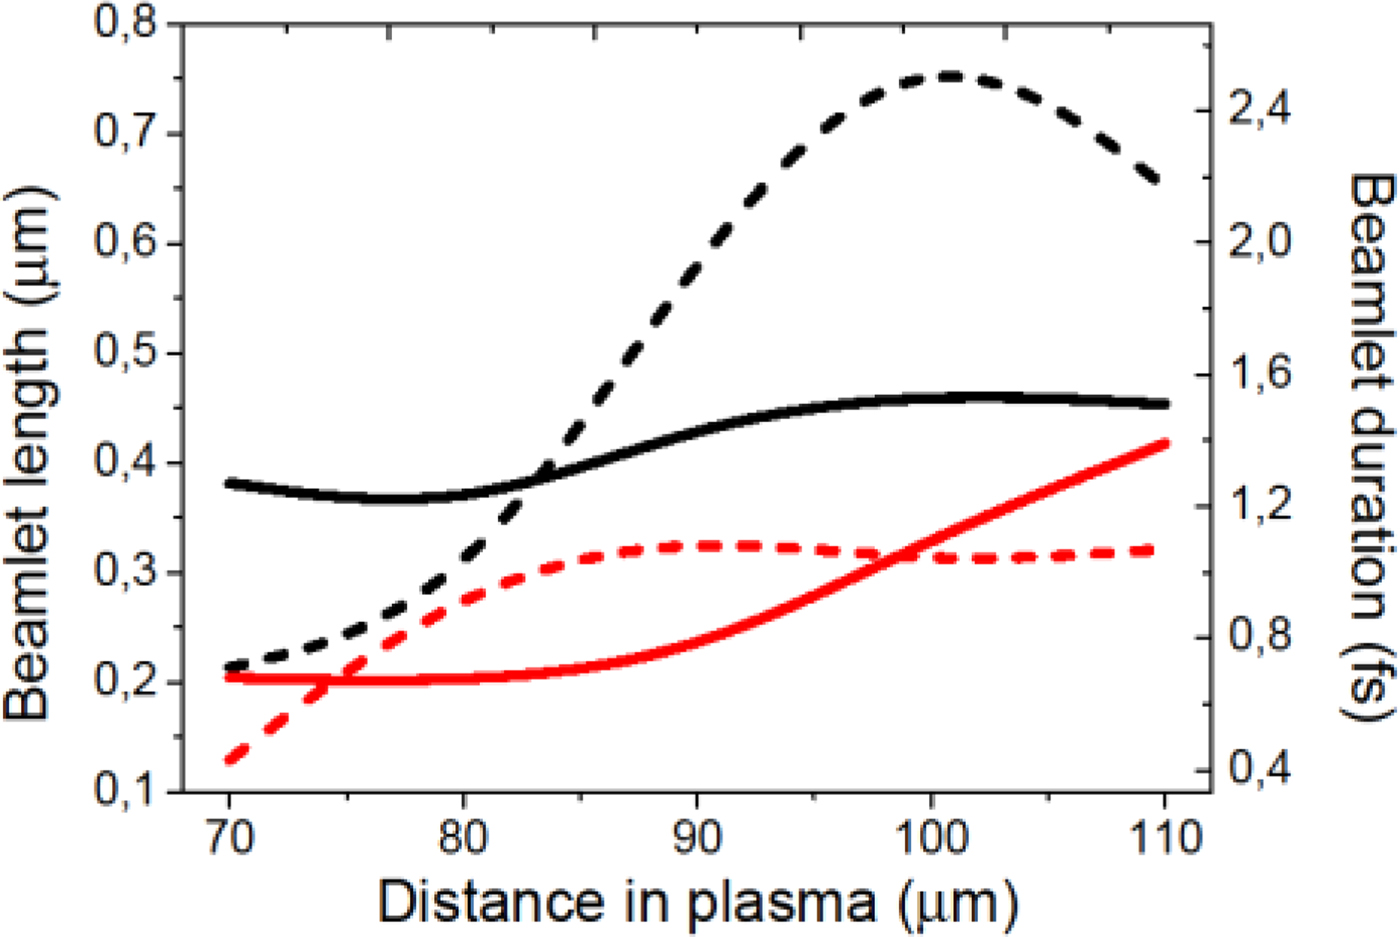
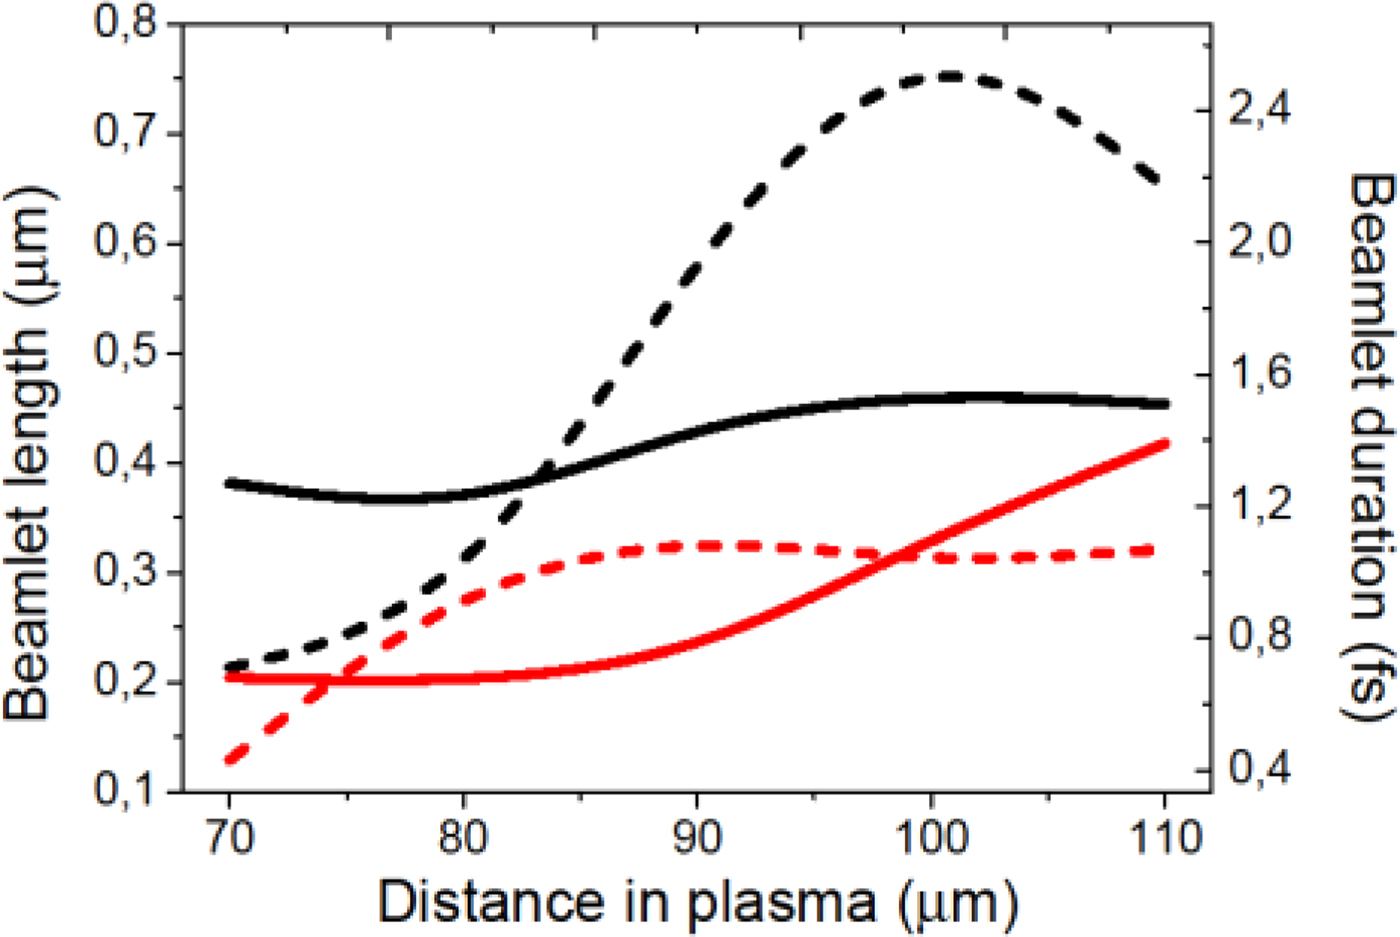
In Figure 4a the 2D electron density map of Ne VIII is shown. At 40 µm inside the plasma, a weakly non-linear wakefield is well formed. In fact all liberated electrons from all ionized states of Ne follow the general fluid motion creating the multi-dimensional wake structure. With increasing ionization energy, though, the electrons are liberated closer to the axis along which the laser propagates and the intensity is highest. In the first wake period two separate, asymmetric beamlets (red arrows) are counter-injecting in the wake. The asymmetry in the beamlets is due to the dynamic evolution of the laser pulse to “single cycle” lengths, introducing asymmetry in the ponderomotive force that drives the electrons. Figure 4b shows the two beamlets when the wake has collapsed and are “freely” propagating inside the plasma. The beamlet in the red box is analyzed in Figure 4c, where the integrated and smoothed-out axial and radial lineouts are presented. In the axial dimension the FWHM is 0.387 µm with a very steep rising edge of 0.125 µm (0.41 fs), while its radial dimension is well below 1 fs. The charge included in this beamlet is ~2.7 nC, although this number could be an overestimate due to 2D EPOCH operational algorithms. The beamlet retains its dimensions for several tens of μm as the remaining electromagnetic laser energy induces dispersion in both dimensions in the beamlets. As the simulation's spatial resolution limits the resolution of the beamlet lineouts, we performed a simulation with double the resolution in both dimensions (2037 × 802 cells with five particles per cell) to get a finer analysis of the beamlets. We chose Xe at 8 × 1018 cm−3 neutral density and the laser pulse energy was slightly increased to 7 mJ (0.7 TW). The choice of Xe was based on the coupling of the 0.5 TW laser pulse described earlier with particular gas, as it allows for very fast evolution of the laser pulse and hence limits the injection time of high ionization state electrons. In this simulation, the same injection pattern as in Figure 4, that is, two counter-injecting beamlets, is observed. The beamlets reach an energy of 12 MeV, 60 µm inside the plasma. Xe XVII is injected at comparable numbers with Xe XVIII and since both electron species have very close ionization energies (404 eV and 434 eV, respectively), they are injected at approximately the same phase/time inside the wake wave, with their spatial dimensions and coordinates nearly overlapping. Hence, the beamlets observed are formed from these two electron species. Ionization and/or injection below Xe XVII and above Xe XVIII was minimal and did not contribute to the beamlets charge/dimensions. In Figure 5 the dimensional evolution of the two beamlets is shown. At 60 µm inside the plasma the beamlets are overlapping, while at 110 µm they have a radial distance of ~7.5 µm. We observe that beamlet 2 (B2 – red curves in Fig. 5 maintains a ~0.6 fs axial duration for ~20 µm while its radial duration is initiated at ~0.4 fs and within 40 µm of propagation is nearly tripled. Beamlet 1 (B1 – black curves in Fig. 5) has longer axial and radial dimensions. Propagation in regions where laser electromagnetic fields are still present as well as space-charge effects inside the beamlets, induce fast dimensional expansion in both beamlets.
Axial (solid) and radial (dashed) FWHM dimensional evolution of the two beamlets (B1 – black and B2 – red curves) in Xe with a 10 fs, 7 mJ laser pulse.
Discussion
In summary, we investigated a scheme for ionization-induced electron injection with the use of a single gas species and sub-TW few-cycle laser pulses. The lower ionization electron states provide the necessary wake fluid population, while the higher ionization electron states being released deeper in the laser pulse intensity contours and hence deeper in the wake's Hamiltonian can be properly dephased from the fluid motion and get injected into the wake wave for acceleration to high energies. We presented via 2D-PIC simulations that by using this injection scheme, overall high electron densities can be generated from average neutral density targets by using high-Z gases and consequently, electron beamlets up to 15 MeV can be generated using few-cycle, sub-TW laser systems, rendering LWFA accessible to a wider range of laser laboratories. The few-cycle laser pulse is closely matched to the achieved plasma wake dimensions and through intense self-focusing/compression the pulse's a0 is increased and causes injection of high ionization states. Our 2D investigations show that the minimum requirements determined in Chen et al. (Reference Chen, Esarey, Schroeder, Geddes and Leemans2012) do not apply for few-cycle laser evolution in high-density plasma. Finally, the injected beamlet dimensions are measured in the simulation to be well-below the μm scale and in all cases are reaching and/or going below the ~1 fs duration limit. It is important to note that the presented study sets a clear path for the generation of attosecond electron beams from LWFA with sub-TW laser systems, by appropriately selecting the high-Z gas target, and its respective ionization state suitable for ionization induced injection, based on the attained laser conditions.
Author ORCIDs
D. Papp, https://orcid.org/0000-0002-7954-3686.
Acknowledgments
The authors acknowledge support from the European Regional Development Fund (GINOP-2.3.6-15-2015-00001). N. H. acknowledges the support from the National Natural Science Foundation of China (Grant No. 11675107) and the 973 project (2013CBA01500).