I. INTRODUCTION
The phenomenon of hydrogen affecting the mechanical property of metals, known as hydrogen embrittlement, is one of the fracture mechanisms that should be clarified for the safe use of structural materials. Many studies have been performed to clarify the fundamental effect of hydrogen on material strength to prevent hydrogen embrittlement.Reference Frohmberg, Barnett and Troiano1–Reference Han, He, Fukuyama and Yokogawa13 One of the typical effect of dissolved hydrogen appears on the plastic deformation behavior, which can be observed in the stress–strain relation and/or the fracture surface.Reference Han, He, Fukuyama and Yokogawa13 Therefore, the dislocation motion in the presence of hydrogen is considered to play a fundamental role on hydrogen-related fractures for metals.Reference Birnbaum and Sofronis5, Reference Sofronis and Birnbaum6, Reference Lynch9–Reference Murakami, Kanezaki, Mine and Matsuoka11 For example, different effects of hydrogen on plastic deformation (macroscopic softening/hardening) have been reported in iron.Reference Nagumo14 These results show that the fundamental effect of hydrogen on plastic deformation is still unclear. Recently, much attention has been paid to the increment of the dislocation mobility (softening) as an elementary process for hydrogen embrittlement; this increment is known as the hydrogen-enhanced localized plasticity (HELP) mechanism.Reference Birnbaum and Sofronis5, Reference Sofronis and Birnbaum6 The HELP mechanism is considered to be responsible for the reduction of the energy barrier for dislocation motionReference Birnbaum and Sofronis5 or the hydrogen shielding effect due to the reduction of the interaction between dislocations.Reference Sofronis and Birnbaum6 Sofronis et al. have reported that the hydrogen atmosphere shields the effective shear stress between dislocations under extremely high hydrogen concentrations.Reference Sofronis and Birnbaum6 On the other hand, we reported that the energy barrier for {112}<111> edge dislocation motion decreases in the presence of hydrogen in alpha iron using atomistic simulation.Reference Taketomi, Matsumoto and Miyazaki15 Our result indicates that hydrogen enhances the dislocation mobility due to the reduction of the energy barrier even in a low hydrogen concentration. However, our study estimated only the energy barrier for dislocation motion with a trapped hydrogen atom at the dislocation core; thus, the hydrogen diffusion accompanying the dislocation motion was not taken into consideration. The continuum interaction between the dislocation and the hydrogen atom is thought to occur when the frequency of the dislocation motion in the presence of hydrogen atom and the hydrogen diffusion process near the core are of similar magnitude (competitive relation). Moreover, hydrogen transportation by dislocationReference Cottrell16 has been paid attention to as one of the hydrogen transportation mechanisms in metal. However, it is still difficult to observe the competition between the dislocation and hydrogen using experimental techniques as direct observation of the hydrogen atom is difficult. Hence, the estimation of the occurrence conditions of the competitive dynamic motion between the dislocation and hydrogen using computer simulation should be pivotal.
The interaction between a dislocation and a hydrogen atom is considered as one of the typical examples of the interaction between a dislocation and a solute atom. Investigation of the interaction between a dislocation and a solute atom has been conducted to clarify the solute effect on the dislocation motion (dislocation pinning/unpinning at the solute atom).Reference Cottrell and Bilby17, Reference Tapasa, Osetsky and Bacon18 Particularly, dynamic strain aging (DSA) is paid much attention to as it attributes the competitive relationship between dislocation motion and solute diffusion. Pertaining to DSA, calculations based on continuum mechanicsReference Hu, Li, Zheng and Chen19–Reference Rickman, LeSar and Srolovitz22 and atomistic modelsReference Curtin, Olmsted and Hector23, Reference Olmsted, Hector and Curtin24 have been adopted to calculate the dynamic effects of a solute atom on dislocation motion. To the extent of our knowledge, only one Monte Carlo simulation based on the continuum theory has been performed to estimate the interaction of a dislocation and hydrogen atom;Reference Wang, Srolovitz, Rickman and LeSar25 however, this study could not take the dislocation core effect into consideration. Our previous study shows that hydrogen occupation within the dislocation core is the most stable.Reference Taketomi, Matsumoto and Miyazaki26 To consider the hydrogen atom trapped at the dislocation core, analysis based on an atomistic model is necessary. The classical molecular dynamics (MD) method is one of the powerful tools to calculate the atomic scale phenomena; however, the results could not be directly compared with the experimentally observed behavior due to the differences in timescale. Recently, the timescale gap has been tried to overcome by estimating activation energy by atomic scale simulations.Reference Olmsted, Hector and Curtin24, Reference Zhu, Li, Samanta, Leach and Gall27–Reference Warner and Curtin29 These studies tried to connect the atomistic simulations of stress-driven processes to experimentally observed behavior via the estimation of stress-dependent activation energy barriers. These methods successfully predict the realistic timescale phenomenon compared with classical MD methods. Thus, we adopt these methods for the analysis of interaction between a dislocation and hydrogen atom.
Since the edge dislocation has the larger hydrostatic strain field compared with the screw dislocation, the edge dislocation has the strong interaction with hydrogen atoms. In this study, therefore, the {112}<111> edge dislocation in alpha iron is examined. First, the hydrogen concentration around the dislocation core under a thermal equilibrium condition of hydrogen atmosphere is estimated based on the equilibrium theory and experimental results. Next, the correlation between the activation energy for the edge dislocation motion and the applied shear stress is investigated using the nudged elastic band (NEB) methodReference Henkelman and Jónsson30, Reference Jónsson, Mills, Jacobsen, Berne, Ciccotti and Coker31 to estimate the dislocation velocity in hydrogen-free alpha iron. Finally, the activation energy for the edge dislocation motion and hydrogen diffusion is calculated using the NEB method to estimate the occurrence conditions of the competitive relationship between the dislocation and hydrogen atom. Furthermore, the occurrence conditions of softening and/or hardening in the presence of hydrogen are also discussed.
II. ANALYSIS METHODS
A. Analysis model
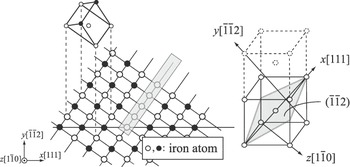
The introduced {112}<111> edge dislocation and the crystal orientation of the analysis model are shown in Fig. 1. The slip occurs on the xz-plane, and the slip direction [111] is set along the x-axis. To introduce an edge dislocation, an atomic plane with gray-colored atoms as shown in Fig. 1 was removed and then the relaxation of atomic structure was performed by the conjugate gradient (CG) method; this procedure is one of the molecular statics simulations; thus, the analysis temperature is 0 K. During the structural relaxation process, the movement of atoms along the y-axis was fixed and then compression was applied along the x-axis to fill the removed plane. After that, the unit cell size and the atomic positions were relaxed until the x-axis stress (σxx) decreased sufficiently (≤0.005 MPa). The analysis system contains about 8000 iron atoms; the dimensions of the unit cell are 11.5, 4.9, and 2.0 nm along the x-, y-, and z-axes, respectively. Periodic boundary conditions were applied along the x- and z-axes. Three atomic planes at the top and bottom of the unit cell perpendicular to the y-axis were considered as boundary planes and fixed. In this study, embedded atom method (EAM) potential developed by Wen et al.Reference Wen, Xu, Fukuyama and Yokogawa32 was adopted to describe the atomic interaction for the Fe–H system.
Simulation model and crystal orientation of an {112}<111> edge dislocation; an atomic plane with gray-colored atoms was removed and then the relaxation of atomic structure was performed to introduce an edge dislocation.

B. Hydrogen concentration around the dislocation core under hydrogen gaseous condition
Many studies have been conducted on the hydrogen effect on alpha iron using an atomistic model, e.g., crack propagationReference Wen, Xu, Fukuyama and Yokogawa32 or dislocation motion.Reference Wen, Fukuyama and Yokogawa33, Reference Nedelcu and Kizler34 However, the hydrogen concentrations and/or distribution in these studies were based on assumptions. We, therefore, used more realistic hydrogen concentration and distribution around the {112}<111> edge dislocation under a hydrogen gaseous condition using the hydrogen-trap energy distribution around the dislocation.Reference Taketomi, Matsumoto and Miyazaki26
According to Sievert’s law, the equilibrium concentration of hydrogen is proportional to p 1/2 and exp(−ΔH/k BT), where p is the hydrogen gas pressure, ΔH is the heat of the solution, k B is the Boltzman’s constant, and T is the temperature. HirthReference Hirth35 has reported the hydrogen concentration (atom fraction of hydrogen) for alpha iron under the gaseous hydrogen condition based on Sievert’s law. The hydrogen atom stably exists at the tetrahedral site (T-site) within the nondeformed bcc-structured alpha iron.Reference Matsumoto, Inoue, Taketomi and Miyazaki36 Therefore, the hydrogen occupancy at the T-site under thermal equilibrium conditions is given by Eq. (1) as a function of hydrogen gas pressure p (Pa) and temperature T (K).

Using the hydrogen occupancy at T-site, θ T-site, the hydrogen occupancy at a specific trap site θi with hydrogen-trap energy E Trapi under thermal equilibrium condition is given by the following equation:Reference Oriani37

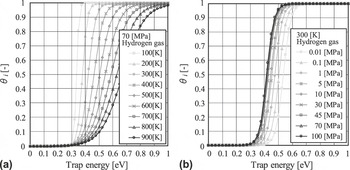
where the hydrogen-trap energy corresponds to the energy difference between the system with a hydrogen atom trapped at the specific trap site and the system with a hydrogen atom at a T-site within the nondeformed perfect lattice; this definition is the same as that in our previous study.Reference Taketomi, Matsumoto and Miyazaki26 The correlation between hydrogen occupancy and hydrogen-trap energy for specific temperatures and gas pressures are shown in Fig. 2. In this figure, the value of hydrogen gas pressure is the maximum value of the expected vessel pressure (hydrogen gas tank for vehicles), i.e., 70 MPa as shown in Fig. 2(a), and the temperature is 300 K as shown in Fig. 2(b). The maximum hydrogen-trap energy around the {112}<111> edge dislocation is 0.49 eV at the trap site within the dislocation core.Reference Taketomi, Matsumoto and Miyazaki26 Thus, a hydrogen atom is expected to be trapped at this strongest trap site with high probability at temperatures below 300 K. The hydrogen occupancy is more sensitive to the hydrogen gas temperature compared with the hydrogen gas pressure as shown in Fig. 2.
Correlation between the hydrogen occupancy and hydrogen-trap energy; (a) effect of temperature with hydrogen gas pressure of 70 MPa and (b) effect of hydrogen gas pressure with temperature of 300 K.

Considering the structure of the edge dislocation, hydrogen-trap sites periodically exist along the dislocation line. The number of hydrogen atoms existing along a unit length of the dislocation line under a thermal equilibrium condition, neglecting hydrogen–hydrogen interaction, is approximately written as

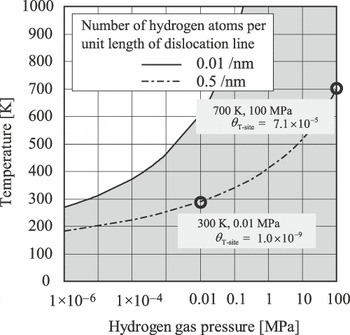
where ni is the number density of hydrogen trap sites per unit length with hydrogen-trap energy of E Trapi. The total sum is taken for all the trap energies existing around the dislocation. To estimate the number of hydrogen atoms trapped around the dislocation under a thermal equilibrium condition, we take the hydrogen trap sites with the strongest trap energy (E Trapi = 0.49 eV) into consideration for convenience. The probability of hydrogen existence is typically high at this trap site compared with other sites as shown in our previous study,Reference Taketomi, Matsumoto and Miyazaki15 and hence, this approximation is appropriate. Here, we introduced one hydrogen atom into the analysis model shown in Fig. 1, and thus the number of hydrogen atoms per unit length of dislocation line is 0.5 /nm, where cell size along z-direction is ∼2 nm. The unit length of iron lattice along the dislocation line is ∼0.4 nm in this analysis model, i.e., the strongest hydrogen trap sites periodically exists every 0.4 nm, and the number of the site is five in this analysis model. Therefore, the hydrogen occupancy should be 0.2 to realize the hydrogen concentration of 0.5/nm. Using Eqs. (1) and (2), this hydrogen concentration (C H = 0.5/nm) under thermal equilibrium conditions can be obtained for different gas temperature and pressure as shown in Fig. 3. The curve shows that the analysis model adopted in this study contains hydrogen atoms as, for example, 300 K and 0.01 MPa or 700 K and 100 MPa hydrogen gaseous conditions at thermal equilibrium. The figure also shows the different hydrogen concentrations (C H = 0.01/nm), which will be discussed in following section.
Hydrogen concentration around the {112}<111> edge dislocation at thermal equilibrium condition under hydrogen gaseous conditions.

III. ANALYTICAL RESULTS
A. Dislocation velocity in the absence of hydrogen
First, the energy barrier for the dislocation-motion dependence on the applied shear stress in the absence of hydrogen is investigated using the NEB method; static calculation using CG method is adopted in this study. The NEB method enabled us to estimate the minimum energy path and the energy barrier for the reaction based on the given initial and final configurations. The corresponding displacements of the shear stress τxy are applied to the boundary atoms of the analysis model, then the positions of the other atoms are relaxed. The initial and final conditions of the NEB analyses are made with 1b difference in the positions of the dislocation. The {112}<111> edge dislocations have an anisotropic crystal structure with respect to the yz-plane; thus, there are two different (twinning and antitwinning) possible slip directions. In this study, the applied stress that derives dislocation moves along the antitwinning direction is arranged in the positive direction. Therefore, by increasing the applied stress, the dislocation tends to move along the antitwinning direction (right direction in Fig. 1).
Here, the potential energy of the system is revised as Eq. (4) to take the effect of the applied stress into consideration.

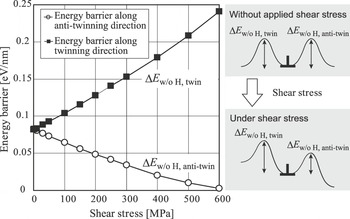
where F is the force applied on the boundary atoms, Δx is the displacement of the boundary atoms from the initial equilibrium positions, Φ F is the potential energy of the system that takes the work done by deformation into consideration, and Φ is the potential energy of the atomic system. The correlation between the shear stress and the energy barrier for the dislocation motion per unit length of dislocation line along the antitwinning and twinning directions are shown in Fig. 4. Here, the energy barriers for the dislocation motion along each direction are written as ΔE w/o H, anti-twin and ΔE w/o H, twin. On increasing the applied stress, the differences between the energy barriers also increase.
Shear–stress dependence of the energy barrier for dislocation motion along antitwinning direction and twinning directions.

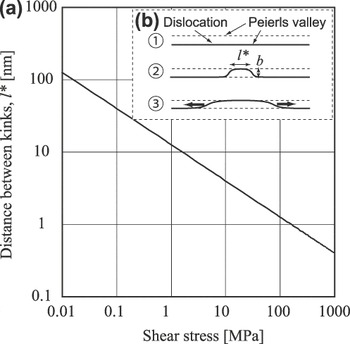
In general, the edge dislocation motion is considered to occur with the kink-pair generation and migration under moderate stress as shown in Fig. 5(b). In this study, the direct evaluation of kink-pair generation and migration is not performed due to the limitation of the physical scale of the analysis model; i.e., when the applied stress is small, very large analysis models are required to form the kinks. Hence, the following approximated method is adopted. As the migration energy of kinks is usually small compared with that of the kink-pair generation, the dislocation motion is considered to be dominated by the kink-pair generation. Here, we assume the migration of the kinks is negligible, and the kink-pair generation is considered to be expressed as V p × l*, where V p is the Peierls potential for edge dislocation motion and l* is the distance between kinks at the saddle point of the dislocation motion, which are required to surmount the energy barrier for dislocation motion as shown in Fig. 5(b). In addition, we assume that the edge dislocation moves 1b in every step. In this study, Peierls potential dependence on applied stress is investigated using atomistic model and the distance between kinks, l* is given based on elastic dislocation theory as follows.Reference Hirth and Lothe38 The energy of the double-kinked segment in the dislocation is given by Eq. (5)

Correlation between the applied shear stress and the distance between the kinks to overtake the Peierls potential.

where x is the separation distance between kinks, b is the magnitude of burger’s vector, μ is the shear modulus (68.6 GPa in this crystal orientationReference Taketomi, Matsumoto and Miyazaki26), and τ is the applied shear stress. The first term corresponds to the energy of the kinks, second term is the elastic energy between kinks, and third term is the work done by applied stress. The separation distance between kinks at the saddle point of the dislocation motion derived from the differential of Eq. (5) becomes zero as shown in the following equation:

Thus,

The correlation between the applied shear stress and the distance between kinks is shown in Fig. 5(a). On increasing the shear stress, the distance between kinks to overtake the Peierls hill decreases. Here, upon increasing the applied stress, it is clear that the frequency of motion toward the twinning (negative) direction becomes very small compared to the antitwinning (positive) direction. Therefore, the dislocation motion toward the twinning direction is negligible. Furthermore, we assume that the energy of the kinks is negligibly small, and it leads to the conclusion that the edge dislocation velocity v D can be given as

where Q(ΔE) is the frequency to surmount the energy barrier of ΔE. The dislocation motion is considered as a thermal activation process; thus, the frequency of motion is given as Eq. (9).

where ν d is the attempt frequency of the dislocation motion, ΔE is the energy barrier, and k B is the Boltzman’s constant. Here, the vibration frequency of the dislocation is given by the following equation:

where ν D is the Debye frequency and it is given as follows:

where N is the number of iron atoms, V is the volume; thus, N/V corresponds to the number density of the iron crystal. s l and s t are the longitudinal and transverse wave velocity and are obtained as 5950 and 3240 m/s in iron,39 respectively. Substituting these values into Eq. (11), the Debye frequency of iron atoms as 0.62 × 10¹⁴ Hz can be obtained.
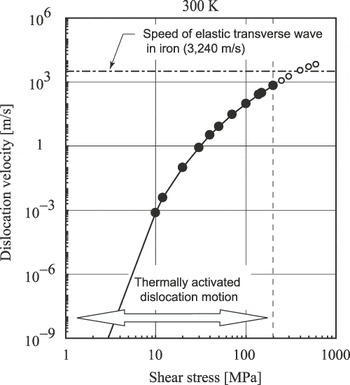
The relationship between the dislocation velocity and the applied shear stress at 300 K is shown in Fig. 6. The dislocation velocity obtained in this study becomes faster than that of the elastic transverse wave in iron (3240 m/s) at higher applied stress. According to the literature,Reference Yokobori40 a thermal activation process is considered to be dominant when the energy barrier of the thermal activation (ΔE w/o H, anti-twinl*) is above 2k BT, and this condition is achieved below a stress of about 200 MPa. Therefore, stress conditions below 200 MPa will be dealt with in this study.
Correlation between dislocation velocity and shear stress in the absence of hydrogen.

B. Dislocation velocity in the presence of hydrogen
1. Conditions of dislocation traps hydrogen at thermal equilibrium
The relationship of the relative positions between the dislocation and hydrogen can be characterized into three cases as shown in Fig. 7. Figure 7(a) is the condition in which no hydrogen atoms exist around the dislocation and the hydrogen atom can diffuse away. Figure 7(b) shows the condition in which the dislocation and the hydrogen atoms move in a state of competitive relationship. Figure 7(c) shows the condition in which only the dislocation moves away from the hydrogen atmosphere. To clarify the interactive condition between a dislocation and hydrogen, the occurrence conditions of Figs. 7(a)–7(c) are investigated.
Schematic of the relationship between a dislocation and a hydrogen atom; (a) dislocation does not trap the hydrogen atom and the hydrogen atom diffuses away from dislocation, (b) dislocation and hydrogen move at competitive velocities with interactions with each other, and (c) dislocation moves only ahead of hydrogen.

First, the occurrence condition of Fig. 7(a) is clarified. This condition corresponds to the condition when hydrogen concentration is sufficiently low around a steady state dislocation without motion at thermal equilibrium. Here, we assumed the condition when the number of hydrogen atoms trapped by the dislocation becomes 0.01/nm as a representing example that corresponds to the hydrogen diffuse away condition as shown in Fig. 7(a). Using Eqs. (1) and (2), the conditions of hydrogen concentration of 0.01/nm for different temperatures and hydrogen gas pressures are obtained and are shown in Fig. 3. It shows that hydrogen atoms are assumed to diffuse away from the dislocation core under the condition as shown in the white region in Fig. 3.
2. Conditions of interaction between dislocation and hydrogen atom
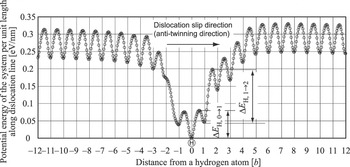
In this section, the occurrence conditions of interaction between a dislocation and hydrogen atom are clarified by estimating the occurrence conditions of Figs. 7(b) and 7(c). The analyses of the energy barrier for the dislocation motion in the presence of a hydrogen atom are performed using the NEB method. The energy barrier for the dislocation motion per unit length of the dislocation line in the presence of a hydrogen atom is shown in Fig. 8. Here, no shear stress is applied on the system. When the dislocation is positioned at 0b, a hydrogen atom is trapped at the trap site within the dislocation core with the strongest trap energy, where the potential energy of this condition is taken as zero. A typical effect of hydrogen on the energy barrier is observed while the {112}<111> edge dislocation is located at −3b to 5b from a hydrogen atom. This asymmetrical distribution of the potential energy is attributable to the crystallographic anisotropic structure of the {112}<111> edge dislocation in alpha iron; this anisotropic effect clearly exists in the presence of a hydrogen atom. Here, the energy barrier of dislocation motion per unit length from 0b to 1b is defined as ΔE H, 0→1. The other energy barriers are determined as shown in Fig. 8, where the condition of ΔE H, 0→1 < ΔE w/o H, anti-twin < ΔE H, 1→2 is satisfied at the stress-free conditions.
Potential energy barrier of {112}<111> edge dislocation motion around a hydrogen atom.

Considering the dislocation motion in the presence of hydrogen, hydrogen atom diffusion must be considered. Only the dislocation motion along the antitwinning direction (positive direction of horizontal axis in Fig. 8) is taken into consideration as done in Sec. III. A. Here, the competitive motion between the dislocation and hydrogen atom can be characterized as (i) the hydrogen atom diffuses at first, then the dislocation follows the hydrogen atom, (ii) the hydrogen atom and the dislocation move at the same time, and (iii) the dislocation moves first, then the hydrogen atom diffuses to the dislocation. Pertaining to case (i), the hydrogen atom is initially trapped at the most stable occupation site, and the hydrogen atom is supposed to be retrapped at the same trap site even though hydrogen diffusion has occurred. Hence, case (i) is considered as hard to occur. Concerning case (ii), the NEB calculation shows that the simultaneous motion of the dislocation and the hydrogen atom needs to surmount extremely high energy barrier compared to the individual motion; ∼0.53 and 0.08 eV/nm without applied stress, respectively, and hence, case (ii) is considered as hard to occur. Therefore, cases (i) and (ii) are considered negligible and only case (iii) is taken into consideration. The initial conditions of the analysis are written as follows: the dislocation initially surmounts the energy barrier of ΔE H, 0→1 and remains at 1b; in contrast, a hydrogen atom remains at 0b. The next event is whether the dislocation surmounts ΔE H, 1→2 or a hydrogen atom diffuses to chase the dislocation. The energy barrier of the minimum energy path (MEP) for hydrogen diffusion from the trap site located at approximately 1b behind the dislocation core is defined as ΔE H-diff, −1b.
Therefore, the dislocation leaves the hydrogen atom as shown in Fig. 7(c) and can be realized under the conditions of

where the dislocation has to surmount the high energy barrier (ΔE H, 1→2) compared with that in the absence of the hydrogen atom (ΔE w/o H, anti-twin) to leave the hydrogen atom at the initial position. Thus, the initial dislocation velocity becomes slow, after that the velocity is equal to the velocity in the absence of hydrogen as there is no interaction between the dislocation and hydrogen atom. Other than the above conditions, the dislocation and hydrogen atom move with interaction with each other. When

and

are satisfied, hydrogen diffusion dominates the dislocation velocity. In contrast, when

is satisfied, the hydrogen atom is supposed to have sufficient mobility to catch up to the dislocation soon after the dislocation motion, and the dislocation velocity is dominated by the frequency of Q(ΔE H, 0→1l*).
3. Hydrogen effect on dislocation velocity
Energy-barrier dependence on applied shear stress in the presence of hydrogen is investigated using the NEB method as explained in Sec. III. A. Here, we assume the l* derived from Eq. (7) does not change even in the presence of hydrogen, and one can obtain the frequency of motion for each energy barrier using Eqs. (9)–(11). Hydrogen diffusion can be treated as a thermal activation process similar to the dislocation motion. Thus, the frequency of diffusion can be written as

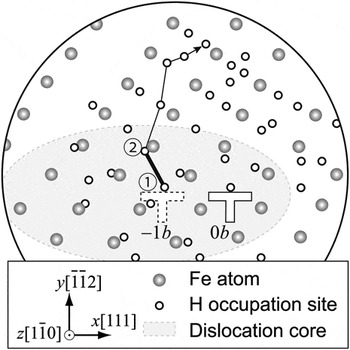
where ν is the attempt frequency of the hydrogen atom diffusion. Here, we adopt the frequency of hydrogen atoms as 1.11 × 10¹⁴ Hz; here we adopt the frequency of a pair hydrogen atoms obtained by the MD simulation using the same atomic potential as an approximated value. Pertaining to hydrogen diffusion, the MEP of hydrogen diffusion from −1b behind the edge dislocation core is investigated. The analysis result under stress-free conditions is shown in Fig. 9, where large gray spheres and small open circle correspond to iron atoms and hydrogen occupation sites, respectively. Hydrogen occupation sites are determined using Voronoi tessellation, and CG method is adopted for structural relaxation as in our previous study,Reference Taketomi, Matsumoto and Miyazaki26 therefore, all T- and O-sites around the dislocation core which can be detected by our procedure is taken into consideration. The iron atoms covered with a gray ellipse are non–bcc structured atoms detected by common neighbor analysis,Reference Honeycutt and Andersen41 and this region is believed to be the dislocation core. The initial position of the hydrogen atom is assumed to be located at ①. The energy barriers of all the possible diffusion paths are investigated. As a result, the hydrogen diffusion path (black line in Fig. 9) is detected as the MEP. In addition, the maximum energy barrier of the MEP (bold line ①–② in Fig. 9) is evaluated as 0.26 eV. According to our calculation, this energy barrier is almost independent of the applied shear stress. Therefore, we assume that the energy barrier of the hydrogen diffusion from the trap site located at −1b behind the dislocation is independent of the applied shear stress as 0.26 eV.
Distributions of iron atoms and hydrogen trap sites around the dislocation core, and minimum energy path of hydrogen diffusion from 1b behind the dislocation core.

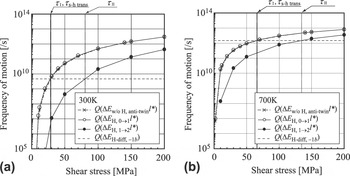
The dislocation motion frequency, Q(ΔE H, 0→1l*), Q(ΔE H, 1→2l*), Q(ΔE w/o H, antit-winl*), and the hydrogen diffusion frequency Q(ΔE H-diff, −1b) are compared as a function of shear stress as shown in Fig. 10. The result at 300 and 700 K are shown in Figs. 10(a) and 10(b), respectively. In this figure, τ I and τ II are the shear stresses that satisfy the conditions of Q(ΔE H, 0→1l*) = Q(ΔE H-diff, −1b) and Q(ΔE H, 1→2l*) = Q(ΔE H-diff, −1b), respectively, and τ s-h trans is the shear stress that satisfies the condition of Q(ΔE w/o H, anti-twinl*) = Q(ΔE H-diff, −1b). When the applied shear stress goes below τ I, it satisfies Eq. (15). Therefore, the dislocation motion is dominated by Q(ΔE H, 0→1l*), and the dislocation velocity is written as  . When the applied shear stress is larger than τ I and smaller than τ II, Eqs. (13) and (14) are satisfied. Therefore, the dislocation motion is dominated by the hydrogen diffusion frequency Q(ΔE H-diff, −1b) and the dislocation velocity is written as
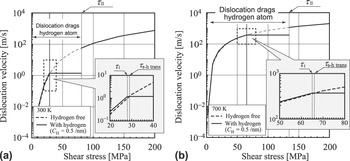
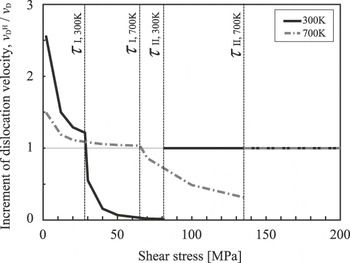
 . Within this condition, the dislocation velocity becomes faster than that in the absence of hydrogen when the applied shear stress is smaller than τ s-h trans; in contrast, the dislocation velocity becomes slower when the applied shear stress is larger than τ s-h trans. On the other hand, the dislocation escapes from hydrogen when the applied shear stress is larger than τ II. In this case, the dislocation velocity at the very initial state is slower than that in the absence of hydrogen due to the dislocation having to surmount the higher energy barrier (ΔE H, 1→2). However, after that the dislocation velocity becomes the same as that in the absence of hydrogen. The correlation between the dislocation velocity and the applied shear stress is shown in Fig. 11. The results clearly show that softening occurs when the shear stress goes below τ s-h trans, and hardening occurs when the shear stress is in the region between τ s-h trans and τ II in these analyses conditions. Moreover, the correlation between the increment of the dislocation velocity,
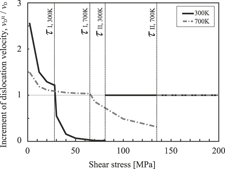
 , and the applied shear stress is shown in Fig. 12. It shows that by decreasing the stress, the magnitude of the softening increases in the softening region, which is qualitatively in good agreement with the experimental results.Reference Birnbaum and Sofronis5 And by increasing the stress, the magnitude of the hardening increases in the hardening region.
Correlation between frequency of motion and applied shear stress.

Correlation between shear stress and dislocation velocity in the presence of hydrogen: (a) 300 K and (b) 700 K.

Increment of dislocation velocity,  , in the presence of hydrogen.

Our results indicate that the dislocation mobility in the presence of hydrogen varies from softening to hardening depending on the applied shear stress. This leads to the conclusion that the dislocation motion around a crack shows characteristic behavior in a hydrogen environment. This indicates that an increment of the dislocation mobility in the presence of hydrogen occurs near the crack with a lower stress intensity factor. In this condition, the effective shear stress around the crack will be small and results in the acceleration of the plastic deformation. On the other hand, if the stress intensity factor becomes sufficiently large, then the dislocation mobility decreases compared with that in the absence of hydrogen. Thus, the plastic deformation is interrupted, and the distribution of the dislocations localizes around the crack. In fact, the hydrogen environment enhancement of the dislocation distribution localization around a crack was observed around the higher stress intensity factor crackReference Takahashi, Tanaka, Higashida and Noguchi42, Reference Takahashi, Tanaka, Higashida, Yamaguchi and Noguchi43 and complex distribution at lower stress intensity factor conditionsReference Takahashi, Sakamoto, Tanaka, Higashida and Noguchi44 using transmission electron microscopy for Fe-3.2 wt% Si.
IV. CONCLUSIONS
We investigated the occurrence conditions of the interaction between the {112}<111> edge dislocation and a solute hydrogen atom (C H = 0.5/nm) in alpha iron via the estimation of the stress-dependent activation barriers of the dislocation motion and hydrogen diffusion. After the classification of the dislocation motion and hydrogen diffusion, the correlation between the dislocation velocity and the applied shear stress was estimated. The results show that the increment of the dislocation velocity (softening) occurs when the applied stress is lower than τ s-h trans. The decrement of the dislocation velocity (hardening) occurs when the applied stress is larger than τ s-h trans and smaller than τ II. In these conditions (τ < τ II), the dislocation and hydrogen atom have an interaction with each other and result in competitive motion. In contrast, when the applied shear stress is larger than τ II, the dislocation leaves the hydrogen atom.
ACKNOWLEDGMENT
This research was partially supported by the Fundamental Research Project on Advanced Hydrogen Science funded by the New Energy Development Organization (NEDO).