Introduction
Currently the Antarctic fish fauna consists of 322 species, but based on the large size of the Southern Ocean and the total number of fish species (25 000–28 000) this figure is considered to be low (Eastman Reference Eastman2005). Moreover, since 76% of genera and 88% of species are endemic, this ichthyofauna has great biological relevance (Eastman Reference Eastman2005). The benthic species include representatives from cosmopolitan families, such as the Liparidae and Zoarcidae (Eastman & Eakin Reference Eastman and Eakin2000). However, the suborder Notothenioidei is the indigenous component of the fish fauna, dominating the shelf in terms of species diversity, abundance and biomass (Eastman & McCune Reference Eastman and McCune2000). This suborder is represented by eight families, of which five occur in Antarctic waters (Harpagiferidae, Artedidraconidae, Bathydraconidae, Nototheniidae and Channichthyidae) as coastal demersal fish species in water depths up to 1200–1500 m. Although the diversity of the Notothenioidei is limited, there is no other fish group in the world with such a diversification and dominance in a continental shelf habitat (Eastman Reference Eastman1995, Reference Eastman2005).
Antarctica and its fauna are receiving increasing attention in a world aware of global climate change, destruction of natural habitats and loss of biological diversity (Eastman Reference Eastman1993, Barnes & Peck Reference Barnes and Peck2008). In addition to the conservation issues, Antarctic fish play a key ecological role, especially in inshore waters, linking lower and upper levels of the food web (reviewed by Barrera-Oro Reference Barrera-Oro2002). Moreover, several species of Nototheniidae are a major resource in the Southern Ocean since the late 1960s (Kock Reference Kock1992). Knowledge of species composition in the Antarctic region is a fundamental prerequisite for ongoing studies in evolutionary biology, ecology, biogeography and conservation (Eastman Reference Eastman2005).
Since most of the investigations have been focused on single species, some aspects of the Antarctic fish fauna are poorly understood, such as the structure of fish assemblages at the mesoscale (Kock Reference Kock1992) and how key environmental variables can modulate it. However, some studies have examined geographical and depth distribution of fishes in both the eastern (Donnelly et al. Reference Donnelly, Torres, Sutton and Simoniello2004) and western Ross Sea (Vacchi et al. Reference Vacchi, La Mesa and Greco2000, La Mesa et al. Reference La Mesa, Cattaneo-Vietti and Vacchi2006, Clark et al. Reference Clark, Dunn, McMillan, Pinkerton, Stewart and Hanchet2010, Hanchet et al. Reference Hanchet, Stewart, McMillan, Clark, O’Driscoll and Stevenson2013), and northern South Shetland Islands (Kock & Stransky Reference Kock and Stransky2000, Pusch et al. Reference Pusch, Hulley and Kock2004). Nevertheless, more research is needed to describe the fish assemblages and how they might be structured by environmental factors in West Antarctica (Kock & Jones Reference Kock and Jones2005). The aim of this work was to analyse the fish species diversity and spatial distribution in the South Shetland Islands and Antarctic Peninsula during summer, and to determine whether assemblage structure changed geographically in response to environmental variables.
Materials and methods
Study area and sampling procedure
The study area broadly encompassed the South Shetland Islands and the Antarctic Peninsula (Fig. 1). The South Shetland Islands are located along 481 km of shelf oriented in a NE–SW direction. They are separated from Elephant Island by a narrow trench, which is more than 500 m deep and separated from the Antarctic Peninsula by deep waters (1100–2000 m) of Bransfield Strait (Acosta et al. Reference Acosta, Canals, Herranz and Sanz1989, Kock et al. Reference Kock, Jones and Wilhelms2000). The bottom topography in the west and north of the Antarctic Peninsula might be described as a shelf surrounded by islands, connected with the open sea by troughs of varying depths (Barrera-Oro Reference Barrera-Oro2002). Around the South Shetland Islands, the shelf break lies at depths between 225 and 380 m in the north-east (Elephant Island) and between 250 and 450 m in the rest of the archipelago (Acosta et al. Reference Acosta, Canals, Herranz and Sanz1989). The circulation in the region is controlled by an eastward component of the Antarctic Circumpolar Current, which balances the waters coming from the Antarctic Peninsula, the Weddell Sea and the Bellingshausen Sea (Gordon Reference Gordon1988, Barrera-Oro Reference Barrera-Oro2002). In the Antarctic Peninsula the coastal currents generally flow to the west and south (Stein Reference Stein1995).
Study area and sampling stations during 2011 (blue triangles) and 2013 (red circles). Solid black line represents the 200 m isobath.

Station locations for all bottom trawl deployments were based on initial acoustic reconnaissance of the sea floor using Simrad EK-500 echo sounders and were positioned to provide as wide a geographical range as possible, given weather, sea floor and ice conditions. The 36 stations are all located within the seasonal pack ice zone and islands north of it in the Atlantic Ocean province. This classification follows the ichthyofaunistic subdivision of the Southern Ocean proposed by Kock (Reference Kock1992), which is based on the distribution of pelagic and coastal fish fauna.
Fish were collected during February 2011 and 2013 from the OV Puerto Deseado of the Consejo Nacional de Investigaciones Científicas y Técnicas (CONICET, Argentina). As the oceanographic vessel only has an ice-strengthened hull the survey was restricted to areas where ice cover was light. A demersal bottom trawl pilot net (6 m in total length, with 25 mm mesh on the wings and 10 mm in the cod end, 0.6 m vertical opening and 1.8 m horizontal aperture) was used to collect fish. Hauls were taken during both day and night, with a target time for a bottom trawl of 15 minutes and tow speed between 2–3.7 knots. Surface temperature and salinity data were measured using a Seabird SBE 21 thermosalinograph, while depth in deep water was measured with a Monhaz echo-sounder. At each station all fish were counted, measured to total length (TL) and identified to the lowest possible taxonomic level following Gon & Heemstra (Reference Gon and Heemstra1990) and specific taxonomic papers.
Data analysis
Fish numbers were standardized for each station using 15-minute net towing times. The (log) average of relative abundance (RA) of each fish species and their (log) percentage frequency of occurrence were calculated to establish a semi-quantitative classification of the species by means of the Olmstead Tukey’s test (Sokal & Rohlf Reference Sokal and Rohlf1979). The sampling stations were grouped based on species composition by means of a non-metric multidimensional scaling (nMDS). In order to reduce the influence of the dominant species (Legendre & Legendre Reference Legendre and Legendre1998), the matrix was log-transformed (x+1), where x is the value of a species. The fish species responsible for the multivariate pattern, the intra-group similarity and inter-group dissimilarity were identified by means of a similarity-percentages analysis (SIMPER). These multivariate techniques were performed with the PRIMER 6 statistics package (Clarke & Warwick Reference Clarke and Warwick2001) using the Bray-Curtis (dis)similarities index. Those sampling stations with lower fish abundance (< 1%) and rare species (< 0.1%) were not considered for multivariate analysis, and therefore only 30 stations were used.
In addition, the variation in the fish assemblage over space in relation to the environmental variables was evaluated by direct gradient-canonical correspondence analysis (CCA) through the use of the CANOCO 4.5 software package (Ter Braak & Smilauer Reference Ter Braak and Smilauer2002). For this analysis, the length of the gradient in the detrended correspondence analysis (DCA) (> 4) has been taken into account. The global model contained log-transformed (x+1) environmental variables (water temperature, salinity and depth). Fish-abundance data also were log-transformed, scaling was focused on interspecies correlations and biplot scaling type was used. The significance (P<0.05) of the CCA gradient and the selection of environmental variables was assessed by Monte-Carlo permutation tests. This technique yielded a so-called ‘triplot’, where species (represented by acronyms) and sample stations (represented by symbols) together with key environmental variables (represented by vectors) are displayed in a 2-D ordination diagram. Data are presented as mean±standard deviation unless stated.
Results
Fish-sample composition and representation
A total of 3378 individuals and 36 species belonging to 26 genera and nine families were captured at 36 stations. The most abundant species in terms of RA were Lepidonotothen nudifrons (29%, TL=10.6±2.8 cm), L. larseni (25%, TL=12.9±3.9 cm), Trematomus scotti (19%, TL=13.8±2.7 cm), Harpagifer antarticus (12%, TL=8.0±2.1 cm), followed by Gobionotothen gibberifrons (3%, mean TL=23.3±6.3 cm) and T. eulepidotus (3%, TL=17.3±3.9 cm). The Olmstead Tukey’s analysis indicated that 20% of the species should be considered as dominant, 10% as common, 13% as occasional and 57% as rare (Table I).
List of species found at 36 sampling stations during 2011 and 2013, and ecological status.

D=dominant, C=common, O=occasional, R=rare.
Spatial pattern
The nMDS ordination diagram from the two years produced six main groups (Fig. 2) that reflected a geographical arrangement, which were named as follows: group 1=Gerlache Strait (stations 25, 26 and 27 of 2013), group 2=Deception Islands (stations 24 of 2011, 21 and 29 of 2013), group 3=Biscoe Island (station 24 of 2013), group 4=between Elephant and King George islands (stations 7 and 8 of 2013), group 5=northern Antarctic Peninsula (stations 28, 29, 30 and 31 of 2011), and group 6=South Shetland Islands and surroundings (stations 2, 11, 14, 16, 17, 20 and 25 of 2011, plus 10, 14, 15, 16, 17, 19 and 20 of 2013). Stations 13 of 2013 and 7 of 2011 constituted sub-group 6a=shallower South Shetland Islands, while station 26 of 2011, which appeared distant from other stations of the South Shetland Island, formed the sub-group 6b=deeper South Shetland Islands. This small grain ordination could be explained by taking into account the sampling depths of the stations (Table II).
An nMDS ordination diagram of 30 sampling stations based on fish composition. Green crosses=Gerlache Strait (group 1), light-blue squares=Deception Island (group 2), grey crosses=Biscoe Island (group 3), violet circles=between Elephant and King George islands (group 4), red diamonds=northern Antarctic Peninsula (group 5), blue triangles=South Shetland Islands (group 6), green triangles=shallower sampling stations in the South Shetland Islands (sub-group 6a), blue asterisk=deeper sampling station in the South Shetland Islands (sub-group 6b).

Date and location of sampling stations and environmental factors measured.

Relationship between fish assemblage areas and environmental variables
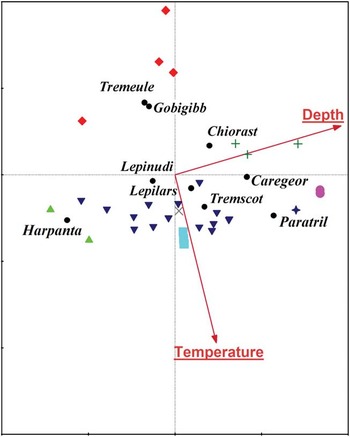
The first two axes of the CCA accounted for 21.3% of the total variance in species number, with both the first axis and the sum of them being significant (P<0.05). The first ordination axis was the most important in the spatial distributions of stations and was also well correlated with the environmental data (Table III, Fig. 3). Depth (F=4.14, P=0.002) was the main environmental factor structuring the fish assemblages along the first axis, followed by temperature in the second axis (F=3.13, P=0.004). Salinity did not significantly contribute to the spatial pattern found (F=1.31, P=0.29) (Fig. 3).

Summary statistics of the canonical correspondence analysis (CCA) for the fish assemblage and environmental factors in West Antarctic.

Description of fish assemblage groups
Group 1 located in the Gerlache Strait near Anvers and Melchior islands (Table II, Figs 1 & 2), encompassed stations at intermediate depths (403±126 m) and temperatures (1.46±0.09°C). This group had a similarity value of 50.6% and was characterized by equal numbers of T. scotti and Chionodraco rastrospinosus (Table IV, Fig. 3) and had the highest species number (S=11) with the exclusive presence of Bathyraja maccaini and Dolloidraco longedorsalis. In the Gerlache Strait, several specimens of Lycenchelys nigripalatum, which had previously been reported only by its holotype, were captured.
SIMPER analysis of the assemblage areas analysed during both 2011 and 2013. Those species contributing to, in total, >90% of the average similarity are listed.

Group 3 and sub-group 6b contained fewer than two stations and therefore could not be included in the analysis.
Group 2 included stations within the semi-enclosed Deception Island at near 150 m and temperatures above 2°C (Table II, Figs 1 & 2). The species number varied between three and six and T. scotti accounted for the 84% of RA of the total catch and 63% of the total 76% intra-group similarity (Table IV, Fig. 3).
Group 3 was composed of only one station located in the southern part of Antarctic Peninsula at 163 m and 2°C (Table II, Figs 1 & 2). This station was characterized by six species, with L. larseni (71%) being the most abundant in terms of RA, followed by T. bernacchii (18%) and L. nudifrons (6%) (Fig. 3). It was also characterized by the exclusive presence of Chaenocephalus aceratus.
Group 4 consisted of two deep stations (588±3.5 m) with temperatures above 2°C located between Elephant and King George islands (Table II, Figs 1 & 2). This group had a similarity level of 51% and between three and five species were found here. It was characterized by the exclusive presence of Lycenchelys antarctica and Careproctus georgianus (Fig. 3). The latter contributed mostly to similarity followed by L. larseni (Table III).
Group 5 was composed of stations situated in northern Antarctic Peninsula at a depth between 88–244 m and with lower temperature (0.2–0.8°C) (Table II, Figs 1 & 2). The similarity value was 58.3% and the species number varied between six and eight, among which G. gibberifrons, L. nudifrons, T. eulepidotus and L. larseni provided the majority of intra-group similarity (Table IV, Fig. 3). Trematomus newnesi and Prionodraco evansii were only captured at these stations.
Group 6 was composed of stations located around South Shetland Islands at an average depth of 164±63 m with temperatures of 2±0.2°C (Table II, Fig. 2). The species number varied greatly, with between one and eight sampled, and the percentage of intra-group similarity was 56%. The species responsible for the grouping were L. larseni and L. nudifrons (Table IV, Fig. 3). Ophthalmolycus amberensis was only captured at this site. Paraliparis gracilis were also recorded in the South Shetland Islands for the first time, P. trilobodon is only previously known from the types and the T. tokarevi record was the second reported in this region. In addition, the sub-group 6a included two stations located in the South Shetland Islands at shallow depths (60±11 m). Despite their geographical proximity, the high dominance of H. antarcticus, which accounted for 97% of RA and 70.7% of the intra-group similarity (Table IV), separated these stations from group 6 in the ordination diagram (Fig. 2); the separation was less significant in Fig. 3. A similar situation occurred for station 26 of 2011, which was located at 454 m. Although L. larseni was the most abundant species, the presence of T. eulepidotus, P. trilobodon and Pogonophryne permitini justified the formation of another sub-group (Figs 2 & 3).
Discussion
The composition of species recorded was consistent with previous records of coastal fishes from the Atlantic sector of the seasonal pack ice zone, which is dominated by notothenioid fishes such as Lepidonotothen, Notothenia, G. gibberifrons, some channichthyids and the presence of both Trematomus (less diverse than in East Antarctica) and Harpagifer genera (Kock Reference Kock1992, Eastman Reference Eastman1993). In addition, some high Antarctic species were found (Table I) of which Cryodraco antarcticus and T. eulepidotus were also collected in the Scotia Arc (Kock et al. Reference Kock, Jones and Wilhelms2000). Overall, findings reported here agreed with the proposition of Antarctic Peninsula and the southern Scotia Arc as an area where the fish distribution of the seasonal pack ice zone and islands north of it, and high Antarctic zone overlap (Kock Reference Kock1992).
These surveys have also extended the known area of species distribution. For example, C. georgianus, a species typical of South Georgia, and P. operculosus, a species typical of Continental Antarctica, were found in the Antarctic Peninsula. However, the use of the pilot bottom trawl net probably oversampled small and benthic fishes. Due to the size of the net and mesh used, the net mainly targeted fish with a TL ranging from 10–15 cm, and hence larger fishes were probably not retained. This sampling effect might be reflected in the catchability of larger fish species such as Notothenia rossi, N. coriiceps, G. gibberifrons and Champsocephalus gunnari commonly reported in West Antarctica. Due to its small size, the trawl net used in this work probably provided a bias towards the larger demersal fish who contribute significantly to the biomass in our sampling areas (Eastman Reference Eastman1993), but at the same time offer opportunities to collect information generally not obtained during surveys using large bottom trawls. Although the fishing area was intensively studied over the past 30 years using trawl surveys, the pilot net provided new locality records (e.g. C. georgianus, P. operculosus) and caught species that are extremely rare (e.g. P. trilobodon, T. tokarevi and Lycenchelys nigripalatum). In the western Ross Sea, the opposite pattern was apparent since small and benthic fishes, such as Liparidae (snailfishes), Zoarcidae (eelpouts), Artedidraconidae (barbeled plunderfishes) and Bathydraconidae (Antarctic dragonfishes), were probably poorly sampled using a large net while larger fishes belonging to Macrouridae (grenadiers, rattails), Moridae (deep sea cods), many of the Nototheniidae (cod icefishes) and Channichthyidae (crocodile icefishes) were better sampled (Clark et al. Reference Clark, Dunn, McMillan, Pinkerton, Stewart and Hanchet2010). The problem of selectivity of sampling equipment has already been noted by Kock (Reference Kock1992) and was discussed in assemblage surveys performed at South Georgia, the South Sandwich Islands, Bouvetøya and the South Orkney Islands (Targett Reference Targett1981, Jones et al. Reference Jones, Anderson, Balushkin, Duhamel, Eakin, Eastman, Kuhn, Lecointre, Near, North, Stein, Vacchi and Detrich2008).
The low number of dominant species in the fish assemblage is consistent with a widespread and general pattern described for various taxa (including fishes) in which a few species are dominant, others only moderately common, and the majority are either uncommon or rare (Magurran et al. Reference Magurran, Khachonpisitsak and Ahmad2011). In the study area only seven species were considered dominant; L. larseni, L. nudifrons and G. gibberifrons were by far the most numerous and broadly distributed. These species were also described as the most abundant in fish assemblages located north of the study area, at locations such as South Sandwich Islands at a depth of 85–503 m, South Georgia between 120–150 m, and South Orkney Islands between 274–305 m (Targett Reference Targett1981, Jones et al. Reference Jones, Anderson, Balushkin, Duhamel, Eakin, Eastman, Kuhn, Lecointre, Near, North, Stein, Vacchi and Detrich2008). Across much of the Atlantic sector of the Southern Ocean, L. larseni, L. nudifrons and G. gibberifrons are regarded as ecologically important species because of their high local abundance and consequent importance as prey to piscivorous fish species, such as channichthyids and Dissostichus eleginoides Smitt (Kozlov et al. Reference Kozlov, Pinskaya, Podrazhanskaya and Tarverdieva1988, Kock Reference Kock1992, Takahashi & Iwami Reference Takahashi and Iwami1997, Flores et al. Reference Flores, Kock, Wilhelms and Jones2004). Others species, such as H. antarcticus of South Shetland Islands, are considered locally dominant in coastal waters. Other dominant species were T. eulepidotus around northern Peninsula Antarctica, which was considered common in offshore waters (Barrera-Oro Reference Barrera-Oro2002) and Chionodraco rastropinosus in the Gerlache Strait. Finally, T. scotti was dominant around Deception Island and to the south-west.
Although species composition in our surveys did not strongly differ from patterns predicted by zoogeographical studies for this region, multivariate analysis allowed us to discriminate assemblage areas based on fish composition. Three of the assemblages contained data collected from stations sampled during both 2011 and 2013 (groups 2, 6 and 6a) and hence showed some degree of inter-annual consistency in the summer spatial ordination. Conversely, due to limited fishing effort, group 3 in the south-west Antarctic Peninsula should be regarded as provisional.
As shown by the SIMPER analysis, these geographical differences were primarily caused by variation in the abundance of the most dominant species and to a lesser extent by the appearance/disappearance of certain species from one shelf area to the other.
The spatial pattern of assemblage species could be due in part to the population dynamics of each species. Therefore, the abundance of some dominant species in the fish assemblage follow a latitudinal and bathymetrical trend. These species are L. larseni, T. scotti and L. nudifrons, which had peaks of abundance that never occurred in the same area. For example, starting from north-east, L. larseni was present at all stations of the South Shetland Islands (group 6), where it was the most abundant species. However, consistent with their known depth range (30–550 m, Gon & Heemstra Reference Gon and Heemstra1990), its abundance was much lower in the deeper station of South Shetland Islands area (sub-group 6b) and between Elephant and King George islands area (group 4). Moreover, L. larseni was totally absent from the shallower station of South Shetland Islands area (sub-group 6a). In addition, L. larseni was present in northern Antarctic Peninsula (group 5), Deception Island (group 2) and Biscoe Island (group 3) where it was substantially less important, but was totally absent from the Gerlache Strait (group 1). Thus, it showed a progressive reduction of its abundance towards south-west latitudes. This species was also mentioned as dominant in the fish assemblage located further north-east of the study area between 123–150 m at South Georgia and between 274–305 m at the South Orkney Islands. Furthermore, at these locations, trawls at depths between 57–90 m and 93–159 m, respectively, had lower L. larseni abundance (Targett Reference Targett1981). At South Georgia, as well as in the South Sandwich Islands, this species was very abundant during the winter (Jones et al. Reference Jones, Anderson, Balushkin, Duhamel, Eakin, Eastman, Kuhn, Lecointre, Near, North, Stein, Vacchi and Detrich2008).
The opposite pattern was found in T. scotti, which was absent from the South Shetland Islands and adjacent waters, but was present in the Gerlache Strait, Biscoe Island and was strikingly abundant inside Deception Island. A distinctive black, soft volcanic sea floor was observed here. This finding of an association of T. scotti with this sea floor type was consistent with the occurrence of this benthic species in low rugosity environments from the Ross Sea, where underwater images showed individuals on soft sediment sea floor types (Clark et al. Reference Clark, Dunn, McMillan, Pinkerton, Stewart and Hanchet2010). This species is also the most abundant in the Bellingshausen Sea (Matallanas & Olaso Reference Matallanas and Olaso2007). A similar latitudinal pattern with high abundance of Trematomus spp. (especially T. scotti) in the southern and Lepidonotothen (L. larseni, L. nudifrons and G. gibberifrons, all Nototheniops at that time) in the northern Antarctic Peninsula was previously demonstrated by Daniels & Lipps (Reference Daniels and Lipps1982). Finally, L. nudifrons was observed at its maximum abundance in the northern Antarctic Peninsula (apart of one site at 88 m), and was a minor component in at least half of the stations around the South Shetland Islands, Biscoe Island and Deception Island.
The main environmental driver of fish assemblage in West Antarctica, as shown by CCA, was depth. This parameter is a determinant in controlling several species assemblages in Antarctic environments, including fishes (La Mesa et al. Reference La Mesa, Cattaneo-Vietti and Vacchi2006, Clark et al. Reference Clark, Dunn, McMillan, Pinkerton, Stewart and Hanchet2010), echinoids (Moya et al. Reference Moya, Saucéde and Eugenia Manjón-Cabeza2012), benthic and suprabenthic fauna (San Vicente et al. Reference San Vicente, Castelló, Corbera, Jimeno, Munilla, Sanz, Sorbe and Ramos2007, Sáiz et al. Reference Sáiz, García, Manjón-Cabeza, Parapar, Peña-Cantero, Saucède, Troncoso and Ramos2008), and molluscans (Troncoso & Aldea Reference Troncoso and Aldea2008). The sampling sites combined with depth were the main variables affecting the spatial structure of fish assemblages. Thus, trawl stations that were geographically close were similarly located in the standardized fish composition ordinations diagrams. However, when trawl depths differed, even at nearby locations, the stations appeared distant in the ordinations diagrams. This could be related to a smaller expanse and greater depth of the shelf areas in Antarctica (Matallanas & Olaso Reference Matallanas and Olaso2007, Aldea et al. Reference Aldea, Olabarria and Troncoso2008), which causes an unusual bathymetric distribution in Antarctic coastal fish fauna compared with coastal fish faunas in other parts of the world (Kock Reference Kock1992). As a result, major changes in species composition may occur in Antarctic fish assemblages (or changes in relative abundance, as shown in this study) due to abrupt changes of depth over short distances. This may have happened in the South Shetland Islands area, where we sampled a wide range of depths and observed different species associations. The existence of shallow-water fish species dominated by the most neritic ones, such as H. antarcticus (sub-group 6a), N. coriiceps and juveniles of N. rossii, was also recorded by Barrera-Oro (Reference Barrera-Oro2002). On the other hand, the sampling depth of sub-group 6b (454 m) coincides with the shelf break of the archipelago (450 m), thereby justifying its separation from the other shelf stations of the South Shetland Islands. A detailed distribution analysis along a vertical axis (depth) around the lower South Shetland Islands, as exists for Elephant Island (Kock & Stransky Reference Kock and Stransky2000), requires a proper sampling design (Kock et al. Reference Kock, Jones and Wilhelms2000).
Depth, as the main factor that explained the fish assemblages, is not necessarily straightforward to interpret. The consideration of substrate type and invertebrates related to the bottom as a proxy of food supply was not possible in our study, but these factors could be important issues in fish species associations (Clark et al. Reference Clark, Dunn, McMillan, Pinkerton, Stewart and Hanchet2010). Finally, although Antarctic shelf waters are relatively thermally stable throughout the year (Eastman 1993), temperature was also identified as relevant in defining fish assemblage areas. This factor was relevant in discriminating the colder stations of northern Antarctic Peninsula from the relatively warmer stations of the South Shetland Islands and Deception Island, with the latter currently having volcanic activity.
Identifying the co-occurrence of fish species distribution and physical variables is a first step to understanding the processes that underpin assemblage structure and composition patterns, which is a main goal of marine ecological research. Describing species assemblage areas, which are geographical areas characterized by a relatively homogeneous and persistent species composition, is the next step. The predictability of the fish composition within defined species assemblage areas can provide valuable information as baseline data for future conservation programmes, as well as for a management policy based on the structure of a given ecosystem.
Acknowledgements
We thank John Grettenberger for assistance with the English language of the manuscript. This research was supported by CONICET (Consejo Nacional de Investigaciones Científicas y Técnicas) (Project-PIP 0321), DNA (Dirección Nacional del Antártico) and IAA (Instituto Antártico Argentino). We also thank the anonymous reviewers for their helpful suggestions to improve the manuscript.