Introduction
The purpose of this paper is to consider the suggestion in some recent studies of animal vision (e.g. Nuboer et al., Reference Nuboer, Coemans and Vos1992; Lewis and Morris, Reference Lewis and Morris2000; Prescott et al., Reference Prescott, Wathes and Jarvis2003) that photometric calculations using standard human spectral sensitivity data may not be satisfactory for applications with other animals. One alternative would be to use bespoke spectral sensitivity functions for each species or group of species. The consequences of using an inappropriate calculation is that the luminous flux or light level may be too bright or dim, depending on the species’ spectral sensitivity. In turn, this may affect health, production or welfare by light-induced mechanisms, e.g. photo-periodism or injurious feather pecking in domestic fowl. While there are guidelines for the optimum level of light for domesticated species kept for agricultural or scientific purposes, these are based on standard CIE human photopic data (CIE, 1983) (see next section). No account is made of the species-specific differences in spectral sensitivity.
There may also be adverse consequences for the specification of photometers that are used to measure the light level in animal houses. Most commercially available photometers and luminance meters have filters and electronic components that produce a spectral response that approximately matches the CIE photopic function. Hence, we also address the question of whether photometers with other spectral sensitivities to match those of individual species would be useful.
Material and methods
Spectral sensitivity is defined here as the reciprocal of the energy or power to provide a given visual response and is often measured at the threshold levels of the stimuli. Hence, the higher the energy required to produce a given response, the lower the visual sensitivity and vice versa. In the human case there are two main spectral sensitivity functions called the scotopic and photopic functions (Wyszecki and Stiles, Reference Wyszecki and Stiles1982; CIE, 1983; Hunt, Reference Hunt1998; Shevell, Reference Shevell2003). Scotopic vision is derived primarily from the rod receptors and in the human eye scotopic vision is maximally sensitive near 507 nm in the blue–green region of the spectrum. It provides the main response to luminances from a few millionths of a cd/m2 and above. Photopic vision is derived primarily from the three types of cone receptors in the human eye and is maximally sensitive near 555 nm, in the green region of the spectrum. It is the main response to luminances from a fraction of a cd/m2 and above (also see the Discussion section).
The general method to calculate species-specific lighting levels is as follows. Published data on the spectral sensitivity of a number of domesticated species (turkey, duck, chicken, cat, rat, mouse and human) were collated. Calculations of lighting levels using the individual spectral sensitivity function for each species were made for 14 sources of light, covering a range of spectral power distributions. These were compared with results obtained using the standard photopic human spectral sensitivity function, which is known as the CIE 1924 photopic relative luminous efficiency function or the Vλ function (CIE, 1983). This function is used almost universally to calculate lighting levels from lamp spectral power distributions for human applications. Calculations based on the corresponding standard human rod-based function, the CIE 1951 scotopic relative luminous efficiency function or the Vλ′ function (CIE, 1983) were also made.
All the spectral sensitivity data were, where necessary, converted to the reciprocals of behavioural threshold energies or powers, measured in watt-based units and interpolated linearly at 5-nm intervals from 300 or 380 nm, up to 780 nm. The experimental conditions of the original studies varied considerably but nevertheless allow the effect of spectral sensitivity on lighting levels and other photometric values over a range of species and light source conditions to be assessed.
Turkey, duck, chicken and human spectral sensitivities
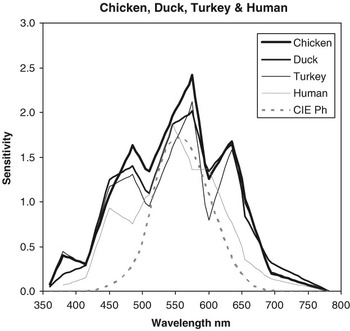
The spectral sensitivity data, shown in Figure 1, were obtained by Prescott and Wathes (Reference Prescott and Wathes1999) for chicken and by Barber et al. (Reference Barber, Prescott, Jarvis, Le Sueur, Perry and Wathes2006) for turkey, duck and human. These data were treated as a group since they were measured under similar experimental conditions. The data were based on threshold detection measurements of medium-sized visual fields, of approximately 5 degrees angular subtense, at 12 wavelengths between 360 and 694 nm.
Spectral sensitivity of chicken, turkey, duck and human subjects measured under similar conditions by Prescott and Wathes (Reference Prescott and Wathes1999) and Barber et al. (Reference Barber, Prescott, Jarvis, Le Sueur, Perry and Wathes2006). The sensitivities are based on threshold measures for the detection of a simple field against a light background. The CIE photopic function scaled to match the human data at 555 nm is included for comparison.

As indicated above, the original data were given in photon units, and were converted to units of power. The relative values of the different species were not altered, and therefore the increased sensitivity of the chickens, ducks and turkeys over that of humans is as found in the original data. For comparison, the corresponding data for the CIE human photopic observer have also been included and were scaled to match that of the mean human response at 555 nm (green), normally the most sensitive wavelength for human photopic vision.
The most striking feature of these data is the broader function with additional maxima (or increased sensitivity) at short (blue/blue-green, near 440 to 500 nm) and long (orange/red, near 600 to 660 nm) wavelengths for all four species (including human), compared with the single-peak bell-shaped CIE photopic function.
Cat, rat, mouse and CIE human scotopic functions
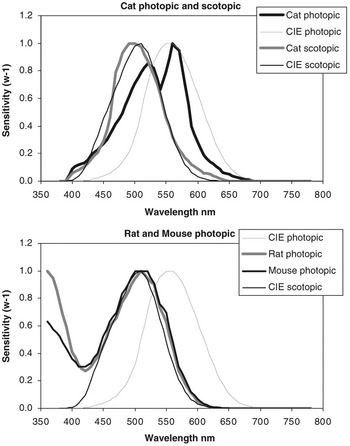
Figure 2 shows spectral sensitivity data for cat, rat, mouse and the human CIE 1951 scotopic functions. For comparison, the corresponding data for the CIE photopic function have again been included.
Spectral sensitivities of cat (photopic and scotopic; Berkley, Reference Berkley1976), rat (photopic, Jacobs et al., Reference Jacobs, Fenwick and Williams2001), mouse (photopic, Jacobs et al., Reference Jacobs, Williams and Fenwick2004), and CIE scotopic human scaled to match at 510 nm close to their maximum sensitivities. The CIE photopic function is included for comparison.

The spectral sensitivity data for the cat were tabulated by Berkley (Reference Berkley1976) from the photopic studies of Brown et al. (Reference Brown, Shively, LaMotte and Sechzer1973) and from the unpublished scotopic data of Loop (1971).
The rat data were taken from the increment threshold study of Jacobs et al. (Reference Jacobs, Fenwick and Williams2001). The rat is primarily a nocturnal animal and its vision is dominated by rods, but the conditions of these experiments were chosen to enhance photopic vision. These data are of interest since the photopic response is attributed to two types of cone; one that is maximally sensitive at approximately 360 nm in the UV region of the spectrum and the other with a maximum sensitivity at approximately 510 nm.
The mouse data were taken from the increment threshold study of Jacobs et al. (Reference Jacobs, Williams and Fenwick2004). As with the rat, the photopic response is attributed to two types of cones with maximal sensitivity at approximately 360 and 510 nm. In both these studies, the measurements were also confirmed by electroretinogram responses. The rat and mouse data were not recorded for wavelengths below 350 nm and were extrapolated to 300 nm by assuming that the spectral sensitivity on either side of 355 nm is symmetrical.
The CIE scotopic function is based on human detection thresholds, measured under conditions where the vision is dominated by rods rather than cones (Wald, Reference Wald1945; Crawford, 1949; CIE, 1983). This shows a maximum sensitivity at 507 nm. The scotopic human and scotopic cats are the only scotopic functions included, but these can be considered as representative of this group.
We have no knowledge of the comparative overall sensitivity of cat, rat, mouse and human photopic and scotopic functions and therefore in Figure 2 the maximum sensitivity in each case has been normalised to unity at either 555 or 510 nm, near the maximum sensitivities.
Two human subjects – detection and discrimination of fine detail
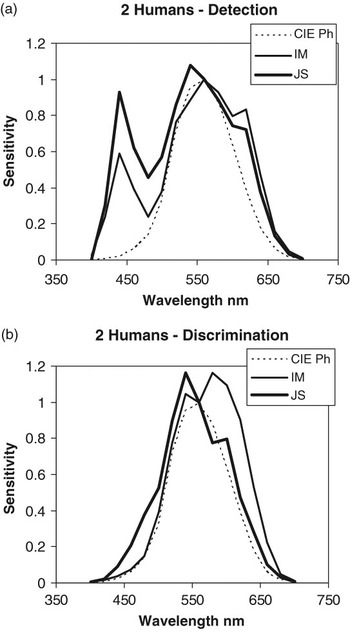
Figure 3 shows spectral sensitivity data for two human subjects (Moorhead and Saunders, Reference Moorhead and Saunders1982), firstly for the simple detection of moderate-sized visual stimuli of 1-degree angular subtense (Figure 3a) and secondly for the discrimination of structure or detail of 7.5 min of arc within the same test area (Figure 3b). Pairs of measurements for detection and discrimination were recorded within minutes of each other. The spectral sensitivity varied from the broad multiple-peaked shape to almost a single peak as the task became more dependent on the recognition of fine detail. These differences probably arise from the two tasks requiring a response to different ranges of spatial frequencies. They may also be due in part to the subjects adopting a different strategy when simply detecting the presence of a luminous area rather than discriminating a more detailed shape or structure.
The spectral sensitivities of two human subjects for the detection of (a) a 1 degree patch of light and (b) for the discrimination of 7.5 min sized detail within the patch (Moorhead and Saunders, Reference Moorhead and Saunders1982). The CIE photopic function scaled to match the human data at 555 nm is included for comparison.

Light sources
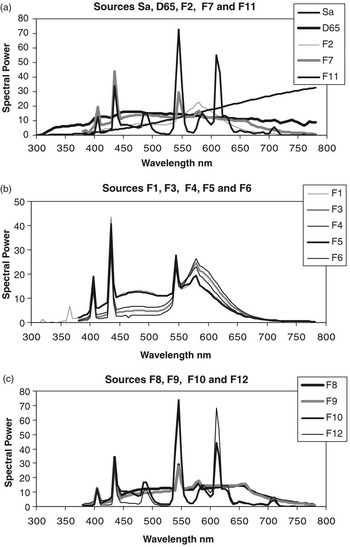
In all, 14 light sources were chosen to cover a wide range of spectral power distributions and fluorescent lamps that are nominally ‘white’ light, readily available and used for interior lighting, including animal houses (Figure 4). Sa is the CIE standard, which is used to represent the spectral power distribution of incandescent or tungsten filament lamps commonly used in domestic and other environments. D65 is the CIE standard most commonly used to represent a typical phase of daylight. Sources F1 to F12 are not CIE standards, but represent commonly available fluorescent lamps using a variety of phosphors (Hunt, Reference Hunt1998), including fluorescent lamps based on ‘normal’ (F1 to F6), ‘broad band’ (F7 to F9) and ‘three band’ phosphor mixtures (F10 to F12). F2, F7 and F11 are sometimes used as typical members of the three groups. The phosphors of fluorescent lamps are often chosen by the manufacturer to mimic daylight, incandescent light or other near white conditions. Sources simulating incandescent lighting have a correlated colour temperature of about 2850 to 3000 K, whereas daylight, a slightly bluer white, will have a colour temperature in the range from 5500 to 6500 K.
Spectral power distributions of the 14 sources used for the calculations in this study. (a) Sa, D65, F2, F7 and F11; (b) F1, F3, F4, F5 and F6; and (c) F8, F9, F10 and F12.

Fluorescent lamps that are commonly used to illuminate interiors emit very little UV light. Incandescent light has a little UV and daylight has a significant amount. Human vision is normally assumed to be confined to the 380 to 780-nm region of the spectrum. Consequently, the spectral power distributions of the lamps F1 to F12 are only tabulated in this region. However, some of the species studied here are sensitive to wavelengths below 380 nm, in particular the rat and the mouse. The calculations were therefore extended for three sources, F1, Sa and D65, to include spectral sensitivities down to 300 nm. The source data in the UV region are well tabulated for Sa and D65. To include a fluorescent lamp, F1, the output, suitably scaled, was modified using the data of Hirt et al. (Reference Hirt, Schmitt, Searle and Sullivan1960) in the UV region of the spectrum for a daylight fluorescent lamp. The energies in this region are small, but not insignificant for the cone receptors of the rat and mouse. Similar-sized UV effects are probably applicable to any of the fluorescent lamps F1 to F12.
Calculation of lighting and photometric quantities
In the case of human vision, there is an internationally agreed method to take into account variations in spectral sensitivity when calculating lighting levels and other photometric quantities. There are two factors to consider; firstly, the sensitivities to different wavelengths and secondly the overall sensitivity. It is well established that there are two basic human visual systems, which affect the spectral sensitivity and the overall luminous response, and that these are relatively independent. The human photopic system is believed to derive its spectral response from the three cone inputs and the scotopic system is driven by the rod receptors. As mentioned above, the CIE has agreed on spectral sensitivity data called the CIE 1924 photopic standard observer and the CIE 1951 scotopic standard observer (Figures 1, 2 and 3). It is normally assumed that under moderate and high levels of light only the CIE photopic function needs to be considered.
The relationship between luminous quantities, L (such as luminous flux, luminance, illuminance, luminous intensity, etc.), and the corresponding energy quantities, R (radiant flux, radiance, irradiance, radiant intensity, etc.), are all defined by the same relationship

or

where L represents the calculated value of the luminous quantity and Rλ is the corresponding energy or radiant quantity as a function of wavelength. Vλ is the spectral sensitivity function and km is a constant (Wyszecki and Stiles, Reference Wyszecki and Stiles1982; CIE, 1983; Hunt, Reference Hunt1998; Shevell, Reference Shevell2003). Normally only discrete values of Rλ and Vλ are known and the above summation (Equation (2)) is carried out over 1, 5 or 10-nm intervals. In these equations, additivity is assumed by definition, and experience shows that in general this works well.
Results
Calculations of luminous quantities using species-specific wavelength sensitivities
All calculations were carried out using Equation (2) for each species’ spectral sensitivity function and for the two CIE standard photopic and scotopic observers. The spectral power distributions of each of the 14 sources were scaled to produce the same luminous level (namely 100 luminous units or CIE ‘lumens’) when the CIE photopic function is the spectral sensitivity function used in the calculation.
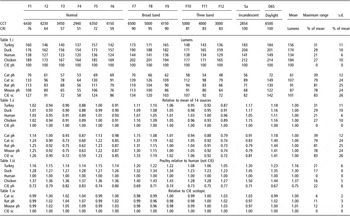
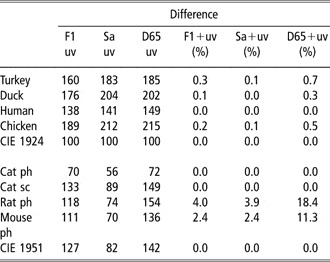
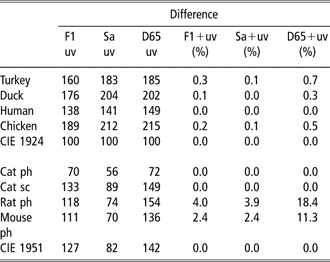
Tables 1.i–1.iv summarise the main results. In Table 1.i, calculated ‘lumen’ values are shown for each species together with the mean, maximum range and the standard deviation (s.d.) for the 14 light sources. Table 1.ii shows the same values scaled relative to the mean for all 14 light sources. In Table 1.iii the poultry data are shown relative to human results obtained in the original studies. Table 1.iv presents the scotopic cat, rat and mouse data relative to the CIE scotopic data. For simplicity, the UV contribution from 300 to 380 nm is treated as an additional calculation (Table 2).
Calculated lumen values for 14 light sources for 10 visual systems (turkey, duck, chicken, human, cat (photopic and scotopic) rat and mouse; plus the CIE photopic and CIE scotopic observers) using their individual spectral sensitivity functions for wavelengths from 380 to 780 nm

ph = photopic; sc = scotopic.
The original spectral power distribution of each light source has been scaled to produce the same lumen output of 100 lumens when the CIE photopic data is used in Equation (2).
Correlated colour temperatures (CCT) and CIE colour rendering indices (CRI) are shown for each source. CCTs indicate the type of white. Warm white and yellow white sources have CCTs near 3000 K, whereas bluer and daylight whites will be greater than 5000 K. CRIs show how well the lamp reveals the normal colour properties of surfaces. These vary from 0 for no colour rendering ability up to 100 for perfect colour rendering; a basic warm white fluorescent lamp will generally have moderate colour rendering ability and may be close to 50 on this scale.
The calculation of the maximum range is subject to rounding errors.
Extension of calculated lumen values shown in Table 1 to include the contribution of UV radiation (300 to 380 nm) for three light sources F1, Sa and D65
As indicated above, the calculations could be the number of lumens emitted by the lamp, the illuminance on a surface at a given distance, the luminous intensity of the lamp or some other photometric quantity depending on the application. For our purpose it does not matter which quantity is being used since the relative effects of different lamps and animals will be the same for each photometric quantity. Therefore, for simplicity, reference is made to the ‘lumen’ values or the luminous output. These can be considered as turkey ‘lumens’, duck ‘lumens’, CIE ‘lumens’, etc.
Lumen values calculated for different species
Each set of 14 ‘lumen’ values for each species shows a good approximation to a normal distribution: the s.d. is therefore a useful indication of the variation of lamp lumens. For each lamp the corresponding CIE photopic lumens is defined arbitrarily as 100 units. The s.d. of the 14 calculated lamp lumens is shown as a percentage of the mean value in Table 1. As expected, the corresponding maximum range of ‘lumen’ values approximates to 3 times the value of the s.d. In the discussion, reference is made to the ‘maximum range’ across the 14 sources since this will show the extreme effect of replacing a lamp with another one, which, according to the CIE photopic function, has the same light output.
Poultry and humans
Generally the lumen outputs occur in the following order of magnitude: chicken (highest lumen values or most sensitive), duck, turkey and human (Table 1.i). On average, chicken, duck and turkey lumens are 37%, 30% and 16% higher than human lumens (Table 1.iii, mean lumens). In addition to this, the CIE photopic lumens are on average 25% less than human lumens. The higher values of these studies probably reflect two contributions; firstly, the higher sensitivities of poultry relative to humans, and secondly, the broader spectral sensitivity, with the additional response from the two short and long wavelength peaks, when compared with the CIE photopic function.
The maximum range across the 14 sources is 31%, 29%, 21% and 27% for turkey, duck, human and chicken, respectively. In addition, these animals have limited sensitivity in the UV and therefore including spectral power below 380 nm shows very small effects. For example, the effect of UV contribution of the three sources, F1, Sa and D65, is to increase the calculated lighting level by no more than 0.3%, 0.1% and 0.7%, respectively, for turkey (Table 2).
Photopic cat and the CIE photopic human
Since the relative overall spectral sensitivities are unknown, each set of data was normalised at 555 nm. The maximum range across the 14 sources is 39% for the photopic cat (Table 1.i). If UV energy from 300 to 380 nm is included there is no increase for the cat since the data indicate that the cat is not sensitive to UV light (Table 2).
Scotopic cat, photopic rat and photopic mouse, and CIE scotopic human
These data were included as a group since they all have a major sensitivity near 505 to 510 nm. Again there is no information on the inter-species sensitivity and therefore we can only comment on the variations across the 14 sources of light. The maximum ranges across the 14 sources were 79%, 81%, 78% and 83% for the cat, rat, mouse and CIE scotopic human, respectively (Table 1.i).
Table 1.iv shows the results for these animals compared with the values obtained for the CIE scotopic function. The maximum ranges decreased to 6%, 11%, 12% and 0%, respectively. The near-tenfold reduction in the percentage lumen ‘errors’ implies that light calculations in the 380 to 780 nm spectral region based on the CIE scotopic function might be sufficiently accurate and more appropriate for these animals than those based on the CIE photopic function.
The cat and CIE scotopic human have zero sensitivity below 380 nm and therefore including UV light has no additional effect. However, for the rat and mouse the calculated values increase by 4% and 2.4% (for F1), 3.9% and 2.4% (for Sa) and 18% and 11% (for D65). Hence it is with D65, the CIE representation of daylight, where the UV contribution could be important (Table 2).
Discussion
Calculation method
The calculation method is generic to any species where spectral sensitivity is known. The calculation of lighting levels, in effect, takes the radiant value of a chosen lamp, such as the spectral power distribution or spectral irradiance, weights this with the spectral sensitivity of the species and thereby converts this to a luminous quantity, such as lamp luminous flux, in lumens, or illuminance, in lux, which falls on a surface. While this luminous quantity is not a direct measure of the subject’s perceived brightness, it is assumed to be on an ordinal scale at least. Hence it is reasonable to assume that if two lumen levels are the same, then the perceived brightness will be the same. If one calculated lumen level is higher, it is reasonable to assume that the perceived brightness will be higher, even though we cannot say by how much. However, there are notable exceptions to this such as the Helmholtz–Kohlrausch effect (Kohlrausch, Reference Kohlrausch1923; Padgham and Saunders, Reference Padgham and Saunders1966; Padgham, Reference Padgham1971), where highly saturated lights are frequently judged to be ‘brighter’ than whites and near-whites of the same calculated luminance.
The constant of proportionality, km, in Equation (1) is in effect determined by the internationally agreed definition of the lumen: the luminous output of monochromatic light at a wavelength close to 555 nm is defined to be 683 lumens/W. Since the standard CIE photopic function is normalised to unity at this same wavelength (at its maximum sensitivity), km takes a value of 683 for standard human photopic calculations. In those rare cases where lighting calculations are made for human scotopic conditions, km will take on a different value, depending on the spectral sensitivity value at 555 nm. By convention, the CIE 1951 scotopic function is normalised to unity at its maximum, which is close to 507 nm and not 555 nm. It then has a value of 0.402 at 555 nm. Hence the scotopic constant of proportionality is 683/0.402 or 1700 (Wyszecki and Stiles, Reference Wyszecki and Stiles1982). However, the difference in these two values of km does not reflect the relative magnitude of the luminous (or perceived brightness) response of the two human systems. They merely reflect the definition of luminous levels and the convention of normalising the two functions at their peak wavelengths. If, instead of normalising the CIE scotopic function to be unity at 507 nm, there was good reason to use another sensitivity value, km (scotopic) would then not be 1700.
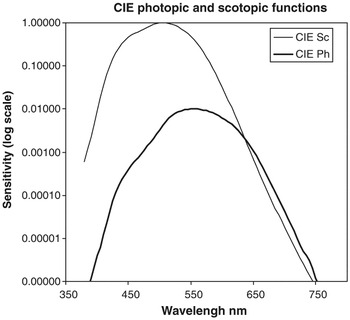
For example, an alternative and useful estimate of the relative photopic and scotopic human spectral responses was obtained by Wald (Reference Wald1945) (see also Boynton, Reference Boynton1979). Wald measured the detection spectral thresholds for 1-degree diameter fields centred on the fovea (where there is a maximum density of cones and very few rods) and also at 8 degrees from the fovea (near the region of maximum density of rods and fewer cones). This showed the sensitivity of the rods to be approximately 100 times greater than the cones at 555 nm. Figure 5 shows the CIE photopic and scotopic functions displaced in this proportion. (It is helpful to plot this on a logarithmic scale since the relatively low sensitivity of the photopic response is hardly seen on a normal plot.) As can be seen in this figure (and in Wald’s original data), the rod thresholds are generally much more sensitive than the cone thresholds except at the long wavelengths where the values are similar.
Logarithmic plot of CIE photopic and scotopic functions displaced by a factor of 100 at their maxima (555 and 510 nm) to match approximately the human data of Wald (Reference Wald1945).

If it was thought worthwhile to develop separate ‘lumen’ levels for the CIE photopic and scotopic systems such that they reflected the correct relative level of the perceived luminous response, it might be considered appropriate to use the data as shown in Figure 5. The km value of the scotopic system would then be much greater than 1700 and the calculated luminous values would be correspondingly higher.
However, there is another factor to take into account, which makes this approach inappropriate in most circumstances. There is strong evidence that the scotopic system saturates, or is blocked, at medium levels of light (Wyszecki and Stiles, Reference Wyszecki and Stiles1982) and the photopic system dominates the visual response. Therefore caution is needed if attempts are made to show the overall response from data based on threshold measurements. If there was no saturation, humans would expect to experience much brighter perceptions in the periphery of the field of view (dominated by rods) compared with central or foveal vision (dominated by cones). This clearly is not the normal experience. In general where there is more than one system operating in parallel, it cannot simply be assumed that the most sensitive one dominates the luminous response.
To summarise, caution is needed in attaching meaning to the value of km: it cannot simply be used as a measure of the overall luminous sensitivity. The value of km would only be an indicator of the overall luminous response compared with the standard human value, for example, in the very exceptional case where the true relative spectral sensitivities are known. The studies of Wald (Reference Wald1945), Prescott and Wathes (Reference Prescott and Wathes1999) and Barber et al. (Reference Barber, Prescott, Jarvis, Le Sueur, Perry and Wathes2006) (Figure 1) are an attempt to satisfy this condition. The spectral sensitivity values at 555 nm (1 : 1.02 : 1.11 : 1.22 for human : turkey : duck : chicken) could be reflected in the km values. However, in general, km allows calculations for lights of different spectral power distributions within a given species and not between species.
Human spectral sensitivity and the calculation of lighting levels
The CIE photopic function has been shown by both experiment and experience to be a useful function for calculating photometric or luminous values for human subjects. Nevertheless, there is an extensive literature that shows many examples of human spectral sensitivity that differ from the simple single-peak bell-shaped CIE photopic function with its maximum sensitivity at 555 nm.
Firstly, it is generally accepted that under very low levels of light (<0.01 cd/m2), rod receptors dominate human vision whereas at moderate levels and above (>1 cd/m2), cone vision dominates; at intermediate levels both systems can contribute (sometimes called mesopic vision) (see Shevell, Reference Shevell2003). The difference in human spectral sensitivity at low and medium to high light levels is demonstrated by the two CIE functions, both bell-shaped but peaking at different wavelengths, at approximately 507 and 555 nm for scotopic and photopic vision, respectively.
Secondly, there are consistent differences between subjects and the CIE photopic function (see for example Figure 3). Extreme examples of this occur for subjects with anomalous colour vision where contributions from certain cones may be absent or different in their spectral sensitivity. Apart from this, ageing effects such as the yellowing of the lens, variations in the density of the macular pigment and minor receptor pigment variations can all affect the spectral sensitivity of a so-called normal human subject (e.g. Wyszecki and Stiles, Reference Wyszecki and Stiles1982; Ronchi and Schanda, Reference Ronchi and Schanda2003; Shevell, Reference Shevell2003).
Thirdly, under certain conditions, the photopic function broadens and can take on two additional peaks in the blue-green and orange region of the spectrum. Examples of this are shown in Figures 1 and 3. Ronchi and Schanda (Reference Ronchi and Schanda2003) have reviewed the results of several studies that show that while certain experimental conditions consistently give data comparable with the CIE photopic function, others repeatedly reveal a broadening of spectral sensitivity. The latter is often associated with less-demanding visual tasks and the additional short wavelength sensitivity is often the more prominent feature.
Therefore, with humans, there is some evidence that the single-peak bell-shaped function is more applicable to tasks demanding high levels of acuity, small fields and/or dark backgrounds, whereas three peaked functions are found for large fields and/or light backgrounds (see Sperling and Harwerth, Reference Sperling and Harwerth1971; Moorhead and Saunders, Reference Moorhead and Saunders1982; Ronchi and Schanda, Reference Ronchi and Schanda2003). In practice, the lighting designer sets out to satisfy the most critical task that the user will come across. Often this involves identifying some level of detail and not just detecting light. It does not matter if this results in more than enough light for the simpler tasks carried out by the user. If tasks containing detail are associated with single-peaked bell-shaped spectral sensitivities rather than broader, three-peaked functions, this may explain why the CIE photopic function, with all its limitations, is in practice so successful and so commonly used.
The data of Figure 3 support the view that for humans the task can determine the type of function measured. Perhaps this occurs with other animals. Poultry, for example, may use a different visual mechanism to recognise individuals or identify food such as grain from that used for the less-demanding task of identifying larger areas of a visual scene. The experimental conditions used by Prescott and Wathes (Reference Prescott and Wathes1999) and Barber et al. (Reference Barber, Prescott, Jarvis, Le Sueur, Perry and Wathes2006) more closely match the simpler detection task. It would be of interest to repeat their experiments where the animals are required to detect or discriminate much finer details. We would expect the extra sensitivity to disappear for the human subjects and perhaps for the avian species.
Hence it is generally accepted that the spectral sensitivity of human subjects varies considerably. Nevertheless, experience shows that lighting calculations based on the CIE photopic function generally work well even at relatively low levels of light where rods are likely to be contributing to the visual response.
Other factors that influence lighting levels for domesticated animals
The main purpose of this study has been to look at the effect of differences in spectral sensitivity on lighting levels for domesticated animals. However, there are other factors that are likely to affect luminous response, including the anatomy of the eye, and physiological and psychological factors. Berkley (Reference Berkley1976) has noted the importance of pupil size, axial length, absorption and reflection of the media when comparing the overall luminous sensitivity of the cat and human.
Retinal illuminance, pupil area and axial length of the eye
Retinal illuminance is a measure of the light falling on each receptor and hence determines the light absorbed by individual rod and cone receptors. It is reasonable to assume that this is a major factor in determining the subject’s luminous response and the perceived brightness of scenes and objects. Retinal illuminance clearly increases with the level of light from the external object but it also increases with the area of the pupil and with the inverse of the square of the axial dimension of the eye (Le Grand, Reference Le Grand1968; Wyszecki and Stiles, Reference Wyszecki and Stiles1982).
The human pupil diameter can vary from approximately 2 to 8 mm and the size is dependent on many factors including the level of light on the retina and psychological stimuli. For example, a change in pupil diameter from 4 to 5 mm will not be uncommon and this produces an increase in pupil area of 1.55 and hence the retinal illuminance of just over 50%. Hence, common variations in pupil size can produce effects of similar magnitude to those shown above due to variations in spectral sensitivity. Measurements of the axial length of the human eye have revealed significant variations of 10% or more between subjects. These could lead to variations of approximately 20% in retinal illuminance, which are again similar in magnitude to the luminous effects shown above. Long-term age effects that include the yellowing of the lens can reduce retinal illuminance by up to 50% or more (Wyszecki and Stiles, Reference Wyszecki and Stiles1982; Shevell, Reference Shevell2003) at the shorter wavelengths.
Hence, variations in retinal illuminance, which are everyday occurrences for human subjects, are similar in magnitude to the variations shown in our calculations for different species using the 14 chosen light sources. In some animals the effects are much greater. For example, Jarvis et al. (Reference Jarvis, Prescott and Wathes2003) have shown that for a given lighting level, the retinal illuminance in chicken can be 10 times greater than for human. This could partly explain the difference between the human and poultry data of Figure 1.
Receptor density and neural connections
It might be expected that a higher density of receptors will provide a bigger luminous response for a given level of light. However, this will be balanced by the smaller cross-section of the more closely packed receptors, which will receive fewer quanta. Receptors, and later neurons, in the visual pathway exhibit many interconnections, which affect the light-gathering effectiveness of different regions of the retina and these could greatly influence the perceived effect of any given lighting level. Mechanisms are likely to vary between species but assessing the magnitude of any such effects would be complex and outside the aims of this study. Nevertheless it is worth noting that differences between species’ sensitivity are likely to occur.
Other psychological and physiological factors
There are a number of psychological factors that could affect estimates of luminous response.
Firstly, we cannot assume that each species is equally motivated by any given visual task. It is possible that the human subjects of Figure 1 made decisions when they just felt that the field could just be seen. A different species may require a greater level of confidence (a higher level of luminance), or vice versa, before acting. Hence a lower measured threshold does not necessarily indicate a higher visual sensitivity.
Secondly, most of the measurements of spectral sensitivity are based on threshold sensitivities and we cannot assume that these produce the same relative effect at levels above threshold or that it is the same for all species.
Thirdly, we cannot assume that that the broader three peaked curves are simple enhancements at the short and long wavelengths with no change at the middle wavelengths. Similarly, we cannot assume that the principle of additivity incorporated in Equation (1) holds as well with these functions as it does with the CIE photopic function.
Fourthly, while the effects of lighting on behaviour and welfare are mediated predominantly by vision, other non-visual photoreceptors such as the pineal gland and hypothalamus may be physiologically important for some avian species, where they control circadian rhythms and seasonal reproduction (Oishi et al., Reference Oishi, Yamao, Kondo, Haida, Masuda and Tamotsu2001). Our assessment of lighting levels does not take this mechanism into account.
Finally, integration of light over a range of wavelengths to give a single, composite index does not allow for the possibility that certain wavelengths may contain information that is essential for specific behaviours. For example, chickens are thought to use the redness of the comb and wattles to indicate social dominance, while their sensitivity to UV radiation may allow them to identify certain food stuffs, such as berries or seeds that reflect UV (Prescott and Wathes, Reference Prescott and Wathes1999). Also a recent study of the pupil reflex in the chicken has shown that red is a highly significant colour for this species (Barbur et al., Reference Barbur, Prescott, Douglas, Jarvis and Wathes2002). Thus while an integrated measure may apparently indicate that the level of lighting is sufficient in general, in practice it could be inadequate for particular tasks.
Adaptation to light level
Humans, like other species, are very adaptable to changes in light levels (Wyszecki and Stiles, Reference Wyszecki and Stiles1982; Hunt, Reference Hunt1998; Shevell, Reference Shevell2003). On a typical summer day, daylight could supply lighting levels varying from 500 lux in the early morning up to 35 000 lux at mid-day. Humans adapt to these large changes within seconds and common objects such as faces, newspapers and other surfaces appear to have approximately the same brightness under daylight whatever the time of day or season. While at very low levels, acuity and consequently visual performance may suffer and at high levels glare may distract or cause discomfort with another loss of performance, there is a large range of light levels where performance remains fairly constant. For example, in most conditions a 30% change in lighting level for all objects in the field of view would be hardly noticeable. This would not apply if a single object in the field of view was enhanced with respect to other objects, but in most lighting situations the source has the same relative effect on the illumination level of all objects in the immediate visual scene.
Conversely, for some agricultural species, such as poultry, there can be a narrow range of lighting levels within which the particular species may be maintained. While the recommended minimum illuminance for normal husbandry of laying hens is 10 lux, a dimmer illuminance of 1 or 2 lux may be necessary to control certain adverse behaviours, e.g. injurious pecking (Prescott et al., Reference Prescott, Wathes and Jarvis2003). The explanation for this response to dim illuminance is not clear. This could be caused by a shift from photopic vision. In humans photopic vision starts at levels at least 100 times below this, although there is a range (called mesopic vision) where both scotopic vision and vision is available to the subject. Studies by Loop et al. (Reference Loop, Millican and Thomas1987) on cats and by Nuboer and Moed (Reference Nuboer and Moed1983) on rabbits showed that these animals may use scotopic and photopic vision at different levels from humans although again there is likely to be a mesopic range where the nocturnal/diurnal transition is a continuum rather than an abrupt change. Another perhaps more likely explanation is that it is the loss of acuity as luminance is reduced that interferes with social signalling.
The contribution of other lighting parameters
The luminance (cd/m2), luminous flux (lumens) and illuminance (lux) are often the most important parameters in lighting design and we have concentrated on these in this study. However, for human users, there are other parameters that must be considered in order to provide good lighting design (CIBSE, 2006) and these may also be important for visual performance, preference and welfare of other species. For example, a monochromatic light source of 555 nm would produce the most effective use of energy in terms of perceived luminances but this would make any colour-related judgements impossible. Hence, the nearly monochromatic (589 nm) low-pressure sodium lamp has been successfully used for street lighting but only when colour judgements and colour preferences are of low priority. Good lighting design aims to include the positive effects of using lamps, which produce good colour rendering and colour appearance, and avoid the negative effects of lamp and fitting glare. For many tasks there are also preferences for certain luminous contrasts of objects and surrounding areas, for ‘warm (yellowish)’ or cool (bluish) lighting, for lighting that reveals the three-dimensional nature of objects and for a contribution of daylight where artificial lighting predominates. In the human example, the lighting designer attempts to balance the contributions of many such factors (CIBSE, 2006) and where conflicts arise the designer has to prioritise these to match the demands of the user’s performance, preference and welfare. The relative importance of each factor may be species dependent. Therefore we should not simply assume the animal’s spectral sensitivity and its effect on the lighting levels is always the most important factor.
Significance of species-specific differences in spectral sensitivity
There are a number of factors that determine the optimum lighting level for animals. The error due to incorrect light measurement due to departures in spectral sensitivity from the CIE standard is only one of these and often its effect is relatively minor, except in certain specialised circumstances described below.
We have used comparative data from various domesticated animals to determine the effect of spectral sensitivity on overall luminous response. Our main analysis has centred on the differences or ‘lumen errors’, in light measurements based on the standard CIE photopic function, and how this results in different ‘lumen’ values for various light sources. We suggest that it is useful to consider two main categories of difference, expressed in terms of the maximum range (Table 1). Differences of up to 30% are either of no importance in most applications or will sometimes be noticed but with a period of adaptation will rarely cause problems. Conversely, differences over 30% may be a cause for concern. A third category is needed for animals that are sensitive to UV and where there is UV radiation in the light source (Table 2). These categories are by no means hard and fast. On this basis, very few domesticated animals fall in the second category.
It is worth noting that the recommended levels in codes of lighting practice (e.g. CIBSE, 2006) follow a sequence such as 20, 30, 50, 75, 100, 150, 200, 300, 500, 750, 1000, 1500, 2000, 3000 and 5000 lux for different types of task, i.e. with intervals approximating to 30% to 50%. Intervals smaller than 30% are not considered to have important effects. This is consistent with our approach.
For chicken, turkey and duck, there is just one example out of 56 light sources which is outside the first category: changing from an F12 fluorescent lamp to daylight, the lamp ‘lumens’ increase by 31% for turkey (Table 1.i). If the data are compared with the human data of that study, rather than the CIE photopic standard observer, this maximum range is reduced from 31% to 21% (Table 1.iii).
An important example falling in the second category is where animals have a peak sensitivity away from the green part of the spectrum (centred on 555 nm). Examples include the CIE scotopic human function, the scotopic cat, the photopic rat and the photopic mouse. Compared with the CIE photopic function, the relative levels across light sources vary from 0.60 to 1.44 (Table 1.ii). The maximum effects of changing a lamp (the maximum range) are 79% to 83% with approximately half of the ‘lumen’ values falling outside the 30% range. However, these animals all have peak sensitivities near 510 nm and show far less variation when compared with calculations based on the CIE scotopic function (Table 1.iv). The relative levels then range from 0.97 (light Sa, photopic rat) to 1.09 (light F4, photopic mouse). The maximum ranges of 6%, 11%, 12% and 0% for cat, rat, mouse and CIE scotopic human, respectively, are now well within the 30% level and none of the individual lumen variations are a cause for concern (Table 1.iv). A solution for groups of animals, which include those with peak sensitivity near 500 nm, may be to compute levels based on both CIE photopic and CIE scotopic functions and then choose the more appropriate depending on the individual species’ spectral sensitivity.
A third important example is where a species is sensitive to UV light and is operating in daylight or with another light source with a significant UV component. Two examples here are photopic rat and photopic mouse where differences of 18% and 11% were shown for daylight calculations. ((Table 2); these are in addition to the differences for the 380 to 780-nm region shown in Table 1.) This is not unexpected since the CIE photopic curve does not extend to this region. There is clearly a case where the source extends to the UV, for using more appropriate spectral sensitivity functions or photometers, which take into account UV sensitivity. Our calculations on the level of changes found for non-UV sources suggest that this correction does not require a great order of accuracy. Perhaps a single measure related to the sensitivity near 360 nm would suffice.
A fourth example is the situation where the spectral sensitivity is broader and multiple peaked, as with the poultry examples. The result of this is apparently to increase the ‘lumen’ output. There may then be a temptation to suggest that lower levels of light could be used. However, the information in the case of humans strongly suggests that this is only correct for simple tasks and that when the task is more critical a narrower single-peak spectral sensitivity is appropriate. If this also occurs with other species, the advice must be to design the lighting for the critical task. The result is that there will be more than enough light for other tasks but this is not a problem.
In summary, there is not a case for species-specific photometry based on spectral sensitivity. However, lighting assessment for domesticated animals should be based on two primary classifications using the CIE photopic and scotopic systems, plus an additional UV correction when this is appropriate for a particular species. If this was done, there would be few errors in the measurement or specification of light for domesticated animals.
Acknowledgement
This work was funded in part by a grant from the Biotechnology and Biological Sciences Research Council.