Implications
In our study, we investigated for the first time the effects of a moderate water restriction on water and feed intake as well as some physiological variables in German black-head mutton sheep and Boer goats under temperate environmental conditions using the isotope dilution technique. The results of the present investigation confirm and extend previous reports on the capability of sheep and goats to withstand water shortages. This tolerance to water restriction allows them to maximize the use of pastures as animals could graze and browse at long distances from the watering points.
Introduction
In arid environments, ranging animals have to walk long distances in search of food and water, and are usually faced with low nutritive value feeds and water scarcity. Thus, these animals have developed various behavioural, morphological and physiological adaptation mechanisms to enable them to survive, and in particular, to tolerate dehydration (Kay, Reference Kay1997; Atti et al., Reference Atti, Bocquier, Theriez, Khaldi and Kayouli2000; Alamer and Al-hozab, Reference Alamer and Al-Hozab2004; Hamadeh et al., Reference Hamadeh, Rawda, Jaber, Habre, Said and Barbour2006). Compared with most other mammals, where losses of water over 15% of body mass can be fatal (Shkolnik et al., Reference Shkolnik, Maltz and Choshniak1980), ruminants are able to tolerate water losses of up to 18%, 20%, 25% and more than 40% of their body mass as reported for cattle, sheep, camels and Bedouin goats, respectively (Shkolnik et al., Reference Shkolnik, Maltz and Choshniak1980). This greater tolerance to water loss is mainly attributed to the rumen acting as a water reservoir (Silanikove, Reference Silanikove2000).
The amount of water that animals can drink during one visit to a watering point varies according to the degree of dehydration, time allowed drinking and stocking density at the watering point (King, Reference King1983). Therefore, most mammals can be divided into those that replenish lost water rapidly and those that do so gradually (Adolph, Reference Adolph1982). Silanikove (Reference Silanikove1989) reported that upon rehydration, ruminants such as cattle, sheep, camels and goats can drink an equivalent of up to 18% to 40% of their body mass, within 3 to 10 min. In general, ruminants can replace 15% to 20% of their body mass at the first drinking and 20% to 25% within 1 to 1.5 h (King, Reference King1983).
Reports on the effect of water restriction on sheep and goats are mostly based on indoor experiments, due to the difficulty in measuring individual water intake (WI) under free-ranging conditions. In this context, the isotope dilution technique provides a suitable method for estimating individual water flux under free-ranging conditions. To the authors’ knowledge, there have been no previous comparative studies on the capabilities of goats and sheep to endure water shortage using the deuterium (D2O) dilution technique as a method for estimating the amount of WI. Therefore, the aim of our study was to investigate the effects of a moderate water restriction on water and feed intake in German black-head mutton sheep and Boer goats under temperate environmental conditions. We also tested whether the isotope dilution technique (using D2O) is a suitable method to estimate individual WI under water restriction compared with direct measurement (re-weighing water buckets). In addition, drinking behaviour was recorded to investigate the behavioural response to water shortage.
Material and methods
Animals and management
In two consecutive trails, 20 non-lactating females (10 German black-head mutton sheep and 10 Boer goats) of average age 1.8 ± 0.1 years (sheep) and 4.3 ± 0.5 years (goats) were used. Animals were kept under temperate conditions in individual pens (1.5 × 2.0 m) on straw at the Department of Animal Sciences, University of Goettingen, Germany. Temperatures and relative humidity averaged 12.7 ± 1.2°C and 75.3 ± 4.6% or 8.9 ± 2.8 °C and 71.0 ± 4.2% in the sheep and goat stables, respectively (mean ± s.d.). Each pen was equipped with an individual feed through and water bucket and the light schedule was maintained constant at 16 L : 8 D, with lights on at 0500 h and lights off at 2100 h.
Animals of both species were randomly allocated to two treatment and two control groups of five animals each. In the two control groups (n = 5 for each species), water was offered ad libitum (24 h/day) throughout the experimental period. In the two treatment groups (n = 5 for each species), water was restricted and subdivided into three experimental periods: in period 1 (experimental days 1 to 7), animals were adapted to the water restriction regime by limiting access to water gradually from 15 to 3 h per day. During the second period of the experiment (experimental days 8 to 14), animals of the treatment groups had access to water for 3 h/day. In the final period of the experiment (experimental days 15 to 22), animals had access to water only every second day for 6 h.
WI studies
Water drunk (WD) by individuals was recorded daily (24 h) by weighing and re-weighing water buckets (10 l) before and after water administration. Water refusals were discarded and the buckets were refilled after cleaning. Corrections for water evaporation were made by placing a separate bucket (10 l) containing water in an adjacent area to measure the amount of water lost by evaporation. The actual amount of water consumed by the animals was calculated by subtracting the evaporated amount from the total WI (TWI).
The TWI includes preformed and metabolic water from food and drinking water. Metabolic water was calculated from the feed composition. It was assumed that 1 g of metabolized carbohydrates, fat and protein yields 0.56, 1.07 and 0.42 g of water, respectively (Maynard et al., Reference Maynard, Loosli, Hintz and Warner1981). Measured TWI was calculated as TWI = WD + metabolic water + preformed water.
WI was also estimated from water kinetics for 2 consecutive weeks using the D2O dilution technique in both the control and the treatment groups. On experimental day 8, before the isotope administration, a 5 ml blood sample was taken from the jugular vein into blood tubes containing sodium citrate to determine the background level of D2O. Immediately, a dose of approximately 200 mg D2O/kg body mass of 99.90% purity (Euriso – top GmbH, Saarbruecken, Germany) was injected intramuscularly at the M. semitendinosus. The actual dose given was measured gravimetrically by weighing the syringe before and after the administration of D2O to the nearest 0.001 g (Sartorius model CW3P1-150IG-1, Sartorius AG, Goettingen, Germany). Blood samples (∼5 ml) were collected at 1200 and 2400 h and 2, 4, 7, 9, 11 and 14 days after the application of D2O. The samples were then centrifuged within 30 min of collection at 3500 r.p.m. for 10 min. The plasma fraction was pipetted into glass vials and frozen at −20°C until analysis.
Earlier work showed that tracer concentrations in plasma samples are the same as in vacuum-sublimated water samples (Riek et al., Reference Riek, Gerken and Moors2007). Therefore, plasma samples from sheep and goats were analysed for D2O concentrations. Analyses were carried out at the Competence Centre of Stable Isotopes (KOSI, Goettingen University, Germany). Isotope ratios of 2H were measured using an online high-temperature reduction technique in a helium carrier gas described previously (Gehre et al., Reference Gehre, Geilmann, Richter, Werner and Brand2004) and expressed relative to the Vienna Standard Mean Ocean Water, which is the international reference standard for D2O. Individual samples were measured in triplicate and the averages were calculated. Total body water (TBW) and TWI were estimated from water kinetics according to established formulas described in detail elsewhere (Al-Ramamneh et al., Reference Al-Ramamneh, Riek and Gerken2010).
Rye grass hay with an average dry matter content of 85.7 ± 1.2% was offered ad libitum daily at 1000 h; thereafter, feed was supplied when the feed buckets were found nearly empty and the remaining feed was measured to determine individual daily feed consumption.
Physiological reactions
Respiratory rate was measured daily by counting the rate of flank movement for 1 min between 1500 and 1530 h. Rectal temperature was measured to the nearest 0.1°C once a week between 1300 and 1400 h. Individual body mass was recorded to the nearest 10 g at weekly intervals.
Drinking behaviour
Drinking behaviour (duration and frequency) for each animal was observed during experimental periods 2 and 3 (Table 1) every 2 to 3 days using a time-lapse (8-fold) video recording system for 24 h. Infrared lights were used to facilitate data recording during the night. Periods from 0501 to 2100 h and from 2101 to 0500 h were considered as daytime and nighttime, respectively. For each animal, two recordings per period were available (a total of four observations per animal) and analysed using the Interact® 8.0 system (Mangold International GmbH, Arnstorf, Germany). During period 3, recordings were only made on days when water was available. Drinking behaviour was defined as follows: drinking frequency (number of drinking bouts) and drinking duration (time in minutes when the animal was actively engaged in the ingestion and swallowing of water).
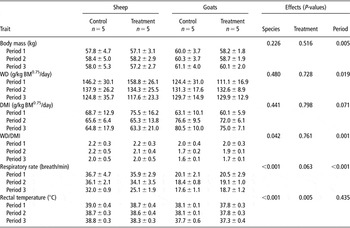
Average body mass, WD, DMI, WD/DMI ratio, respiratory rate and rectal temperature in German black-head mutton sheep and Boer goats

WD = water drunk; DMI = dry matter intake.
Values are given as means ± s.d. for the control (water ad libitum) and the treatment groups at experimental periods 1 (adaptation period), 2 (water available 3 h/day) and 3 (water available 6 h/2 days; see text for details).
For simplicity, only P-values for the main effects are given.
Statistical analysis
Data on WI recorded in the treatment groups during period 3 were averaged across the entire period of 7 days. In addition, for the same period, the average WI was also computed for the 4 days with water availability only. Behavioural data were averaged for 2 recording days per period.
Analysis of variance was performed based on averages per animal using the PROC MIXED procedure of the software package Statistical Analysis System version 9.01 (SAS Institute, 2001). For all traits, with the exception of those related to the D2O dilution technique, the model included the fixed effect of species, treatment, the experimental period, their interactions and the random effect of animals. Model (1) was

where Yijklm is the observation value; μ the overall mean; Si the species; Tj the treatment; Pk the experimental period; A l the random effect of animals; and eijklm the random error.
Data related to D2O dilution were analysed with the PROC GLM procedure using the following model (2):

where Yijk is the observation value; μ the overall mean; Si the species; Tj the treatment; and eijk the random error. All values were presented as means ± s.d. The significance level was set at P < 0.05.
We are aware of the statistical and biological difficulties of a two-species approach and therefore followed suggestions to minimize these shortcomings outlined in detail in Garland and Adolph (Reference Garland and Adolph1994).
The research conducted in this study was performed in accordance with the guidelines established by the German Animal Welfare Act.
Results
Feed and WI
No significant species differences were found across the entire experiment for WD or dry matter intake (DMI; Table 1). However, when expressed as ratio WI/DMI, significantly higher values were found for sheep than for goats. When calculated across each experimental day per period, treatment effects were not significant for water and DMI or WI/DMI (Table 1). However, for period 3, when animals received water only for 6 h every second day, WD on watering days was nearly doubled and averaged 235.2 ± 13.9 and 259.8 ± 81.2 g/day/BM0.75 (P = 0.574) and 4.1 ± 0.3 and 3.4 ± 0.5 g/DMI in sheep and goats (P = 0.052), respectively (data not shown).
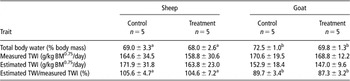
The absence of clear differences between species in their WIs was also confirmed using the D2O dilution method in estimating TWI in both species (Table 2). The TBW content expressed as percentage of body mass estimated by D2O dilution ranged between 65.0% and 74.0% in sheep and 68.5% and 73.5% in goats, with significantly (P = 0.018) higher mean values in goats than in sheep in both the control and the treatment groups (Table 2). No significant treatment effects were found for WIs estimated using the D2O dilution method. The TBW showed a tendency to decrease in the treatment group in both species (P = 0.093).
Average total body water, TWI measured by weighing water buckets or estimated using the deuterium dilution technique in German black-head mutton sheep and Boer goats (means ± s.d.)

TWI = total water intake.
a,bMeans in a row with different superscript letters differ significantly (P < 0.05).
The differences between estimated (by D2O) and measured TWI (by re-weighing water buckets) were moderate, ranging between −4.9% and +11.4% in sheep and −15.8% and −7% in goats, respectively, with significantly lower mean values in goats than in sheep (P < 0.001). Measurement methods of total TWI using D2O dilution or re-weighing water buckets did not differ significantly in both species (P = 0.364).
Physiological reactions
Body mass was not significantly influenced by the species or the water regime (Table 1). However, body mass increased during the second and third experimental periods (P = 0.005) compared with the adaptation period.
Sheep had significantly (P < 0.001) higher respiratory rates and rectal temperatures than goats in both the control and the treatment groups (Table 1). When exposed to water restriction (periods 2 and 3), sheep showed a decrease in respiratory rates whereas goats tended to show an increase, resulting in a significant species × treatment interaction (P = 0.004). Under the water restriction treatment, rectal temperatures were reduced in both species (Table 1).
Drinking behaviour
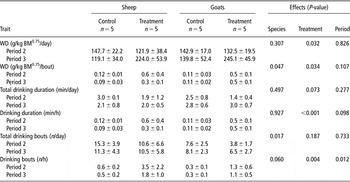
Control animals in both species spent approximately 0.2% of the 24 h day drinking (2.6 ± 0.7 and 2.7 ± 0.7 min/day for control sheep and goats, respectively). Sheep visited water buckets more often than goats (P = 0.017) during the experimental periods 2 and 3 (Table 3). When time to water access was limited, animals showed an increase in the frequency of drinking bouts and the time spent drinking during the hours of water availability; in addition, more water was consumed per minute of drinking. Goats consumed significantly more water per drinking bout than sheep (P = 0.047). Most of the daily WI was observed during the daytime in both species. Consequently, nocturnal drinking behaviour (i.e. between 2100 and 0500 h) accounted for only a small percentage of daily drinking frequency (4.0% and 3.8%) and duration (2.2% and 3.0%) in control goats and sheep, respectively. Higher drinking frequency was associated with feeding times at 1000 and 1600 h for both control groups (sheep and goats). Control sheep tended to ingest water earlier than goats after light onset. After 42 h of water withdrawal (period 3), the drinking patterns were similar for both species and most of the drinking activity occurred within the first 2 h after water availability (63% and 67% in goats and sheep, respectively).
WD, drinking behaviour (total frequency and duration), water intake per drinking bout and duration in German black-head mutton sheep and Boer goats during the experimental periods for the control (water ad libitum) and the treatment groups with water available for 3 h/day (period 2) or 6 h/2 days (period 3) based on 24-h video recordings (means ± s.d.)Footnote 1

WD = water drunk.
For simplicity, only P-values for the main effects are given.
1 Only concurrent water intake values on video recording days were included, based on 24-h video recordings (average of 2 records/animal; water was available for 24 h/day for the control group and for 3 h/day and 6 h/2 day for the treatment groups during periods 2 and 3, respectively).
Discussion
Water deprivation in our study did not induce major changes in WI, DMI and body mass in both species. This small impact of water restriction found in our study may be mainly attributed to the temperate environmental conditions prevailing during the experiment. It is not surprising, therefore, that desert-adapted breeds such as Awassi ewes can withstand a once per 2-day watering regime under semi-arid conditions, with little physiological disturbances (Jaber et al., Reference Jaber, Habre, Rawda, Said, Barbour and Hamadeh2004). However, in our study, we used a temperate-adapted sheep breed, showing similar capabilities to withstand water shortages, indicating a higher degree of tolerance towards water restriction than so far assumed for this breed.
Several water restriction studies pointed out that the body mass loss in ruminants associated with a reduction in water and feed intake is considerably influenced by environmental temperatures and body water loss (Silanikove, Reference Silanikove1992; Alamer, Reference Alamer2006 and Reference Alamer2009). Shkolnik et al. (Reference Shkolnik, Maltz and Choshniak1980) found that during 4 days of water deprivation, black Bedouin goats lost 25% to 30% of their body mass. The TBW was found to be reduced from 76% to 69%, whereas the animals continued to eat normally under arid desert conditions. Under the present water restriction regime and temperate climatic conditions, the TBW of sheep and goats was not significantly reduced, indicating that animals were able to adjust to the water deficit. Similarly, Freudenberger and Hume (Reference Freudenberger and Hume1993) found no effect of water deprivation (50% of the main daily intake) on TBW in feral goats kept under semi-arid conditions. Water restriction also had no effect on feed intake and body mass in our study, which is in agreement with the results obtained under different environmental conditions (Brosh et al., Reference Brosh, Shkolnik and Choshniak1986; Hadjigeorgiou et al., Reference Hadjigeorgiou, Dardamani, Goulas and Zervas2000; Misra and Singh, Reference Misra and Singh2002) in adult goats and sheep.
When animals are faced with water shortage, they activate several water-saving mechanisms to minimize water losses and maintain essential physiological systems unimpaired (Silanikove, Reference Silanikove2000). Increasing the watering interval (from 24 to 72 h) has been reported to significantly reduce rectal temperatures in Sudanese desert sheep (Abdelatif and Ahmed, Reference Abdelatif and Ahmed1994). In the present study, rectal temperatures were also significantly reduced in water-restricted sheep and goats. This observation may indicate a decrease in endogenous metabolic heat production to reduce water requirements for evaporative cooling (Degen, Reference Degen1977; Ismail et al., Reference Ismail, Hassan, Abo-Elezz and Abd El-latif1996), as it is known that water restriction induces a decrease in the metabolic rate, indicating a water conservation mechanism (Choshniak et al., Reference Choshniak, Benkohav, Taylor, Robertshaw, Barnes, Dobson, Belkin and Shkolnik1995). However, Mengistu et al. (Reference Mengistu, Dahlborn and Olsson2007) reported higher rectal temperatures in Ethiopian goats that were watered every fourth day. Therefore, it is not clear whether the increase or the decrease of rectal temperature indicates an adaptation towards water metabolism or other metabolic parameters.
Our observation of drinking behaviour in sheep and goats revealed interesting differences in the behavioural strategies between both species. Under water restriction, goats were able to increase their WI per drinking bout to about 0.9 ± 0.5 l/bout compared with 0.5 ± 0.4 l/bout in sheep, whereas the amount of WI per minute drinking was identical in both goats and sheep (2.0 ± 0.5 v. 2.0 ± 0.6 l/min). The higher frequency of drinking events in sheep may be related to their evaporative cooling mechanisms, because sheep panted more frequently than goats. It is suggested that sheep require more water to regulate their body temperature due to their longer fleece, which increases their endogenous heat production. In this context, it is of interest to note that the TBW and the ratio between estimated and measured TWI was significantly different between goats and sheep, which is in accordance with the results found earlier (Al-Ramamneh et al., Reference Al-Ramamneh, Riek and Gerken2010).
The loss of stable isotopes in faeces particularly in ruminants and the possible influences of high roughage content in the rumen on the isotope equilibration due to high faecal production have been discussed (Midwood et al., Reference Midwood, Haggarty and Mcgaw1993). However, our results on WI, both measured (by re-weighing water buckets) and estimated (using the isotope dilution method), suggest that the isotope dilution method provides a viable method to estimate TWI in German black-head mutton sheep and Boer goats under temperate-controlled conditions, which is in accordance with previous results (Al-Ramamneh et al., Reference Al-Ramamneh, Riek and Gerken2010). The higher TBW found in Boar goats compared with sheep suggests that they may have developed different physiological responses to adapt to water shortages and heat stress, which could be a crucial factor for survival under these harsh environmental conditions.
In conclusion, comparison of sheep and goats under temperate conditions revealed some remarkable differences. Sheep had higher rectal temperatures, WI/DMI ratios and respiratory rates, and a lower TBW content than goats. It remains unclear as to whether these characteristics indicate underlying species differences in the endogenous metabolism. In particular, the woolly hair coat of sheep in contrast to the skin morphology of goats may play an important role in the better adaptability of the latter to water scarcity. Furthermore, our ethological studies underline that behaviour offers a most effective tool for short-term adaptations of the animals to water restriction, indicated by the ability of goats to drink more water per bout than sheep.
Acknowledgements
The authors wish to thank J. Dörl for technical assistance and J. Langel for stable isotope analysis. This research was funded by the German Academic Exchange Service (DAAD).