Introduction
The family Naticidae Guilding, Reference Guilding1834 comprises a group of both extinct and extant marine carnivorous gastropods (Marincovich Reference Marincovich1977; Majima Reference Majima1989; Kabat Reference Kabat1991; Bandel Reference Bandel1999). Although naticids have been identified from as early as the Jurassic (Das et al. Reference Das, Mondal, Saha, Bardhan and Saha2019), they become more prominent in the fossil record only from the Cretaceous onward (Bandel Reference Bandel1999). From the Cenozoic onward, naticids increased in diversity, becoming one of the most abundant marine macroinvertebrate groups globally (Majima Reference Majima1989; Kabat Reference Kabat1996; Paleobiology Database: https://paleobiodb.org). Currently, around 1500–2700 species, including 260–270 Recent species, have been described worldwide (Majima Reference Majima1989; Kabat Reference Kabat1996; Hülsken et al. Reference Hülsken, Marek, Schreiber, Schmidt and Hollmann2008). Apart from their taxonomic prominence, naticid gastropods are also ecologically diverse and inhabit diverse habitats ranging from estuaries to intertidal settings to the deep sea (Marincovich Reference Marincovich1977; Subba Rao et al. Reference Subba Rao, Dey and Barua1992).
Naticid gastropods are also important in terms of their ecological and evolutionary roles as predators (see Kelley and Hansen Reference Kelley, Hansen, Allmon and Bottjer2001): naticid gastropods are one of the most formidable predators of mollusks through space and time, resulting in significant mortalities in their prey (Vermeij Reference Vermeij1987; Kelley and Hansen Reference Kelley, Hansen, Kelley, Kowalewski and Hansen2003). This predator–prey interactive system is geologically ancient and can be studied in detail by looking at the fossil record of drilling predation, thereby allowing workers to use this to test two potential hypotheses—coevolution and escalation—between naticids and their prey (Vermeij Reference Vermeij1987; Dietl and Kelley Reference Dietl and Kelley2002; Klompmaker et al. Reference Klompmaker, Kowalewski, Huntley and Finnegan2017). General studies on this ecological interaction have identified many large-scale patterns, with latitudinal as well as temporal rise in drilling predation being the most significant (Kowalewski et al. Reference Kowalewski, Dulai and Fürsich1998; Kelley and Hansen Reference Kelley and Hansen2006; Huntley and Kowalewski Reference Huntley and Kowalewski2007; Mondal et al. Reference Mondal, Goswami and Bardhan2017, Reference Mondal, Chakraborty and Paul2019). However, despite the spatiotemporal abundance and ecological importance of naticid gastropods, the nature of the temporal evolution of this ecological interaction is sometimes difficult to identify and analyze, because the taxonomic status of both extinct and extant members of this family are fraught with uncertainty.
There is a vast amount of literature, spanning several decades, dedicated to the systematics and classification of naticid gastropods. Kabat's (Reference Kabat1990, Reference Kabat1991) reviews on the supraspecific classification of the family Naticidae summarizes all major monograph studies on naticid classification (see also Hülsken Reference Hülsken2008). The family was first subdivided into three subfamilies—Naticinae Forbes, Reference Forbes1838; Polinicinae Finlay and Marwick, Reference Finlay and Marwick1937; and the monogeneric Globisininae Powell, Reference Powell1933, by Finlay and Marwick (Reference Finlay and Marwick1937). Later, Bandel (Reference Bandel1999) redefined the two subfamilies—Naticinae (calcareous operculum) and Polinicinae (corneous operculum)—primarily based on operculum chemistry. In addition to that, he also included the subfamily Sininae Woodring, Reference Woodring1928 (having spiral ornamentation and corneous operculum smaller than the aperture) within the family Naticidae. Several authors have also included another subfamily, Gyrodinae Wenz, Reference Wenz and Schindewolf1941 (with subsutural ribbons at the top of the whorl), within the family Naticidae (Sohl Reference Sohl1960; Popenoe et al. Reference Popenoe, Saul and Susuki1987; Bandel Reference Bandel1999; Bandel and Dockery Reference Bandel and Dockery2012; Das et al. Reference Das, Mondal, Saha, Bardhan and Saha2019), although this inclusion remains questionable (Marincovich Reference Marincovich1977; Kase and Ishikawa Reference Kase and Ishikawa2003). The subfamily Globisininae was included within Naticidae based on radular characters (Powell Reference Powell1933). Aside from these, two subfamilies—Ampullellinae Ponder and Warén, Reference Ponder, Warén and Ponder1988 and Ampullospirinae Cox, Reference Cox1930—were also considered within the family Naticidae based on their overall morphological and stratigraphic similarities (Marincovich Reference Marincovich1977; Ponder and Warén Reference Ponder, Warén and Ponder1988; Majima Reference Majima1989); however, Bandel (Reference Bandel1999) regarded them as sister taxa to naticids.
The primary reason for this taxonomic problem of improper identification of naticids arises from the fact that naticid gastropods are morphologically nondescript (see Das et al. Reference Das, Mondal, Saha, Bardhan and Saha2019). The characters commonly used for distinguishing among different naticid subfamilies and its sister taxa are: composition and the surface structure of the operculum (Kilburn Reference Kilburn1976; Marincovich Reference Marincovich1977; Majima Reference Majima1989; but see Powell Reference Powell1933; Dell Reference Dell1990; Bandel Reference Bandel2000); the umbilical area, particularly the funicle (Majima Reference Majima1989; Hülsken Reference Hülsken2008); the protoconch (Bandel Reference Bandel1999); apertural shape (Marincovich Reference Marincovich1977; Majima Reference Majima1989); and the general shell morphology (such as shell globosity) (Hülsken et al. Reference Hülsken, Marek, Schreiber, Schmidt and Hollmann2008). Even after considering these morphological characters, confusion arises while designating the “excellent” and “usable” characters (sensu Raup and Stanley Reference Raup and Stanley1978: p. 139), and thus a challenge remains in classifying the naticid gastropods (see Das et al. Reference Das, Mondal, Saha, Bardhan and Saha2019). Also, several characters such as the protoconch, umbilicus, and shell form can show a high degree of homoplasy, further complicating taxonomic classification (Hülsken et al. Reference Hülsken, Tapken, Dahlmann, Wägele, Riginos and Hollmann2012). To counteract problems related to convergent shell characteristics, some authors have suggested the use of soft part anatomy (Aronowsky Reference Aronowsky2003) and molecular coding (Hülsken et al. Reference Hülsken, Clemmensen and Hollmann2006, Reference Hülsken, Marek, Schreiber, Schmidt and Hollmann2008, Reference Hülsken, Tapken, Dahlmann, Wägele, Riginos and Hollmann2012). However, soft parts are not preserved in the fossil record, and thus their use is limited to extant taxa only (for a similar argument, see Das et al. Reference Das, Mondal, Saha, Bardhan and Saha2019).
Das et al. (Reference Das, Mondal, Saha, Bardhan and Saha2019) suggested a few subfamily-based hard part characters that can be used to distinguish among the four subfamilies—Naticinae, Polinicinae, Sininae, and Gyrodinae—although clear distinctions could not be made. Similar uncertainty in the grouping of subtaxa was evident even when both hard and soft morphological characters were combined with the genetic characters of extant species (Aronowsky Reference Aronowsky2003). While it is known that naticids suffer from extensive morphological convergence, the classic character-based grouping therefore may not be sufficient to test this hypothesis. A quantitative approach by means of shape analysis via geometric morphometrics can be employed for classification of naticid gastropods. An advantage of quantitative analysis of shape over traditional morphological classification is that it provides accurate and precise results and enables visualization of shape changes, including those forms with extremely complicated shapes (Zelditch et al. Reference Zelditch, Swiderski, Sheets and Fink2004; Klingenberg Reference Klingenberg2013; Hogancamp et al. Reference Hogancamp, Barrick and Strauss2016; Polly and Motz Reference Polly and Motz2016).
We have applied here a geometric morphometric approach to study the nature of morphological evolution of the family Naticidae, its subfamilies, and its relationship with its sister group (family Ampullinidae Cossmann, Reference Cossmann1919) from the Jurassic to the Holocene (spanning more than 200 Myr). The main goals of this study are to test: (1) how the naticid subfamilies are morphologically related to their sister group (i.e., Ampullinidae); (2) whether shape conservatism among naticids is dependent on taxonomic hierarchy (i.e., whether naticid subfamilies can be differentiated from one another using shape data alone); (3) whether the family Naticidae is morphologically conservative (i.e., there has been very little temporal evolution of the naticid morphospace, which could have led to misidentification and improper grouping between and among groups); and (4) whether conservatism in naticids is restricted to certain aspects of shape, namely aperture and shell outline, rather than the overall shape. The naticid shell outline is extremely simple, explaining why other similar-looking gastropods are often mistakenly grouped under the naticid family, especially fossil specimens whose major distinguishing characters (e.g., umbilical area) are not well preserved.
Materials and Methods
The Database
For morphological evaluation, 27 naticid and non-naticid genera were used, 21 belonging to the five subfamilies of the family Naticidae—Globisininae, Gyrodinae, Naticinae, Polinicinae, and Sininae—whereas the remaining 6 were from the sister group of naticids, that is, the family Ampullinidae (5 from Ampullellinae Cossmann, Reference Collins and Gazley1919; 1 from Ampullospirinae Cox, Reference Cox1930; for all taxonomic and related information, see Supplementary Table 1). A total of 186 species were considered. The included species range from the Jurassic to the Holocene, and thus they span the entire evolutionary history of the studied group. For this, published literature was downloaded using Google Scholar, supplemented by the WoRMS database (http://www.marinespecies.org/index.php) and the Paleobiology Database (PBDB; https://paleobiodb.org) (Supplementary Table 1). The entire time interval was subdivided into eight time bins: Jurassic, Cretaceous, Paleocene, Eocene, Oligocene, Miocene, Plio-Pleistocene, and Holocene. The Pliocene and Pleistocene individually span a very limited time range in the geological record, and these two time bins have therefore been grouped to provide a length of approximately 5 Myr, comparable to other time bins. Although the time interval of the Holocene is also very restricted, the extant species can be confidently identified by means of DNA analyses (Hülsken et al. Reference Hülsken, Tapken, Dahlmann, Wägele, Riginos and Hollmann2012).
To test whether naticid subfamilies can be separated from the sister group, Ampullinidae (goal 1), the complete dataset comprising 186 species (170 naticid and 16 ampullinid species) was used. However, a subset of this dataset, comprising 170 species belonging to 21 genera of the family Naticidae, was used to evaluate goals 2–4.
Geometric Morphometrics
To quantify the shape of these 186 species, figures were collected from previously published literature (Supplementary Table 1), supplemented from online museum resources like the National Museum of History, France (Muséum national d'histoire naturelle); the Natural History Museum, Rotterdam; the Neogene Atlas of Ancient Life; the WoRMS database; and the PBDB. For each species, a single specimen with the best-quality photograph available was chosen as its representative. The apertural views of the completely preserved specimens were used, and it was also ensured that the figures were scaled and the apertural plane was vertical. In a few cases where scales were not given, the length or width for that species, as given in the respective paper or figure, was used to digitally draw a scale. All image-enhancing operations (scaling, sharpening, and rotation) were done using ImageJ software (v. 1.52a; Schneider et al. Reference Schneider, Rasband and Eliceiri2012). Collecting photographs from different sources may lead to the incorporation of error induced by variations in photographic setups and image formats (Arnqvist and Martensson Reference Arnqvist and Martensson1998), whereas collecting photographs from a single source can lead to systematic bias in analysis resulting from camera settings (particularly in group-sensitive analyses like canonical variate analysis) (see Collins and Gazley Reference Collins and Gazley2017). To eliminate these errors, for each species, we consulted several images from different sources and only used a photograph with high resolution in which the features were clearly visible and images were not distorted. To further minimize photography-related errors, we omitted a few (n = 21) poorly preserved specimens from our initial list of taxa. Despite these data-filtering steps, some error may persist, but it should be low and evenly distributed throughout the studied time bins and taxonomic groups.
To quantify shape variation, a standard landmark- and semilandmark-based geometric morphometric approach was followed. We chose a landmark-based method over outline analyses because naticids and ampullinids contain multiple phylogenetically relevant points that can be traced through time and among groups. On the other hand, outline-based methods do not incorporate the concept of biological homogeneity into the analysis and are better suited for comparing irregularly shaped forms or character-poor groups (Roy et al. Reference Roy, Balch and Hellberg2001; Navarro et al. Reference Navarro, Martin-Silverstone and Stubbs2018). The collected photographs of all naticid and ampullinid species (n = 186) were digitized using tpsDig2 software (v. 2. 31; Rohlf Reference Rohlf2017) (Supplementary Fig. 1). The chosen landmarks (hereafter referred to as “LM”) describe the following morphological features: LM 1, tip of protoconch; LM 2, right end of upper suture of body whorl, as visible in the apertural view; LM 3, left end of upper suture of body whorl, as visible in the apertural view; LM 4, inflection point along right shoulder; LM 5, inflection point along left shoulder; LM 6, abapical terminal point of suture on the body whorl; LM 7, horizontal extrapolation of LM 6 along the left side of body whorl; LM 8, maximum curvature along the outer apertural lip; LM 9, lowest point of the shell; LM 10, midpoint of an imaginary line joining LMs 12 and 13, lying on the inner lip; LM 11, projection of posterior inner lip on the posterior side of the outer lip; LM 12, contact point between columellar lip and basal lip; LM 13, contact point between parietal lip and columellar lip; LM 14, for umbilicate forms, farthest point from LM 10, and for nonumbilicate forms, LMs 10 and 14 coincide; LM 15, horizontal extrapolation of LM 12 along the left side of body whorl; LM 16, approximate location of maximum curvature of body whorl located along the left side of aperture. In the case of umbilicate forms, LMs 12–14 represent the umbilical shape.
These chosen landmarks capture all the features deemed critical to naticid gastropods for taxonomic identification by previous workers, such as, protoconch and spire height (defined by LMs 1–3) distinguishes naticids from ampullinids (although some naticids such as Polinicinae and Gyrodinae can also have relatively high-spired shells); presence/absence and shape of umbilical area (defined by LMs 12–14) is used for identifying species of Naticinae, discriminating among naticids, and between naticids and ampullinids; and inner lip features (defined by LMs 10–13) are commonly used for discriminating Polinicinae species from other groups (Marincovich Reference Marincovich1977; Majima Reference Majima1989; Bandel Reference Bandel1999; Bandel and Dockery Reference Bandel and Dockery2012; Das et al. Reference Das, Mondal, Saha, Bardhan and Saha2019). Some of the landmarks were selected to define apertural features (beginning of aperture, outer lip, basal point of aperture, inner lip) (Carvajal-Rodriguez et al. Reference Carvajal-Rodríguez, Conde-Padín and Rolán-Alvarez2005) (LMs 6, 8, 9, 10), and shoulder (Das et al. Reference Das, Mondal, Saha, Bardhan and Saha2019) (LMs 4 and 5). The straight-line distance between LM 1 and LM 9 describes the height of the shell (H), whereas the same measurement between LM 8 and LM 16 describes the maximum width of the shell (Wd) (Supplementary Fig. 1); aperture height (h) can be measured as the perpendicular distance between LM 6 and LM 9, whereas the distance between LM 8 and LM 10 describes apertural width (wd); the distance between LM 10 and LM 14 describes whether the umbilicus is open or closed. To study the apertural configurations, we used LMs 6 and 8–11, and for the outline configuration, LMs 1–11 and 15–16 were used. To minimize human error as much as possible, three authors (N.S., S.M., and S.S.D.) mutually decided the final landmark positions. Because geometric morphometrics focuses purely on shape analysis of selected taxa, all non-shape aspects such as size, translation, and rotation were removed by using the Procrustes superimposition method (Zelditch et al. Reference Zelditch, Swiderski, Sheets and Fink2004). Procrustes superimposition also reorients the raw landmarks and generates a consensus or mean shape (Zelditch et al. Reference Zelditch, Swiderski, Sheets and Fink2004). Further morphometric analyses were performed on these transformed coordinates.
To create a morphospace for naticids and related taxa, principal components analysis (PCA) was conducted on the Procrustes-transformed coordinates to visualize shape variation. PCA creates a linear transformation of the original variables and thus removes any correlation among them (Zelditch et al. Reference Zelditch, Swiderski, Sheets and Fink2004). We first ran a PCA using all 16 LMs to compare the overall shape between naticids and ampullinids. To do this, specimens of all time intervals were pooled together and grouped according to their respective families and subfamilies; for ease of visualization, only the naticid and ampullinid subfamilies were plotted on the morphospace. In addition, three other PCAs were run to analyze shape evolution in naticids: (1) to show temporal change in the overall shape, using all 16 LMs; (2) to show temporal variation in the outline shape, using LMs 1–11 and 15–16; and (3) to show temporal variation in the apertural shape, using LMs 6 and 8–11. For these three plots, only age-specific specimens were plotted for each time bin by classifying them according to their respective subfamilies.
However, a problem with PCA is that it assumes that all included specimens belong to a single group and is thus taxon independent. To counter this issue, we used another eigenanalysis method, canonical variate analysis (CVA). The benefit of CVA is that it takes group differences into consideration and maximizes the variation among them (Hogancamp et al. Reference Hogancamp, Barrick and Strauss2016), making it a taxon-dependent method. Here, we performed CVA only to test how group (i.e., subfamily) specification affects the clustering among naticid subfamilies. Morphological deformations associated with each PCA axis were explained in terms of the four Raupian parameters: S (shape of the generating curve), W (rate of whorl expansion), D (position of the generating curve with respect to the coiling axis), and T (rate of whorl translation) (Raup Reference Raup1962, Reference Raup1966). These simple parameters adequately express the shell geometry of coiled forms (Raup Reference Raup1966). The following R (v. 1.2.1335; R Core Team 2018) packages were used: geomorph (Adams and Otárola-Castillo Reference Adams and Otárola-Castillo2013), ggplot2 (Wickham Reference Wickham2016), Morpho (Schlager Reference Schlager, Zheng, Li and Székely2017), and vegan (Oksanen et al. Reference Oksanen, Blanchet, Friendly, Kindt, Legendre, McGlinn, Minchin, O'Hara, Simpson, Solymos, Stevens, Szoecs and Wagner2019).
Other than visual analyses, permutational multivariate analysis of variance (PERMANOVA), with 9999 iterations, was used to test mean shape differences through time as well as among families and subfamilies; the adonis function in the vegan package in R was used (Oksanen et al. Reference Oksanen, Blanchet, Friendly, Kindt, Legendre, McGlinn, Minchin, O'Hara, Simpson, Solymos, Stevens, Szoecs and Wagner2019), and PCA scores from all the axes were used. However, PERMANOVA is sensitive to unequal sample size within each subgroup (here, subfamily and age) (Anderson and Walsh Reference Anderson and Walsh2013). In our case, because the subgroup sample sizes are quite different from one another, we further used analysis of similarity (ANOSIM), using the anosim function in the vegan package in R (Clarke Reference Clarke1993) and independent pairwise Mann-Whitney U-tests.
To check whether there has been any shift in the median configuration in naticids through time, we computed the median naticid shape for each time bin, using all PC axes, and compared these values using the Kruskal-Wallis test. Similarly, to assess whether within-subfamily median configurations have changed, we binned naticid subfamilies according to ages (e.g., Jurassic–Polinicinae, Cretaceous–Polinicinae), computed their median values, and conducted Kruskal-Wallis tests between each subfamily–age pair. Furthermore, to analyze shape variation associated with different subfamilies and across different ages, we used two disparity metrics: sum of ranges (SORs) of occupied morphospace and Procrustes variance (PV) (Wills et al. Reference Wills, Briggs and Fortey1994; Foote Reference Foote1995; Ciampaglio et al. Reference Ciampaglio, Kemp and McShea2001; Wills Reference Wills, Adrian, Edgecombe and Lieberman2001; Ciampaglio Reference Ciampaglio2004; Hopkins and Gerber Reference Hopkins, Gerber, de la Rosa and Müller2017). The SOR metric gives an indication of the overall range of morphospace occupied and is calculated as the summation of the differences between the maximum and minimum values. PV, on the other hand, explains the distribution of taxa in the morphospace and is defined as the sum of the diagonal elements (trace) of the group covariance matrix, divided by the number of observations in the group (Zelditch et al. Reference Zelditch, Swiderski, Sheets and Fink2012). PV was calculated using the morphol.disparity function, and pairwise comparisons were done using 999 iterations from the geomorph package in R. When used in conjunction, these two indices give a complete explanation of the observed disparity patterns. All significant results were followed up with post hoc pairwise comparison tests. We used a sequential Bonferroni correction for all pairwise comparisons (Nakagawa Reference Nakagawa2004); otherwise, an α value of 0.05 was used. Statistical analyses were performed using both R and PAST software (v. 3.25; Hammer et al. Reference Hammer, Harper and Ryan2001).
Results
Relation of Naticidae with Sister Taxa Ampullinidae
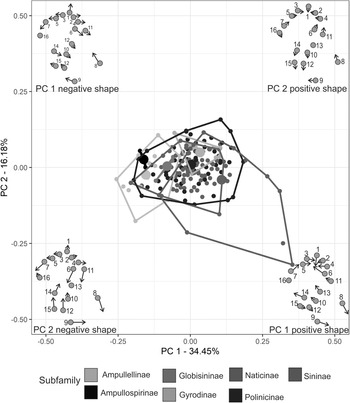
To understand how naticids are related to their sister taxon, Ampullinidae, the naticid morphospace was compared with ampullinids at the subfamily level by pooling all time intervals, using PCA (Fig. 1, Supplementary Fig. 2). The first three PC axes explain approximately 63.18% of the total variation: PC 1 (summarizing 35.45% variation) mostly explains variation in spire height and aperture height; PC 2 (summarizing 16.18% variation) explains variation in the apertural shape and umbilical region; and PC 3 (summarizing 11.55% variation) mostly explains variation in shell globosity and umbilical area, as indicated by lollipop deformation plots (Fig. 1, Supplementary Fig. 2). On the PC 1–PC 2 morphospace, ampullinids occupy the left side of the morphospace and show overlap with Naticinae, and on the PC 2– PC 3 morphospace, ampullinids occupy the right-central region and show overlap with most of the naticid subfamilies.
Ordination of the five naticid and two ampullinid subfamilies along the first and second principal component (PC) axes, based on their overall shapes Convex hulls estimate the extent of morphospace occupied by the subfamilies. The PC 1 axis explains changes in spire height and apertural height, whereas PC 2 explains changes in apertural shape. All naticid subfamilies are represented by shades of blue, whereas the two ampullinid subfamilies are shown by shades of gray. Lollipop deformation plots show shape change along each axis; positive shapes represent morphological configurations associated with the largest value along each axis, and negative shapes represent configurations associated with the lowest value along each axis. Note, mean shapes of ampullinids are statistically different from naticids, both at the family and subfamily level, despite the overlap among their respective subfamilies (see text for details). For shades of color, see color figure online.

However, statistical comparisons by means of PERMANOVA and ANOSIM suggest significant differences between the two families and their constituent subfamilies (all time intervals pooled together; for family-specific analyses: PERMANOVA F = 20.760, p << 0.05, ANOSIM p << 0.05; for subfamily-specific analyses: PERMANOVA F = 8.122, p << 0.05, ANOSIM p << 0.05; for all subfamily-specific PERMANOVA and ANOSIM pairwise p-values, see Supplementary Table 2). In contrast, pairwise Mann-Whitney U-tests suggests nonsignificant differences between the two families or their subfamilies (p > 0.05 for both cases). Time-specific morphospace affinities between ampullinids and naticids, using PCA (Supplementary Fig. 3), could not be statistically analyzed because of insufficient sample size of ampullinids in most of the time bins (n < 3 in Oligocene and Miocene, n = 0 for Cretaceous, Paleocene, and Holocene bins; only Jurassic has n = 4, and Eocene has n = 8); although an overlap between naticids and ampullinids is observed for the Eocene interval (Supplementary Fig. 3). Therefore, despite apparent morphological similarities and general stratigraphic equivalence, the mean shapes of ampullinids and naticids are distinct from one another.
Morphological Distinction among Naticid Subfamilies
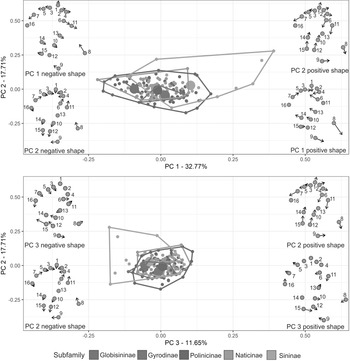
To identify the interrelationships among the different subfamilies of the family Naticidae in the morphospace, PCAs were performed by pooling all time intervals (Fig. 2). Morphospace plots have been drawn using the first three axes, which collectively summarize 62.13% of the total variation (PC 1: 32.77%; PC 2: 17.71%; PC 3: 11.65%). As evident from the lollipop deformation diagrams, PC 1 represents variation in W (rate of whorl expansion) and T (rate of translation), PC 2 represents variation in apertural shape, and PC 3 explains variation in the umbilical and basal regions of the shell (Fig. 2).
Discrimination among the five naticid subfamilies based on the first three axes of the principal component analysis (PCA). The 95% convex hulls estimate the broad range of disparities of the subfamilies, and the large central dot within each polygon represents the mean shape for that subfamily. The PC 1 axis represents the whorl expansion rate (W) and the rate of translation (T), PC 2 represents variation in apertural shape, and PC 3 indicates variation in the umbilical region. Lollipop deformation plots display shape change along each axis; positive shapes represent morphological configurations associated with the largest value along each axis, and negative shapes represent configurations associated with the lowest value along each axis. Note, although the subfamilies show considerable overlap, their mean shapes are significantly different from one another (see text for details).

On both PC 1–PC 2 as well as PC 2–PC 3 morphospace, the central positions are occupied by Naticinae, Polinicinae, and Gyrodinae, and collectively, all naticid subfamilies show overlap among one another (Fig. 2). Mean shape points of the individual subfamilies plotted within the PC convex hulls also apparently fall close to one another. This pattern of overlap is evident in the CVAs as well (Supplementary Fig. 4). However, when all the PC axes are incorporated, this pattern of among-subfamily similarity is not supported by PERMANOVA or ANOSIM (in both cases, p << 0.05) (Supplementary Table 3). This ambiguity could simply be due to unequal sample sizes: Globisininae (n = 3) and Gyrodinae (n = 13) have very low sample sizes compared with Sininae (n = 22), Polinicinae (n = 65), or Naticinae (n = 69). Sininae is apparently different from the rest: on the PC 1–PC 2 morphospace it is spread out along the right, and on the PC 2–PC 3 morph ospace, this subfamily shows discrete distribution along the PC 2 axis (Fig. 2). Pairwise comparison of the PVs of the subfamilies (Supplementary Table 3), as well as Mann-Whitney U-test, further support that Sininae is the aberrant subfamily. However, there are no significant differences between the SOR of the morphospaces occupied by the subfamilies (Kruskal-Wallis test: p > 0.05). Therefore, although the total range of morphospaces occupied by the different subfamilies is similar, their average shapes are different from one another, and Sininae in particular explains the majority of the variance.
Temporal Evolution of the Naticid Morphospace
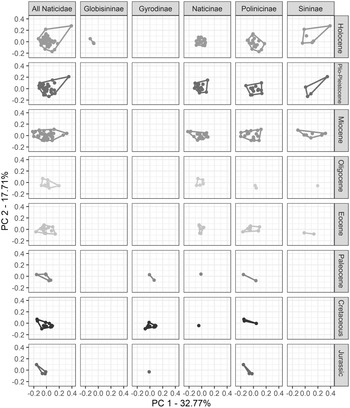
Time-specific morphospace occupancy of the family Naticidae from the Jurassic up to the Holocene, based on 170 species within 21 genera, has been plotted using the first three PC axes to visualize morphospace evolution (Fig. 3, Supplementary Figs. 5–9). The Jurassic morphospace is very restricted, maybe because of the small sample size (n = 4), contributed by only two subfamilies, Polinicinae and Gyrodinae, and there is an apparent expansion of the occupied morphospace later on (Fig. 3, Supplementary Figs. 5–9); however, to statistically validate these observed morphospace patterns, we conducted multiple tests incorporating all PC axes, as discussed in the following paragraphs.
Ordination of the family Naticidae and its five subfamilies along the first and second principal component (PC) axes, based on their overall shapes, segregated according to age (Jurassic to Holocene). Convex hulls estimate the extent of morphospace occupied. Shape change along each PC axis is the same as described in Fig. 2. Note, although there is an apparent morphospace expansion through time, the median and mean shape, as well as range of occupied morphospace and variance, are not significantly different across different time bins (see text for details).

Analysis of variation in mean shape through time, determined using PERMANOVA, reveals significant results (F = 1.604, p < 0.05). Similar PERMANOVA analyses on apertural and outline configurations find statistically significant differences among the time bins only for apertural configuration (F = 2.091, p < 0.05; see Supplementary Table 4 for all pairwise comparisons); for outline configuration, p > 0.05. However, in our case, different time bins have vastly different sample sizes: Jurassic (n = 4), Cretaceous (n = 14), Paleocene (n = 5), Eocene (n = 16), and Oligocene (n = 9) have very few specimens compared with the three youngest Cenozoic time bins (Miocene n = 41; Plio-Pleistocene n = 34; Holocene n = 47), and this could have potentially biased our PERMANOVA results. For example, for the well-sampled time interval, that is, the Miocene–Holocene interval, naticid morphology remains unchanged (p > 0.05 for overall, apertural, and outline shape configurations). ANOSIM further confirms the ambiguity of PERMANOVA results: it suggests shape conservatism in naticid gastropods through time (p > 0.05, in all three configurations of overall, apertural, and outline shapes). Independent post hoc pairwise comparison among the time bins by means of Mann-Whitney U-tests also supports temporal shape conservatism within this family (p > 0.05 for overall, apertural, and outline shapes). This conservatism is also evident when we analyze the median shape through time for naticids as a whole (Kruskal-Wallis test: p > 0.05) or for the individual subfamilies (Kruskal-Wallis tests: in all cases, p > 0.05).
Shape conservatism in naticids is also evident when measures of disparity are analyzed. For example, PV scores using the Kruskal-Wallis test also support that there is no change in morphology through time, that is, median values for different time bins are statistically similar (Kruskal-Wallis tests: p > 0.05 for overall, apertural, and outline shapes); pairwise comparison of variance values also returns nonsignificant p-values in all shape configurations. Similarly, SOR calculated for overall, apertural, and outline shapes also suggests this conservatism (Kruskal-Wallis test: p > 0.05 for all shape configurations). Therefore, naticids show shape conservatism in overall shape and apertural shape, as well as in outline shape, as suggested by the varied parameters of mean and median shape and the two disparity indices.
Discussion
Morphologically, naticids have a very simple shell, and as discussed by previous authors, external shell characters may not be sufficient to segregate the members of this family (Bandel Reference Bandel1999; Das et al. Reference Das, Mondal, Saha, Bardhan and Saha2019). Perhaps for this reason, several workers in the past related naticids with other diverse gastropod families such as the Ampullinidae, Calyptridae, Cypridae, Littorinidae, Neritidae, and Xenophoridae (Bandel Reference Bandel1999; Kase and Ishikawa Reference Kase and Ishikawa2003; Strong Reference Strong2003; Colgan et al. Reference Colgan, Ponder, Beacham and Macaranas2007; for reviews, see Aronowsky Reference Aronowsky2003; Hülsken Reference Hülsken2008). However, through multivariate shape analyses, we were able to distinguish between the mean shapes of Naticidae and Ampullinidae, although their general shell forms are quite similar. Our results are in agreement with Bandel (Reference Bandel1999), who suggested that ampullinids and naticids, in spite of their superficial resemblances, belong to two different groups and should be regarded as sister taxa. Morphologically, ampullinids possess unique features such as the sheath, tabulate shoulders, ramp, conchioline operculum, and residual color pattern (Kase and Ishikawa Reference Kase and Ishikawa2003; Beu and Marshall Reference Beu and Marshall2011; Caze et al. Reference Caze, Merle, Le Meur, Pacaud, Ledon and Saint Martin2011; Griffin and Pastorino Reference Griffin and Pastorino2013; Cataldo and Lazo Reference Cataldo and Lazo2016), which are not present in naticids. Aside from morphology, the feeding habit of naticids is also different from ampullinids—carnivory versus algal grazing (Beu and Marshall Reference Beu and Marshall2011). Furthermore, phylogenetic analyses have confirmed that these two groups of gastropods indeed belong to different taxonomic families (Ponder and Lindberg Reference Ponder and Lindberg1997). However, because both naticids and ampullinids have largely similar globose shell forms and show stratigraphic congruence, it may be difficult to assign the proper taxonomic affinity of poorly preserved shells (e.g., internal molds, broken shells), especially when they occur in coeval sections in the fossil record. Thus, proper distinction between naticids and ampullinids is largely contingent upon preservation, and this could explain why several workers in the past misidentified and assigned several ampullinids within Naticidae (Marincovich Reference Marincovich1977), thus inflating naticid diversity.
Comparison among naticids suggests that the mean morphotypes of the subfamilies can be distinguished from one another using diagnostic subfamily-specific characters. The subfamily Naticinae represents the most generalized morphologies among all other groups: low-spired, globose shells, open umbilicus (Majima Reference Majima1989; Pedriali and Robba Reference Pedriali and Robba2005). However, when only few morphological characters (e.g., the overall shell outline, globosity, apertural shape) are used to distinguish these subfamilies, no clear distinction is evident. This is because these morphological characters are very simple and are mostly homoplastic in naticids; it may be for this reason that previous authors were at times skeptical about groups of fossil naticid subfamilies (Woodring Reference Woodring1957; Sohl Reference Sohl1960; Majima Reference Majima1989; Hülsken et al. Reference Hülsken, Tapken, Dahlmann, Wägele, Riginos and Hollmann2012; Das et al. Reference Das, Mondal, Saha, Bardhan and Saha2019). However, when all axes of the multivariate shape space are used, naticid subfamilies show clear differences, suggesting that these subfamilies indeed have quite a few unique morphological attributes: the inner lip features and callus cover in Polinicinae; subsutural wrinkles in Gyrodinae; broad aperture, auriform shell form, and spiral ornamentation in Sininae (although Sininae has several aberrant forms; see Supplementary Table 3) (Marincovich Reference Marincovich1977; Popenoe et al. Reference Popenoe, Saul and Susuki1987; Majima Reference Majima1989; Das et al. Reference Das, Mondal, Saha, Bardhan and Saha2019). Therefore, naticid subfamilies are morphologically unique entities and thus the usage of subfamilies for naticid taxonomic classification is justified (Majima Reference Majima1989; Aronowsky Reference Aronowsky2003; Hülsken Reference Hülsken2008; Das et al. Reference Das, Mondal, Saha, Bardhan and Saha2019).
Within naticids, shape conservatism is maintained temporally: throughout its evolutionary timespan of approximately 200 Myr (i.e., from the Jurassic onward) this family has shown little temporal change in its morphology (Fig. 3, Supplementary Figs. 5–9). This pattern is independent of the stratigraphic distribution of representative subtaxa, that is, the appearance or disappearance of taxa, such as the extinction of Gyrodinae in the Paleocene or the introduction of Sininae in the Eocene, does not affect this temporal pattern (Fig. 3, Supplementary Figs. 5–9). Although there have been apparent expansions in the occupied morphospace, the majority of which is attributed to outliers present in Sininae, SORs suggest that these expansions are statistically nonsignificant. It is known that Sininae as a group is “controversial” for its peculiar morphologies, despite its position as a monophyletic clade within the family Naticidae (Hülsken Reference Hülsken2008); however, comparison of naticid median shapes from the Jurassic to the Holocene along with the comparison of subfamily median shapes through different ages suggests that even the origination and diversification of the aberrantly shaped Sininae do not affect the basic naticid Bauplan.
The simple, globose shell form of naticids, along with few autapomorphic characters, has led to prolific ambiguity in the classification of naticid species and is also responsible for the misidentification of several unrelated naticiform gastropods as naticids, particularly when shell preservation is poor. This tendency of indiscriminately including all naticoid forms within the canopy of Naticidae has caused an artificial inflation in the diversity of this group, known as the “wastebasket taxon phenomenon” (Sohl Reference Sohl1960; Plotnick and Wagner Reference Plotnick and Wagner2006; Das et al. Reference Das, Mondal, Saha, Bardhan and Saha2019). For example, authors claim to have identified naticids from as early as the Paleozoic era (www.paleobiodb.org) and from the Triassic (Sohl Reference Sohl1969; Fürsich and Jablonski Reference Fürsich and Jablonski1984), although unmistakable naticids are recovered no earlier than Jurassic (Das et al. Reference Das, Mondal, Saha, Bardhan and Saha2019). Therefore, the widespread morphological and ecological conservatism across naticids causes problems in not only the taxonomic classification of naticids, but also in understanding the overall evolutionary history of this group (Sohl Reference Sohl1960; Bandel Reference Bandel1999).
The observed morphological conservatism is independent of the taxonomic composition and ecological changes. The genus-level taxonomic diversity of naticids underwent several phases of diversification in the Cenozoic, particularly reaching peak diversity from the Eocene onward (Marincovich Reference Marincovich1977; PBDB). Furthermore, ecological factors—predation and competition within naticids, as well as predation by these groups—have not caused any morphological expansion. Naticid confamilial predation—a measure of predation and competition among naticids—did increase during the Cenozoic, and there are even reports of change in naticid–naticid predatory interactions (Kowalewski et al. Reference Kowalewski, Dulai and Fürsich1998; Dietl and Alexander Reference Dietl and Alexander2000; Mondal et al. Reference Mondal, Goswami and Bardhan2017). As predators, although naticids became spatially widespread during the latter part of the Cenozoic (Huntley and Kowalewski Reference Huntley and Kowalewski2007; Mondal et al. Reference Mondal, Chakraborty and Paul2019), their basic morphospace did not expand. Surprisingly, the shell globosity and apertural shape—features directly related to naticid predation ability—also show no temporal change (Kitchell Reference Kitchell, Nitecki and Kitchell1986; Dietl and Alexander Reference Dietl and Alexander2000; Fig. 3, Supplementary Figs. 5–9). All these factors indicate the decoupling of morphology from the taxonomic and ecological history of naticids, reflecting morphological stasis (Eldredge et al. Reference Eldredge, Thompson, Brakefield, Gavrilets, Jablonski, Jackson, Lenski, Lieberman, McPeek and Miller2005).
A probable cause of this remarkable morphological conservatism within naticids may be their ecology. During the Mesozoic, there was a major shift in tiering in the marine invertebrates living in soft sediment, with many phylogenetically independent groups showing a shift to infaunal life habit mainly to counter increasing predation pressure (Vermeij Reference Vermeij1977; Ausich and Bottjer Reference Ausich and Bottjer1982). Consequently, naticids started to interact with these infaunal prey communities right from the beginning of their evolutionary path (Kitchell Reference Kitchell, Nitecki and Kitchell1986; Das et al. Reference Das, Mondal, Saha, Bardhan and Saha2019). Because naticids are dominantly an infaunal group of gastropods that burrow into the sediment and feed by drilling into the shells of their prey mollusks and brachiopods (Bouchet and Warén Reference Bouchet and Warén1993; Bandel Reference Bandel1999; Hülsken et al. Reference Hülsken, Tapken, Dahlmann, Wägele, Riginos and Hollmann2012; Mondal et al. Reference Mondal, Goswami and Bardhan2017; but see Pahari et al. Reference Pahari, Mondal, Bardhan, Sarkar, Saha and Buragohain2016), morphological characters like foot size (as reflected in the apertural shape; Kitchell Reference Kitchell, Nitecki and Kitchell1986; Rodrigues et al. Reference Rodrigues, Nojima and Kikuchi1987) and effective burrowing (as reflected in shell globosity; Kitchell Reference Kitchell, Nitecki and Kitchell1986) are required to effectively consume these diverse prey. Surprisingly, studies that have dealt with the temporal evolution of these morphologies locally or over small timescales found no significant change (Kitchell Reference Kitchell, Nitecki and Kitchell1986; Kelley Reference Kelley1992; Dietl and Alexander Reference Dietl and Alexander2000; Kelley and Hansen Reference Kelley, Hansen, Allmon and Bottjer2001). In contrast, traits that functioned defensively (body size and thickness) showed temporal increase (Kitchell Reference Kitchell, Nitecki and Kitchell1986; Kelley Reference Kelley1992). In other words, in response to their own predators, size and thickness increased in naticids. Naticids thus appear to have responded more to their predators (as predicted by escalation) than to their prey (as would be expected in coevolution), at least in terms of morphological evolution. These results suggest that coevolution was not a significant component in naticids and that escalation (i.e., cannibalism; Kitchell et al. Reference Kitchell, Boggs, Rice, Kitchell, Hoffman and Martinell1986; Kelley Reference Kelley1991) was important for this group (Dietl and Alexander Reference Dietl and Alexander2000). This is also supported by Vermeij (Reference Vermeij1987), who suggests that the influence of prey community on evolution of predators is a “limited” phenomenon.
Without changing these morphological features required for effective prey handling, naticids maintained their behavioral conservatism: naticids always maintain strict site and size selectivity (see also Kitchell et al. Reference Kitchell, Boggs, Kitchell and Rice1981; Kabat Reference Kabat1990; Chiba and Sato Reference Chiba and Sato2012; Pahari et al. Reference Pahari, Mondal, Bardhan, Sarkar, Saha and Buragohain2016). Perhaps for this reason, predator behaviors (i.e., site and size stereotypy) of handling the same prey groups through time remained unchanged. Moreover, because most naticid drillers are sluggish, the pursuit phase, rather than the subjugation phase, is more effective (Vermeij Reference Vermeij1987). Naticids also more frequently target sluggish taxa like corbulids, lucinids, and cardids, among others (Anderson Reference Anderson1992; Kelley and Hansen Reference Kelley and Hansen1993; Harper Reference Harper1994), and deep-infaunal life or fast-moving ability is the only escape mechanism available in bivalved prey (Vermeij Reference Vermeij, Futuyma and Slatkin1983). For this reason, temporal change in adaptations against shell drilling are rare, even when drilling predation increased through time (Vermeij Reference Vermeij1987). Combining all these morphological and ecological factors, it appears that ecological and behavioral conservatism influenced naticid shape conservatism. Vermeij (Reference Vermeij2015) also argued that phylogenetic conservatism appears to be the rule during most speciation events, especially when there is little change in feeding habits, environments occupied, and predators.
Morphological adaptations suited to an infaunal mode of life are also noted in other groups such as boring bivalves with their asymmetrical, streamlined shells with a tapering posterior (Stanley Reference Stanley1970) and marine gastropods belonging to Strombidae (Savazzi Reference Savazzi1991; Everett Reference Everett2020). Similarly, groups displaying patterns of long-term shape conservatism include the turritellid gastropods (Allmon et al. Reference Allmon, Nieh and Norris1990), Cretaceous cyclophorid land snails (Hirano et al. Reference Hirano, Asato, Yamamoto, Takahashi and Chiba2019), the Cretaceous ammonite species Hoploscaphites nicolletii (Witts et al. Reference Witts, Landman, Hopkins and Myers2020), the Cretaceous Jacobsoniidae beetles (Yamamoto et al. Reference Yamamoto, Takahashi and Parker2017), the Devonian brachiopod genus Tropidoleptus (Isaacson and Perry Reference Isaacson and Perry1977), and the Nearctic squirrel clades (Zelditch et al. Reference Zelditch, Li, Tran and Swiderski2015). Furthermore, in the case of marine gastropods, previous studies have demonstrated that morphological features are selected to enhance ecological functioning; for instance, a low spire height and low apertural inclination help in making shells gravitationally more stable (Vermeij Reference Vermeij1971; Noshita et al. Reference Noshita, Asami and Ubukata2012). Another feature, the gastropod shell volume, is known to be crucial in protection against desiccation, osmotic stress, and predation (Ragagnin et al. Reference Ragagnin, Gorman, McCarthy, Sant'Anna, De Castro and Turra2018). Therefore, it can be said that ecologically driven morphological stability is a common phenomenon and is exhibited by multiple groups of organisms, and similar causes have enabled naticid gastropods to spatiotemporally flourish without undergoing significant change in their basic shell shape throughout their evolutionary history.
Conclusions
Based on 170 species from 21 genera within five subfamilies, our results suggest that the family Naticidae, ranging from the Jurassic to the Holocene, is morphologically conservative. Though the individual morphotypes of the naticid subfamilies are significantly different from one another, there has been no change in naticid shell shape in its 200 Myr history. However, when the family Naticidae is compared with its sister taxon Ampullinidae, significant differences between the mean shapes of the two groups are noted, regardless of their apparent morphological similarities. Furthermore, massive taxonomic diversification of naticids, or even global ecological changes related to predation and competition within and among naticids, did not have any effect on naticid morphospace, indicating a decoupling of ecological and taxonomic attributes on the morphospace occupancy in this group. A probable cause of this shape conservatism among naticids could be its ecological and behavioral conservatism—naticids have been restricted to an infaunal mode of life and have targeted only specific infaunal prey throughout their evolutionary history, and this conservatism has enabled them to diversify without showing significant morphological changes in their basic Bauplan.
Acknowledgments
N.S. and S.M. acknowledge the University of Calcutta, Kolkata, for providing infrastructural facilities. S.S.D., K.B., and S.S. acknowledge the Indian Statistical Institute, Kolkata, for providing infrastructural facilities. P. D. Polly and C. P. Klingenberg are acknowledged for their help with methodological discussions. The authors acknowledge S. Bardhan, two anonymous journal reviewers, and the subject editor M. J. Hopkins for their thoughtful comments and suggestions.