INTRODUCTION
There are many challenges in malaria control, particularly in relation to economic costs and outcomes of differing strategies (Indaratna and Kidson, Reference Indaratna and Kidson1995). Considerable effort has been devoted to quantifying the analysis of control programmes in various countries (Kaewsonthi, Reference Kaewsonthi1989; Miles, Reference Miles and Target1991). The majority of malaria cases worldwide are treated on the basis of clinical diagnosis, contributing to irrational drug use or research. Microscopy is the time-honoured method of laboratory confirmation of malaria, including species identification. However, the microscopic analysis of a patient's blood smear is a potential problem in all affected areas. An audit, the National External Quality Assessment Scheme (NEQAS), data and the observations of reference centers on slides submitted to them for confirmation of diagnosis have revealed shortcomings in the diagnosis of malaria in the United Kingdom (Milne et al. Reference Milne, Kyi, Chiodini and Warhurst1994) and in Thailand (Beadle et al. Reference Beadle, Long, Weiss, McElroy, Maret, Oloo and Hoffman1994; Fix et al. Reference Fix, Waterhouse, Greiner and Stoskopf1988). There was significant misdiagnosis with regard to false positives (7–36%), false negatives (5–18%), and wrong identification (13–15%). A high frequency of technical errors (e.g. wrong pH in staining solution or a poor quality film) was also noted. Therefore, microscopy is an imperfect ‘Gold Standard’ diagnostic methodology (Makler et al. Reference Makler, Palmer and Ager1998).
Several new methods of malaria diagnosis have been developed in the past 2 decades. Although some methods lend themselves to automation (e.g. PCR and flow cytometry), no technique can yet be used for routine clinical automated screening. PCR and flow cytometry have taken advantage of the absence of DNA in erythrocytes. Thus, if the parasite is inside the cell, its DNA can be stained with specific nucleic acid-binding dyes and detected by flow cytometry (FCM). Different dyes, such as Hoechst 33258 (Brown et al. Reference Brown, Battye and Howard1980), acridine orange (Whaun et al. Reference Whaun, Rittershaus and Ip1983), thiazole orange (Makler et al. Reference Makler, Lee and Recktenwald1987) or hydroethidine (Wyatt et al. Reference Wyatt, Goff and Davis1991), have been considered for the determination of parasitaemia in cultures of Plasmodium falciparum by FCM. Jacobberger et al. (Reference Jacobberger, Horan and Hare1984) used DiOC1 (Makler et al. Reference Makler, Lee and Recktenwald1987), a membrane potential responsive dye and Hoechst 33342 to evaluate P. vinckei parasitaemia levels in mice. Their method involved an elaborate sample preparation procedure. The best advocated flow cytometric method involves Hoechst 33258 (Janse and Vianen, Reference Janse and van Vianen1994). The detection of this dye, however, requires a UV flow cytometer that is not commonly available.
YOYO-1, a dimeric cyanine nucleic acid dye, is among the high sensitivity fluorescent probes available for nucleic acid staining (Rye et al. Reference Rye, Yue, Wemmer, Quesada, Haugland, Mathies and Glazer1992; Barkan et al. Reference Barkan, Ginsburg and Golenser2000). YOYO-1 has a very high affinity for DNA, and it can be excited at 488 nm, which is the excitation wavelength available from most lasers employed in FCM. Its bright fluorescence signal and low background make it ideal for flow cytometric analysis of stained malaria nucleic acids (Barkan et al. Reference Barkan, Ginsburg and Golenser2000; Jimenez-Diaz et al. Reference Jimenez-Diaz, Rullas, Mulet, Fernandez, Bravo, Gargallo-Viola and Angulo-Barturen2005). Like many other dimeric cyanines, it is non-fluorescent in the absence of nucleic acids and its quantum yield (0·52 relative to fluorescein), relative fluorescence intensity (4·4) with other DNA dyes and coefficient of extinction (98 900 c/M) are high when bound to DNA (Rye et al. Reference Rye, Yue, Wemmer, Quesada, Haugland, Mathies and Glazer1992; Haugland, Reference Haugland1996). Parasitized erythrocytes infected with P. berghei and labelled with YOYO-1 can be completely separated from uninfected erythrocytes due to the greater relative fluorescence intensity, whereas with other dyes (propidium iodide, acridine orange and Hoechst 33342) the event peaks seem to converge as the parasitaemia diminishes with less intensity after staining (our unpublished data). These features make YOYO-1 an extremely sensitive nucleic acid dye compared with many of the aforementioned dyes, a property that can be very useful in FCM for cells infected with parasites (Hirons et al. Reference Hirons, Fawcett and Crissman1994).
FCM analysis in rodent models of malaria is impeded by the presence of significant numbers of reticulocytes and normocytes containing detectable amounts of nucleic acids (RNA). By limiting sensitivity and specificity (Jacobberger et al. Reference Jacobberger, Horan and Hare1992), reticulocytes can be identified by the presence of RNA in their cytoplasm with any DNA dye. Therefore, this technical difficulty to differentiate the reticulocytes and normocytes for measurement of parasitaemia in rodent models of malaria restricts sensitivity to 0·1–0·2% under the best conditions (Janse and van Vianen, Reference Janse and van Vianen1994), which is 10–20 times less sensitive than microscopy at 0·01% (Moody, Reference Moody2002).
Attempts to identify populations of rat's blood cells having effects on blood-stage P. berghei have been complicated by the problem of enumerating parasites in cell mixtures containing parasitized, uninfected, reticulocyte and nucleated blood cells. In this study a flow cytometer (Cell Lab QuantaTM, Beckman Coulter Inc., Fullerton, CA) with a 488 nm laser combined with YOYO-1 nucleic acid dye was used. We compared our reliable FCM method to traditional microscopical analysis of blood smears for the evaluation of parasitaemia in rats infected with P. berghei. This report describes a dual-parameter procedure using autofluorescence to distinguish infected erythrocytes from uninfected erythrocytes and normocytes. This method is particularly well suited for measuring low parasitaemia due to its significantly increased sensitivity.
MATERIALS AND METHODS
Drugs and chemicals
The antimalarial compound used in this study was artesunic acid (4-(10′dihydro-artemisinin-oxymethyl) succinate; AS) that was synthesized and manufactured by Knoll AG (Switzerland). The formulation is contained in sterilized bottles with 110 mg AS per bottle. The injection buffer for AS is manufactured as a GMP phosphate salt with 0·3 m phosphate-buffered saline (PBS, pH 8·1) and provided by Stanford Research Institute (SRI, CA). Another test compound was tetra-acetamide pyrroloquinazolinediamine (PQD-A4), which was synthesized in the Department of Medicinal Chemistry, Walter Reed Army Institute of Research, Silver Spring, MD. Carboxymethyl cellulose, Tween-80, 0·9% saline solution was purchased from Abbott Labs (Chicago, IL). Sodium citrate, heparin, D-glucose, glycerol and methanol were purchased from Sigma Chemical Co. Hema 3 stain was obtained from Fisher Scientific Co. YOYO-1 (oxazole yellow homodimer) was purchased from Invitrogen Corp. (Carlsbad, CA). Glutaraldehyde, Triton X-100, and ribounclease A (RNAse A) were purchased from Sigma-Aldrich (St Louis, MO).
Malaria-infected rats
The ANKA strain of Plasmodium berghei (WRAIR) used in this study was rat-adapted from a mouse strain by 3 successive 4-week passages through 7-week-old rats. Seven-week-old P. berghei-infected and uninfected Sprague Dawley rats (body weight of 186–213 g) were randomly assigned into study groups of 6 animals. The animal protocol was approved by the IACUC, WRAIR. The research was conducted in compliance with the Animal Welfare Act and other federal statutes and regulations relating to animals and experiments involving animals, and it adhered to principles stated in the Guide for the Care and Use of Laboratory Animals, NRC Publication, 1996 edition.
All animals were quarantined (stabilized) for at least 7 days prior to infection. Rats were individually housed with food and water supplied ad libitum. Rats were inoculated intraperitoneally (IP) with P. berghei-infected rat blood (2×10⁷ parasitized erythrocytes/rat in 0·5 ml glucose-citrate solution) obtained from donor rats infected 1 week earlier with cryopreserved parasites. Two pre-treatment smears were taken from all animals for parasitaemia analysis (days 5 and 6). Animals with >4% parasitaemia on day 6 were selected for the FCM method validation and efficacy studies. Eighteen post-treatment smears were obtained from each rat on a daily basis for 28 days.
Optimization of sample preparation for FCM
The progress of infection in rats was assessed daily by conventional microscopical examination as well as by flow cytometric analysis. A drop of blood from the rat tail was used to prepare thin and thick Giemsa-stained blood smears, and 2 independent microscopical examinations were performed on each slide. In parallel, a second drop of blood (10 μl) was collected directly into 0·3 ml of 1% heparinized isotonic buffer (PBS saline).
In the literature, 0·025–0·25% (v/v) glutaraldehyde has been used for fixation of malaria-infected mouse and human blood in FCM analyses (Barkan et al. Reference Barkan, Ginsburg and Golenser2000; Janse and Van Vianen, Reference Janse and van Vianen1994; Jimenez-Diaz et al. Reference Jimenez-Diaz, Rullas, Mulet, Fernandez, Bravo, Gargallo-Viola and Angulo-Barturen2005). In this study, 1 ml of glutaraldehyde (0·00625–0·8%) in PBS buffer was tested. The red blood cells were mixed with glutaraldehyde solution in various concentrations and stored at 4°C for 60 min. After selection of the optimum glutaraldehyde concentration; a range of incubation times (0·5 h-4 weeks) was also tested to evaluate the stability of cells after fixation. The cells were centrifuged at 450 g for 5 min. The supernatant was removed by aspiration, and the cells resuspended in 0·5 ml of PBS buffer supplemented with various Triton X-100 concentrations ranging from 0·016 to 2% (v/v) and left in this solution for 5 min at room temperature. The best concentration (0·25%) of Triton X-100 was selected for the permeabilization procedure.
After centrifugation, the permeabilized cells were resuspended in 0·5 ml of RNAse at various concentrations in the range of 0·02 to 2 mg/ml and incubated for at least 2 h at 37°C to ensure complete digestion of reticulocytes. P. berghei infection in rats causes them to become anaemic, which then results in reticulocytosis. The number of reticulocytes in the blood of control infected rats (without antimalarial agents) remained within the lower range, less than 8%, until day 6 post-infection (Xie et al. Reference Xie, Johnson, Weina, Si, Haeberte, Upadhyay, Wong and Li2005). The number of reticulocytes then increased to 50–70% of the parasitized red blood cells (RBC) in most rats after day 6 compared to a range 2–8% reticulocytes in the non-infected rats (Xie et al. Reference Xie, Johnson, Weina, Si, Haeberte, Upadhyay, Wong and Li2005), demonstrating the selective tropism of the P. berghei strain for reticulocytes. Therefore, high RNAse concentrations for digesting large amounts of reticulocytes RNA were required in this rat model.
YOYO-1 dye (from a 1 mm stock solution in DMSO, as supplied by the manufacturer) was diluted to various concentrations in PBS and each 20 μl of YOYO-1 solution in a different test dilution was added to 0·5 ml of sample to a final dye concentration ranging from 1·5 to 1600 nm. A concentration of 384 nm or 0·5 μg/ml of YOYO-1 was found to be optimal to discriminate infected erythrocytes to the highest parasitaemia counts (37·54%). The number of infected erythrocytes in the blood of infected rats remained within the range of 4 to 5% until day 7 post-infection. The number of infected erythrocytes then increased to 25–30% in most of the rats, and to 55–65% in approximately 30% of animals (Xie et al. Reference Xie, Johnson, Weina, Si, Haeberte, Upadhyay, Wong and Li2005).
FCM configuration for parasitaemia measurements
All flow cytometric analyses were carried out with a Cell Lab QuantaTM (Beckman Coulter, Fullerton, CA) equipped with a 2–22-mW 488-nm air-cooled laser diode. Infected erythrocytes, uninfected erythrocytes, and leukocytes were gated on logarithmic forward/side dot plots. Cells were analysed at an average rate of 2500 erythrocytes/s. Filters were placed before the green (FL-1) and red (FL-2) photomultiplier tubes (PMTs) such that the green PMT registered fluorescence emission between 520 and 555 nm, and the red PMT measured emission greater than 580 nm.
The system was critical in daily instrument setup and calibration. When the samples were measured by FCM, all samples of erythrocytes infected with P. berghei were used to model conditions without reticulocytes after treatment with RNAse. Blood from normal rats was stained in parallel with the test samples, so that adjustments to flow cytometer settings could be made in order to compensate for subtle changes in cell staining on a daily basis. While analysing malaria-infected blood samples, photomultiplier tube voltages and laser power were adjusted to maximize resolution between cells with and without malaria parasites, according to the instructions of the manufacturer. Ideally, parasites in reticulocyte should exhibit the same YOYO-1 associated fluorescence intensity as the parasites in normal RBC. Compensation of YOYO-1 emission in FL-2 is an essential step whose only objective is to set up the region of infected cell events accurately. The region of infected RBC must be empirically determined by comparison of blood samples from uninfected and malaria-infected rats by increasing compensation of YOYO-1 emission in FL-2 until a defined region for infected cell events is obtained. The software compensation was used according to the manufacturer's instructions.
Microscopy
Microscopical analysis of samples of peripheral blood from infected rats was performed in blood smears (thin and thick) stained with diluted Giemsa's stain according to a procedure described previously (Li et al. Reference Li, Si, Lee, Wong, Xie, Kyle and Dow2003). One thousand red blood cells were examined. The thick blood film provides enhanced sensitivity of the blood film technique and is much better than the thin film for detection of low levels of parasitaemia and reappearance of circulating parasites during infection and recrudescence.
Validation
The regions and values of uninfected RBC or parasitaemia obtained by uni-dimensional assessment of YOYO-1 fluorescence on FL-1 were examined for the absence of significant interfering peaks due to nucleated cells in rat blood. Specificity of the region of infected cell events by bidimensional FL-1/FL-2 analysis was defined by how well the population of parasitized erythrocytes fell into the analysis gate set. Therefore, adjustments of compensation levels as well as the optimizations of the RNAse and glutaraldehyde concentrations were required in this study.
Analytical accuracy in haematopathology compares the test by a gold standard, morphology (Jaffe, Reference Jaffe1999). The flow cytometric assessment must compare favourably to microscopy. On rare occasions, however, the morphological diagnosis shows complex phenotypes in populations such as malaria-infected rats with multi-parameter data such as single and multiple (invasion of single cell by multiple schizonts) infections in adult erythrocytes and reticulocytes. In addition, FCM allows the characterization and identification of cell-specific lineages by their qualitative staining patterns (Owens and Loken, Reference Owens and Loken1995). Descriptions of dim, moderate, and bright staining patterns can be diagnostic or prognostic and should be well characterized and documented for infected and uninfected erythrocytes, and for nucleated cells (WBC and lymphocytes).
Precision is a standard analytical parameter that measures the reproducibility of data points from a single sample stained and analysed in duplicate at least 10 times. To validate the FCM for parasitaemia, intra-day accuracy and precision were evaluated by analysis at various percentage levels on the same day. Eight different parasitaemia (0·02, 0·2, 0·5, 1, 8, 12, 24, 37%) levels were selected to cover the entire span of the calibration curve. The concentrations of parasites were calculated from the calibration curves, and the lower limits of detection and quantitation were given by the highest level of the calibration curve. To assess the inter-day accuracy and precision, the intra-day assay was repeated on 3 different days.
Parasitaemia sensitivity describes the ability to detect the minimum staining intensity above non-specific or negative staining (Steen, Reference Steen1991). The detection limit (DL) of an individual analytical procedure is the lowest amount of parasitaemia in a sample that can be detected but not necessarily quantitated as an exact value. The quantitation limit (QL) is the lowest amount of analyte in a sample that can be quantitatively determined with suitable precision and accuracy.
The QL for this method is equivalent to the low point of the low range standard curve. The inter-day limit of quantitation was evaluated by taking the 5 back-calculated lowest standard calibration concentrations that were obtained in the inter-day precision study and presenting the mean, SD, CV and RE as the inter-day results. The intra-day limit of quantitation was evaluated by analysis of the 5 lowest standard calibrators and a complete set of standard curve calibrator samples run together within 1 day (or 1 run) and presenting the mean, SD, CV and RE as the intra-day result.
Calibration curves were prepared in the parasitaemia range of 0·04 to 36% (n=4, at each level) for malaria-infected blood from rats. The serial dilutions (vol/vol) of blood from 4 P. berghei-infected rats were made with blood from uninfected rats. The initial parasitaemia of the infected animal was 36·0% (measured by both microscopy and FCM) and the infected blood was serially diluted doubly in PBS to a theoretical parasitaemia of 0·00014%. The lower calibration curve extended from 0·04 to 0·6% parasitaemia with standard values at 0·04, 0·075, 0·15, 0·3, and 0·6%, and the higher calibration curve extended from 1·2 to 18% with standard values at 1·2, 2·4, 4·5, 9, and 18%. The calibration curve was linearly fitted and weighted by 1/concentration with examination of the correlation coefficient. Percentages of parasites in subsequent test samples were calculated from the calibration curve.
Antimalarial evaluation with microscopy and FCM
To validate this method, the main antimalarial drugs (AS and PQD-A4) were used to treat rat infections. Groups of 5–7, randomized, 7-week-old rats were infected with 2×10⁷ parasitized erythrocytes. Only rats found to be infected with P. berghei, i.e. no rats negative to infection or rats which (by microscopy) were still subpatent on day 6 post-infection, were given AS or PQD-A4 (drug vehicle and variable doses shown in Fig. 6) intragastrically or intravenously (1·0 ml drug solution/kg) on days 6, 7 and 8 post-infection. The general experimental design was similar to previously published efficacy studies using young adult rats (Li et al. Reference Li, Si, Lee, Wong, Xie, Kyle and Dow2003). General health status of the animals was monitored daily. The parasitaemia was determined daily during days 6 through 12, post-administration, and every other or third day thereafter. The experiments were terminated on day 28 (as by this time surviving rats would have cleared their infections).
Data analysis
The primary determination was the traditional microscopy method. Thin and thick smears were prepared from tail blood, air dried, fixed with methanol, stained with Hema 3 according to the manufacturer's instructions, and then examined under oil at 1000× magnification.
RESULTS
Determination of the regions in bidimensional analysis
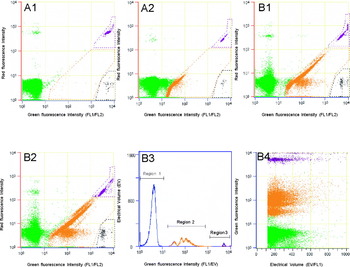
Preparation and staining of parasitized erythrocytes were performed using a modification of the original method described by Barkan et al. (Reference Barkan, Ginsburg and Golenser2000) and Jimenez-Diaz et al. (Reference Jimenez-Diaz, Rullas, Mulet, Fernandez, Bravo, Gargallo-Viola and Angulo-Barturen2005). The infected RBC showed a characteristic pattern of staining different from that of uninfected and nucleated cells in the bidimensional analysis (Fig. 1A1 and B1) with an appropriate compensation (2·4% YOYO-1/FL2). Undercompensation reduces fluorescent resolution between infected erythrocytes and uninfected RBC cells. Overcompensation can result in the loss of infected RBC from the nucleated cells. Results obtained from P. berghei-infected rats (Fig. 1B3) display a histogram of cell counts of increasing fluorescence intensities in which the infected cells (middle peaks, region 2) are clearly separated from uninfected cells (left peaks, region 1) and also nucleated cells (right peaks, region 3). The parasitized, unparasitized, and nucleated populations were completely isolated in the bottom, middle, and top regions, respectively (Fig. 1B4). The specificities of the 3 regions were calculated in the range of 98·5 to 99·4% on validations of the infected, uninfected, and nucleated populations.
Flow cytometry analysis of erythrocytes and nucleated blood cells of YOYO-1 stained with bivariate graphs (YOYO-1/FL2) from uninfected (A) or Plasmodium berghei-infected rats with (B). A1: Uninfected blood with RNAse shows RBC as a green population, nucleated WBC and lymphocytes in the black and purple regions, respectively, and reticulocytes in the orange region (0·03%). A2: Same uninfected blood without RNAse shows 5·6% of reticulocytes as orange population. B1: Infected blood with RNAse exhibited 19·2% parasitaemia at day 8 after infection. B2: Same infected sample (B1) without RNAse exhibited 31·8% parasitaemia plus reticulocytes. B3 and B4: Complete separation of the three regions or populations of the sample (B3) in region 1 (uninfected RBC, green population), 2 (infected parasitaemia, orange population), and 3 (nucleated cells, black and purple populations) by a bidimensional analysis of YOYO-1 fluorescent intensity.

Optimizations of sample preparation
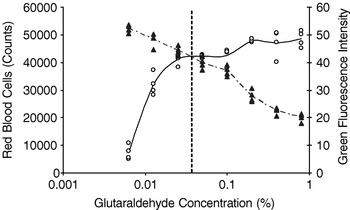
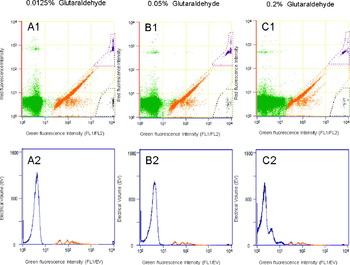
Various options of fixation, permeabilization, RNA digestion, and YOYO-1 staining were investigated. The most important parameters to be optimized from the original staining procedures (Barkan et al. Reference Barkan, Ginsburg and Golenser2000; Jimenez-Diaz et al. Reference Jimenez-Diaz, Rullas, Mulet, Fernandez, Bravo, Gargallo-Viola and Angulo-Barturen2005) were cell fixation and RNA digestion of reticulocytes in the malaria infected rat model. The optimal concentration of glutaraldehyde to obtain maximum resolution between uninfected and infected erythrocytes was assessed. This was done to increase the difference in relative fluorescence intensity for staining malaria nucleic acid versus uninfected events, as well as to reduce haemolysis or cell lysis induced by glutaraldehyde. Figure 2 shows that lowering the concentration of glutaraldehyde resulted in significant cell lysis with a decrease of RBC and a statistically significant increase of the intervals in intensity between the cell populations from region 1 (uninfected RBC, green in Fig. 3A1–C1) to region 2 (infected RBC, orange in Fig. 3A1–C1). At 0·0125% glutaraldehyde, the interval between the 2 region peaks (blue and left orange peaks) was 48·5 (from 7·8 to 56·3) intensities (Fig. 3A2), and the haemolysis was 31·3% (Fig. 2). The two populations (green and orange) were clearly separated (Fig. 3A1). When the concentration of glutaraldehyde was increased to 0·05%, the interval was reduced to 39·9 (from 7·9 to 47·8) intensities (Fig. 3B2) and the haemolysis to 8·8% (Fig. 2) at the middle dose. The 2 regions still exhibited good separation (Fig. 3B1). However, at a high level of glutaraldehyde (0·2%), a short interval (27·8 intensities from 14·5 to 42·3) in fluorescence intensity was found (Fig. 3C2), and the haemolysis was not affected (Fig. 2). In this instance the 2 populations were not separated (Fig. 3C1). Therefore, the maximum resolution to minimize haemolysis and to obtain the highest possible interval or separation in intensity was obtained using a glutaraldehyde concentration of 0·04% (Fig. 2).
Assessment of the optimum concentrations of glutaraldehyde as a fixative agent for FCM using YOYO-1 staining is shown for RBC. Sample blood from Plasmodium berghei-infected rats was fixed with increasing concentrations of glutaraldehyde. The figure demonstrates that haemolysis of RBC is increased (empty circle and solid-line) at low glutaraldehyde concentrations. The YOYO-1 fluorescence intensity in intervals between the cell peaks from region 1 (uninfected RBC in green colour) to region 2 (infected RBC in orange colour) populations (triangle and dashed-line) (Fig. 1) is increased and decreased at low and high, respectively, glutaraldehyde concentrations. The sample shown was fixed at the optimal glutaraldehyde concentration (0·04%, vertical dashed line), which keeps haemolysis to a minimum whilst maintaining the widest possible separation (intensity) between the two regions in the present study.

Optimal resolution achieved and regions deployed to calculate mean fluorescence intensity from the YOYO-1 positive population (infected RBC and nucleated cells) with respect to uninfected RBCs. Bidimensional analysis of YOYO-1 fluorescent intensity of samples from Plasmodium berghei-infected rats with increasing concentrations of glutaraldehyde (A–C). A1–2: at low concentration (0·0125%) of glutaraldehyde, a clear separation (long distance) between the region 1 (green in A1 or blue in A2) and region 2 (orange) populations is displayed but with high percentage (31·3%) of haemolysis; B1–2: at middle concentration (0·05%) there still is good separation (short distance) between the two regions with light haemolysis (8·8%) occurring; C1–2: at high level (0·2%) of glutaraldehyde there is significantly no separation between the two regions and no haemolysis (0%).

Compared to the original sample preparation (Barkan et al. Reference Barkan, Ginsburg and Golenser2000; Jimenez-Diaz et al. Reference Jimenez-Diaz, Rullas, Mulet, Fernandez, Bravo, Gargallo-Viola and Angulo-Barturen2005), the sample incubation with 0·5–1 mg/ml of RNAse A for 30 min at room temperature was not enough to digest high levels (>30 and up to 74%) of reticulocytes in malaria-infected rat blood samples in the present study (Vigario et al. Reference Vigario, Belnoue, Cumano, Marussig, Miltgen, Landau, Mazier, Gresser and Renia2001). Our data indicated that to digest all reticulocytes completely in rat samples (some up to 56·3%) in 10 μl of blood, the incubation should last at least 2 h with 1 mg/ml of RNAse at 37°C.
Sensitivity and linearity
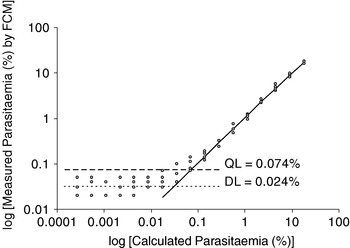
The increased specificity of YOYO-1/FL2 analysis could significantly improve the accuracy and sensitivity of the measurements of parasitaemia in terms of reproducibility and lower quantitative limitation. Calibration curve parameters for parasitaemia in the malaria-infected rat model are shown in Fig. 4. Results were calculated using various levels of parasitaemia from 4 individual rats. Calibration curves for parasitaemia were linear using weighted (1/concentration) linear regression in the concentration range of 0·02 to 18·0% on 4 rats with a mean correlation coefficient (r2) greater than or equal to 0·999 for all curves. Different numbers of infected erythrocytes were obtained to establish the limits of sensitivity of the techniques. In the present assay, the data analysed were found to be linear from 0·02% to 36·0% parasitaemia and the detection limit (DL) of the YOYO-1 method was 0·024% (Fig. 4), measured as the percentage parasitaemia detectable as background concentration, which is similar to uninfected control samples (Table 2). The quantitative limit (QL) can be calculated as 0·074% (Fig. 4), which measured as the percentage of parasitaemia to be detected 3·3-fold over the detection limit in according with FDA Guidance (Guidance for Industry, 1996).
Sensitivity of detection from calibration curves of Plasmodium berghei-infected erythrocytes from 4 separate rats. Parasites counted by flow cytometry were compared with the parasitaemia calculated from the initial parasitaemia and the dilution factor. The detection limit (DL) and quantitative limit (QL) were determined from the background using the bidimensional FL-1 (YOYO-1)/FL-2 method with the decimal logarithm of the mean of duplicate samples for each dilution tested (n=4).

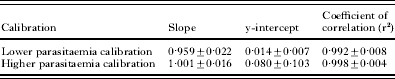
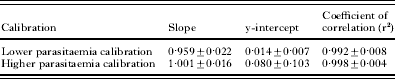
The lower and higher parasitaemia calibrations were also analysed in this study, and the parameters for parasitaemia are listed in Table 1. Calibration curves for lower and higher parasitaemias were linear with the correlation coefficient (r2) greater than or equal to 0·992 and 0·998, respectively for all curves (Table 1), suggesting that the method is well suited for detection of low and high parasitaemia in the malaria-rat model.
Assay of linearity of the flow cytometry method on lower parasitaemia (0·05–0·60%) and higher parasitaemia (1·2–18%) samples by calibration curves
(The calibration curve was linearly fitted and weighted by 1/concentration with examination of the correlation coefficient, n=4.)
Accuracy and precision
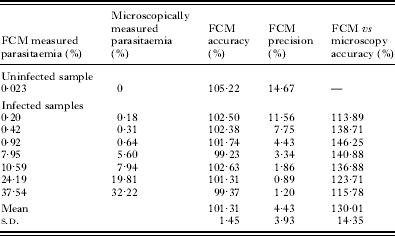
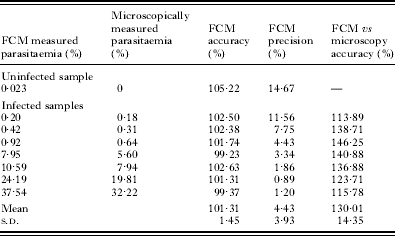
The accuracy and precision measured the reproducibility of single samples stained and analysed in duplicate at least 10 times compared to FCM measurements, and the data are shown in Table 2. The inter-day coefficients of variation (precision) for parasitaemia samples (uninfected control, 0·20, 0·42, 0·92, 7·95, 10·59, 24·19, and 37·54%) measured by FCM were 14·67, 11·56, 7·75, 4·43, 3·34, 1·86, 0·89, and 1·20%, respectively. The accuracy for parasitaemia analysed by FCM was in the range 99·37 to 105·22%. The data obtained for parasitaemia obtained by FCM were well within the acceptable limits to meet guidelines for bioanalytical methods and validation (Guidance for Industry, 2001).
Accuracy and precision assessments of parasitaemias from individual Plasmodium berghei-infected rats by using validation analysis via the reproducibility of a single sample stained and analysed in duplicate at least 10 times
(Accuracy: 100% measured parasitaemia/nominal parasitaemia from flow cytometry or microscopy methods; FCM: flow cytometry.)
Accuracy of FCM compared to microscopy
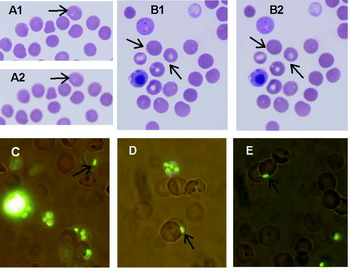
The parasitaemia measured by FCM was in the range from 113·89 to 146·25% (Table 2) when calculated relative to microscopy counts being 100% in the same sample. After having analysed 574 samples from infected rats in the experiments during our methodological evaluation, we found that most of the parasitaemias read by FCM were, on average, 30% higher than the counts from microscopy. The differences observed may be explained by the fact that microscopy is a subjective technique and many cells that do not show a healthy morphology may be discarded during counting, whereas FCM detects parasites irrespective of their health status (Jimenez-Diaz et al. Reference Jimenez-Diaz, Rullas, Mulet, Fernandez, Bravo, Gargallo-Viola and Angulo-Barturen2005). In fact, we found some schizont-like cells attached to the membranes of normal RBCs (Fig. 5A1 and B1) under light microscopical observation. The same slides were also shown to have tiny stains of Giemsa dye in the schizonts after adjusting the focus (Fig. 5A2 and B2). After staining with YOYO-1 and analysis by fluorescent microscopy, the slides showed that the schizonts were attached to the RBC membranes (Fig. 5C–E). If these particles are indeed schizonts, then the parasites would never be counted by microscopy in our experience. Although these schizonts remain to be confirmed via further investigation, the finding may be provide a plausible explanation for the high parasitaemia detected by flow cytometry.
Photomicrographs of Plasmodium berghei-infected rat erythrocytes at day 5 post-infection. (A and B) Light microscopy with Giemsa-stained blood smears. Arrows identify schizonts penetrating or re-invading the RBC on its membrane surface (A1 and B1), and Giemsa-stained nuclei in the schizonts (A2 and B2). (C–E) Fluorescent microscopy. Arrows are used to identify the schizonts on the erythrocyte surface membrane. We consider that these (pre-infection) parasites are attached to, but definitely not inside the erythrocyte. In our laboratory such cells would never be included in a parasitaemia count determined by microscopy but could well be measured by FCM.

Application of parasitaemia measurement by FCM
The staining and FCM procedure utilized in this study has been used to determine the antimalarial effects of artesunate (AS) and pyrroloquinazolinediamine (PQD) in P. berghei-infected rats. Once parameters were established with the malaria-infected blood, experimental samples were analysed to determine the correlation between FCM- and microscopy-generated data. In these experiments, animals were dosed with 2 different drugs (AS and PQD) and blood samples were collected for both flow cytometric and microscopical analyses. Four profiles were examined, as follows from (1) an infected animal without antimalarial agent and from animals treated with (2) suppressive and clearance (AS 50 mg/kg); (3) 100% clearance (AS 100 mg/kg) and (4) curative regimens of antimalarial agents and compared using the two assays. The microscopically determined parasitaemia frequencies were then compared with the corresponding FCM counts. Regression analysis was performed to determine the correspondence between methods. The resulting r2 values of 1·000 indicated a high degree of linear correlation between these 2 methodologies.
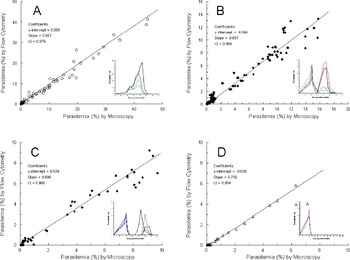
Results obtained from P. berghei-infected rats are shown in Fig. 6. Twenty-one measurements per rat were done on samples taken from 4 untreated infected animals, and showed a direct correlation (r2=0·976) between cytometric and microscopical determinations (Fig. 6A). After treatment with AS 50 mg/kg daily for 3 days intravenously, suppressive effects were shown in the 4 animals (re-plot graph in Fig. 6B), and the correlation coefficient (r2) was greater than or equal to 0·964 for the curve (Fig. 6B). When the dose was increased to 100 mg/kg per day, AS cleared the parasites in 2–3 days in the 4 infected animals and then the animals displayed recrudescence (re-plot graph in Fig. 6C). The correlation coefficient (r2) was greater than or equal to 0·988 for these animals (Fig. 6B). Following intragastric administration of PQD at 10 mg/kg daily for 3 days in 2 infected rats, a curative effect was apparent in these animals (re-plot graph, Fig. 6D) with a correlation (r2=0·954) between the two methods.
Correlations (r2=0·954–0·988) are shown between flow cytometry and microscopical determination of parasitaemia in Plasmodium berghei-infected rats treated with the following antimalarial drugs or control. Samples (markers) were taken from the vehicle control group in 4 rats (A), treatment group with intravenous artesunate at 50 mg/kg showing suppression effect (re-plot graph) in 4 rats (B), treatment group with intravenous artesunate at 100 mg/kg showing clearance effect (re-plot graph) in 4 rats (C), and treatment group with oral pyrroloquinazolinediamine at 10 mg/kg showing curative effect (re-plot graph) in 2 rats (D). The line represents linear regression whose statistical parameters are shown in the inset (A–D). The control animals received vehicle and the treatment animals received drugs at daily intervals on day 6–8 post-infection with P. berghei.

DISCUSSION
The need for improved malaria diagnostics has long been recognized. Acknowledging these needs, many flow cytometric assays using different DNA-specific dyes have been tried. Several reports show that YOYO-1 is better able than Hoechst 33258 to differentiate easily between uninfected and infected RBC when parasitaemia is low or high (Whaun et al. Reference Whaun, Rittershaus and Ip1983; Barkan et al. Reference Barkan, Ginsburg and Golenser2000). With YOYO-1, the total fluorescence intensity in a parasite is 100–200 times less than that of nucleated blood cells. Therefore, the nucleated blood cells can easily be distinguished from infected cells on the basis of the difference in the fluorescence intensity (Janse and Van Vianen, Reference Janse and van Vianen1994). These features make YOYO-1 an extremely sensitive nucleic acid dye compared with many of the aforementioned dyes, a property that can be very useful in FCM (Hirons et al. Reference Hirons, Fawcett and Crissman1994; Jimenez-Diaz et al. Reference Jimenez-Diaz, Rullas, Mulet, Fernandez, Bravo, Gargallo-Viola and Angulo-Barturen2005).
To avoid haemolysis due to lysis by glutaraldehyde (Mojzis et al. Reference Mojzis, Nicak, Linkova, Jandosekova and Mirossay1999; Lemieux et al. Reference Lemieux, Avrameas and Bussard1974), the use of glutaraldehyde as fixative agent should be at the lowest concentration possible. The concentration of glutaraldehyde (0·04%) selected in our assay format was different from the concentration (0·025%) reported by Barkan et al. (Reference Barkan, Ginsburg and Golenser2000) and Jimenez-Diaz et al. (Reference Jimenez-Diaz, Rullas, Mulet, Fernandez, Bravo, Gargallo-Viola and Angulo-Barturen2005) and the higher concentration (0·25%) described by Janse and Van Vianen (Reference Janse and van Vianen1994) and Barkan et al. (Reference Barkan, Ginsburg and Golenser2000). The concentration recommended in these studies did not allow for optimal discrimination between infected and uninfected erythrocytes in our analysis conditions. Low glutaraldehyde concentration could increase the difference in fluorescence intensity to keep the separation of the infected region from the uninfected region. However, the difference in concentration of glutaraldehyde has significance in cell lysis for the samples on the test. The best concentration obtained in our laboratory was 0·04%, which minimized cell lysis and maximized the distance between the two regions.
Our experiments revealed that the background signal obtained using uni-dimensional YOYO-1 determination was low (<0·05% in all cases) compared to the high and highly variable background signals (<1% and up to 4%) reported in previous studies (Barkan et al. Reference Barkan, Ginsburg and Golenser2000; Jimenez-Diaz et al. Reference Jimenez-Diaz, Rullas, Mulet, Fernandez, Bravo, Gargallo-Viola and Angulo-Barturen2005). The stable and clear background in this study was related to the optional concentrations of glutaraldehyde and RNAse. Under substantial reticulocytosis in rodent malaria, large amounts of RNA are present which could contribute to the parasite-derived signal, thus producing some false positive readings or high background noise. Therefore, in this study, treatment of permeabilized infected and uninfected cells with active RNAse was used for reduction or clearance of the background. Our data indicated that in order to completely digest up to 56·3% of the reticulocytes in 10 μl of blood, incubation for at least 2 h with 1 mg/ml of RNAse at 37°C was necessary. These conditions completely abolished an RNA-derived signal. Compared to the original sample preparation (Barkan et al. Reference Barkan, Ginsburg and Golenser2000; Jimenez-Diaz et al. Reference Jimenez-Diaz, Rullas, Mulet, Fernandez, Bravo, Gargallo-Viola and Angulo-Barturen2005), sample incubation with 0·5–1 mg/ml of RNAse A for 30 min at room temperature might not be enough to digest high levels (>30% and up to 74%) of reticulocytes for malaria-rat samples in the present study (Vigario et al. Reference Vigario, Belnoue, Cumano, Marussig, Miltgen, Landau, Mazier, Gresser and Renia2001).
The integrated YOYO-1 fluorescence intensity of each cell population after RNAse treatment was subtracted from the fluorescence intensity of the cell population measured prior to RNAse treatment. This RNAse-specific differential value of fluorescence (differential fluorescence) was plotted against the cell fluorescence measured after RNAse treatment. However, appropriate compensation of YOYO-1 emission in FL-2 could be set up to delineate the regions of infected and uninfected events accurately. In this study, typical values of compensation in FL-1 (YOYO-1) were obtained for optimal resolution between infected and uninfected populations after RNAse treatment.
In this assay, the clear background levels produced a detection limit at 0·024% parasitaemia. The high sensitivity obtained allowed the flow cytometric approach to be used to evaluate the efficacy of novel antimalarial drugs routinely in our laboratory. The expected sensitivity that can be achieved by an experienced microscopist in the examination of a thick blood film is about 50 parasites/μl of blood, which is equivalent to 0·001% of infected RBCs (Moody, Reference Moody2002). Milne et al. (Reference Milne, Kyi, Chiodini and Warhurst1994) found that most routine diagnostic laboratories generally achieved a lower sensitivity of detection (average, 0·01% RBC infected, 500 parasites/μl). The detection limit by FCM (0·024%) in the present study is about 2-fold higher than that by microscopy (0·01%). Therefore, this FCM approach had an acceptable sensitivity. Although the quantitation limit is 0·074% parasitaemia, the statistical significance was also achievable. The FCM with YOYO-1 has been used for 4 experimental studies in our laboratory. In total, 574 samples from rats infected with P. berghei in experiments on antimalarial activity were analysed using this technique and the results demonstrated that this procedure is sensitive and reproducible. Therefore, the correlation found between microscopy and FCM assays was strong (r2=0·954–0·988).
The mean parasitaemia determined by the FCM approach was slightly higher (30%) than those determined microscopically. It is not surprising that the FCM method gave higher values (3–92%), as this is the case in almost all studies when compared to microscopical data (Barkan et al. Reference Barkan, Ginsburg and Golenser2000; Jimenez-Diaz et al. Reference Jimenez-Diaz, Rullas, Mulet, Fernandez, Bravo, Gargallo-Viola and Angulo-Barturen2005; Janse and van Vianeb, Reference Janse and van Vianen1994; Wongchotigul et al. Reference Wongchotigul, Suwanna, Krudsood, Chindanond, Kano, Hanaoka, Akai, Maekawa, Nakayama, Kojima and Looareesuwan2004; Franklin et al. Reference Franklin, Brun and Grieder1986; Sanchez et al. Reference Sanchez, Mota, Sultan and Carvalho2004; Kadjoian et al. Reference Kadjoian, Gasquet, Delmas, Guiraud, De Meo, Laget and Timon-David1992; Contreras et al. Reference Contreras, Rivas, Dominguez, Charris, Palacios, Bianco and Blanca2004). We carefully checked many facts including using multiple microscopists, but the values obtained were the same. However, the microscopist did find many tiny particles attached to normal RBC membranes in the infected blood slides. These particles look like vacuoles around the RBC. After adjusting the focus on the microscope, the Giemsa-stained nucleus could be seen within the schizonts. We thought that the particles may be schizonts from blood-induced infection starting to reinvade the RBC. After staining with YOYO-1, a DNA dye, the same samples were viewed in parallel by fluorescence microscopy. The same particles with fluorescence induced by DNA dye were attached on the membranes of normal RBCs as seen on the Giemsa-stained slides. These parasites, if not definitely inside the erythrocyte, would never be included in parasitaemia counts by light microscopy in our laboratory, but could be measured by flow cytometry.
Based on data reported herein, the lower sampling error and reliable identification of rodent erythrocyte parasites based on the principles of the FCM have replaced the traditional blood smear method in our laboratory. The assay has been validated, and the results of validation show that the method is reproducible and accurate within the acceptable limits to meet guidelines for the validation of bioanalytical methods (US FDA Guidance for Industry, Q2B Validation of Analytical Procedures, 1996). This finding suggested that the high quantitation limit (0·07% parasitaemia) produced with the FCM method compared to microscopy (0·01%) is due to background signals in the blood, which may interfere with the performance of the FCM. Further improvement, by eliminating this interference, will make the FCM one of the most promising tests for malaria diagnosis in rodents.
Material has been reviewed by the Walter Reed Army Institute of Research. There is no objection to its presentation and/or publication. The opinions or assertions contained herein are the private views of the author and are not to be construed as official, or as reflecting true views of the Department of the Army or the Department of Defense.