I. INTRODUCTION
Eu2+ doped alkaline earth aluminates, MAl2O4:Eu2+ (M = Ca and Sr), a new generation of persistent luminescence phosphors, have been widely developed since the mid 1990s to replace ZnS:Cu phosphors.Reference Palilla, Levine and Tomkus1–Reference Qiu, Gaeta and Hirao4 Among these alkaline earth aluminates phosphors, SrAl2O4:Eu2+,Dy3+ phosphors are the best developed so far, and they have been commercially used in safety, emergency, transportation and other fields because of their excellent long persistence.Reference Murayama, Takeuchi, Aoki and Matsuzawa5 The phosphors show a strong broad green emission characteristic of the Eu2+ ion, and the lifetime of these phosphors can be as long as 10 h at ambient temperatures. By contrast, ordinary Eu2+ doped material more typically has lifetimes of the order of a few hundred nanoseconds.Reference Kshatri and Karhre6 To understand the mechanism on the long afterglow phosphorescence research work has been carried out by several groups.Reference Jia, Yuan, Lu, Liu and Yen7–Reference Clabau, Rocquefelte, Jobic, Deniard, Whangbo, Garcia and Le Mercier9 Different explanations about the mechanism on the long afterglow phosphorescence have been proposed, but a consistent view is that the introduction of Dy3+, leads to a defect trapping level with a trap that is slowly thermally excited at room temperature. Recombination and luminescence then proceeds at the Eu site. The presence of dopants controls the volume of the distortions around the emission site. We also assume that this is a preferential charge transfer from the trap to the recombination site as the distortion offers directional charge motion; hence there is high luminescence efficiency, and the implication that the Eu and Dy are in close proximity.
The overall mechanism of the persistent luminescence from SrAl2O4:Eu2+,Dy3+ is a widely accepted model, but the details are largely unknown. Since the thermoluminescence (TL) technique can reveal information on the trap and color centers within the materials, it has been applied to study the mechanism of long lifetime phosphors.Reference Katsumata, Nabae, Sasajime and Matsuzawa10–Reference Aitasalo, Jungnerd, Lastusaari and Niittykoski13
Trap depth is a key factor in this process, but there is a difference in analytical approach between those using the materials for radiation dosimetry, and those following the more detailed processes. For example, the dosimetry material scientists sometimes very roughly estimate the activation energy, in eV, by the numerical value of T m/500,Reference Chen14 where T m is the TL glow peak temperature obtained at a high heating rate. This approximation is too imprecise for detailed studies. It also ignores the very large temperature lag between heater and sample, when using high heating rates.Reference Ege, Wang and Townsend15 Further, dosimetry requirements increase the signal intensity by using broad band polychromatic light, whereas many phosphors emit a range of emission bands that vary with temperature. Each of the sites will display different trapping kinetics and different T m values. So a polychromatic composite value cannot offer a correct trap depth, as there may be several traps and emission bands with different activation energies. To offer more details, spectra are reported here, which were obtained at a low heating rate. Additionally, spectral analysis of TL obtained at low heating rates offers further insights into the differences in luminescence behavior between different variants of the phosphor.
Previous studies have indicated that collecting the TL spectra at low temperature adds considerably by both monitoring the intrinsic defectsReference Wang, Can and Townsend16–Reference Raymond and Townsend19 and revealing the presence of inclusions. Similarly, radioluminescence (RL), obtained during heating whilst exciting the materials with x-rays, discloses a range of imperfections that may not be evident in the more limited TL data.
SrAl2O4:Eu2+,Dy3+ with addition of A1N (here labeled as “SAO”) and commercially used SrAl2O4:Eu2+,Dy3+ phosphor material (labeled as “CP”) were studied in this work. Both materials show green phosphorescence after being exposed to natural light. However, “CP” samples show more intense and longer lifetimes. Their TL glow curves are very similar above room temperature. Thus, both TL and RL spectra over large temperature range (25–673 K) were obtained to investigate how they differ.
II. EXPERIMENTAL
The SrAl2O4:Eu2+,Dy3+ sample (SAO) used in this work is phosphor with a nominal composition of Sr0.95Al2+xO4Nx:0.02Eu2+,0.03Dy3+ (x = 0.2). CP is the commercially used SrAl2O4:Eu2+,Dy3+ sample with the same doping concentration. The SAO material was prepared by a high temperature solid-state reaction. According to the stoichiometric ratio, the raw material of SrCO3, Al2O3, Eu2O3 (99.99%), Dy2O3 (99.9%), A1N (99.9%) was mixed in an agate mortar. The mixture was then placed in an alumina crucible and fired at 1400 °C for 2 h under a reducing atmosphere (N2:H2 = 9:1) in a horizontal tube furnace. After cooling down naturally, the fired samples were ground and prepared for measurements. The structural and morphological study shows that the average particle size of SAO sample is ∼1.36 micron and the unit cell volume is 380.8 Å3 (0.38 nm3). The detail of this sample was reported by Xia's group.Reference Ma, Xia and Liu20
TL spectra and RL signals excited by x-rays were collected with a high sensitivity luminescence system over the wave length range from 200 to 800 nm, at the University of St Andrews. The optics of this spectrometer had been previously described from its original construction at Sussex,Reference Luff and Townsend21 but significant modernization improvements in detectors and time resolution are now available in the upgraded St Andrew's system.Reference Finch, Wang, Townsend and Ingle22 TL data were collected after the samples were irradiated by x-rays with an irradiation dose of 5 Gy. RL spectra were obtained during heating while the sample was excited by the x-ray tube with an operation voltage of 15 kV and current of 10 mA.
Two different temperature stages were used during the study. The low temperature stage operates from 25 to 300 K and a high temperature stage was from room temperature to 400 °C. So the total temperature range is from 25 to 673 K. During both RL and TL experiments, a heating rate of 15 K/min was used for the high temperature stage, but a lower rate of 6 K/min for the low temperature stage (since the thermal conductivity is poor within this range). These modest heating rates ensured that the monitored temperature was matched by the surface temperature of the sample. The rates are low, in contrast with the commonly used higher rates used in many other measurements. High rates are acceptable for dosimetry where only the total signal is of interest, but rapid heating results in major temperature gradientsReference Ege, Wang and Townsend15, Reference Wang and Townsend23 and so are inappropriate for the more fundamental investigations of the current work.
III. RESULTS
A. High temperature TL data
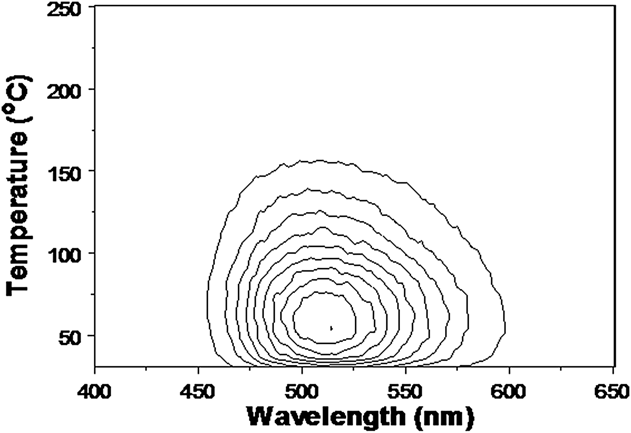
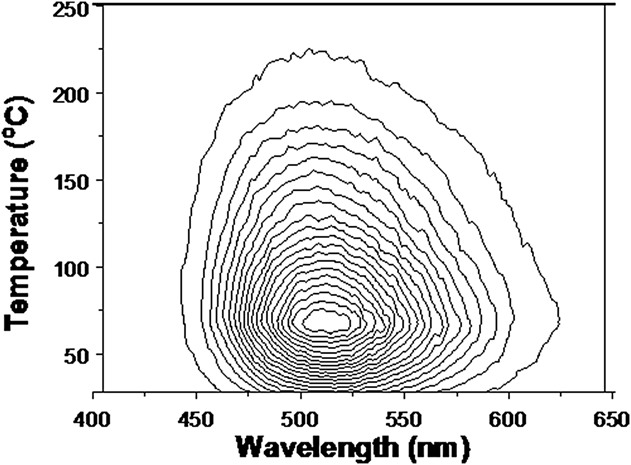
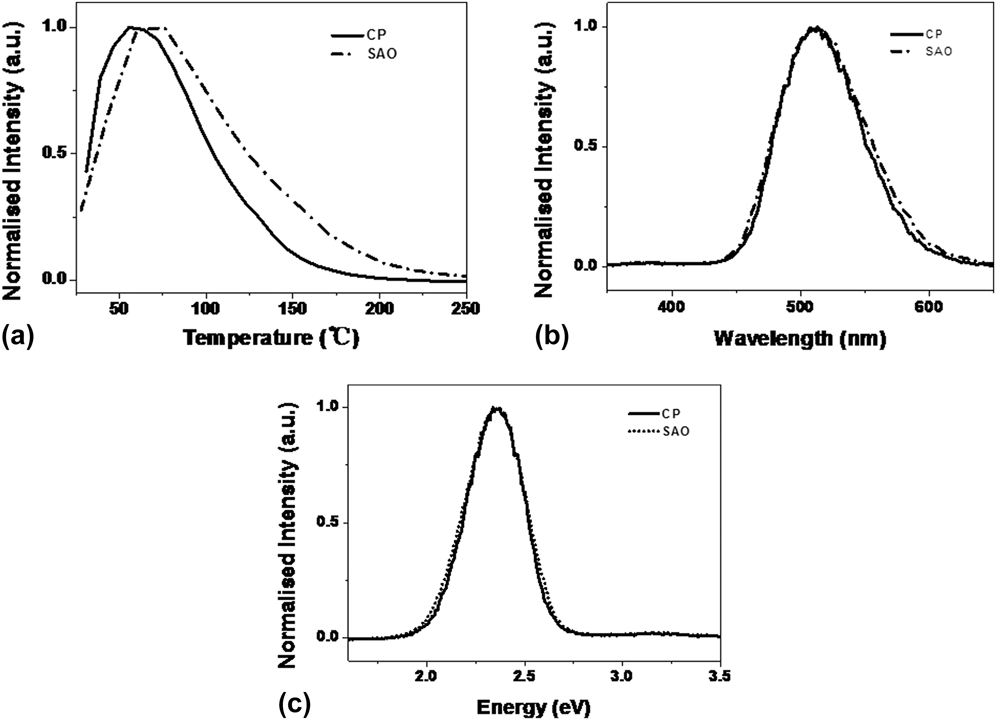
Results of high temperature TL spectra of commercially used SrAl2O4:Eu2+,Dy3+ (CP) are presented in Fig. 1 in the form of a contour map. Equivalent data for SrAl2O4:Eu2+,Dy3+ with the addition of A1N (SAO) are shown in Fig. 2. The CP samples exhibited a broad green emission band of 514 nm. For the SAO sample the peak is shifted to 511 nm. The peak temperatures also differ, being 56 °C for the CP samples, whereas the peak is at 76 °C for “SAO” material. The shift between peak temperatures of two samples are shown by Fig. 3(a), and the small emission spectral differences are presented in Fig. 3(b). Visual inspection of the collected data in terms of wave length (λ) offers I(λ)dλ versus λ. This is not ideal as the science requires an energy view of I(E)dE versus E.Reference Zhao, Zhou, Jiang, Zhou, Finch, Townsend and Wang17 Invariably the wave length presentation is distorted and broadened at longer wavelengths. In the energy domain plot, the true band is symmetric, as shown by the transformation to the energy plot of Fig. 3(c).
Contour TL spectra of commercial SrAl2O4:Eu2+,Dy3+ phosphors (CP).

Contour TL spectra of SrAl2O4:Eu2+,Dy3+ with A1N addition (SAO).
TL comparison of the CP and SAO samples; (a) TL glow curves, (b) emission spectra and (c) their transformation into energy plots.
The shift in peak temperatures between CP and SAO samples may well imply a deeper trapping site, and therefore a slower release rate of electrons stored there at ambient temperature. This would be consistent with the longer persistence time of the “SAO” phosphorescence. However the simplistic view of charge release from a trap, with long range transport to an emission site is naïve. Doping materials with the rare earth and A1N produce considerable distortion in the lattice and the stress field will be apparent in two ways. The first is that the emission spectrum will be displaced. Here, there is evidence of this in the shift from 511 to 514 nm, which for rare earth ions implies a significant change in the local crystal field. The second factor is that the stress will induce preferential charge motion from the trap to the emission site. This enhances, or alters, the overall efficiency. Greater stress can allow access to more distant variants of the same trap structures. Less obvious is that the coupling efficiency will also be linked via the extent of the excited states of the emission sites. Higher states will generally be more extensive, as shown in a recent example of Eu doped magnesium orthosilicate.Reference Townsend, Yang and Wang24
B. High temperature RL data
X-ray excited RL will activate more processes than the TL. When obtained during heating, RL will show a mixture of temperature dependent luminescence efficiency, and a contribution from TL excitation at the commencement of the heating cycle. RL data during heating above room temperature are shown in Fig. 4 and 5. Isometric RL spectra and contour spectra of sample “CP” are displayed in Figs. 4(a) and 4(b). Figures 5(a) and 5(b) are the isometric and contour RL spectra for the “SAO” material.
Isometric RL spectra (a) and contour spectra (b) of commercial (CP) SrAl2O4:Eu2+,Dy3+ phosphors.
Isometric RL spectra (a) and contour spectra (b) of SrAl2O4:Eu2+,Dy3+ with A1N (SAO).
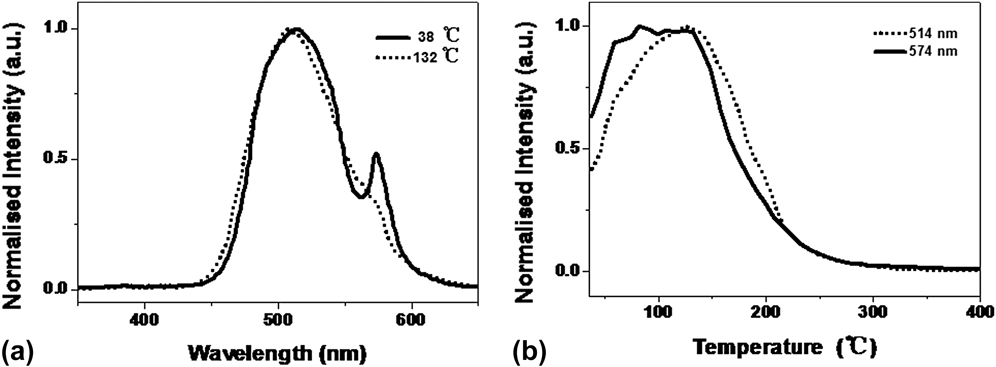
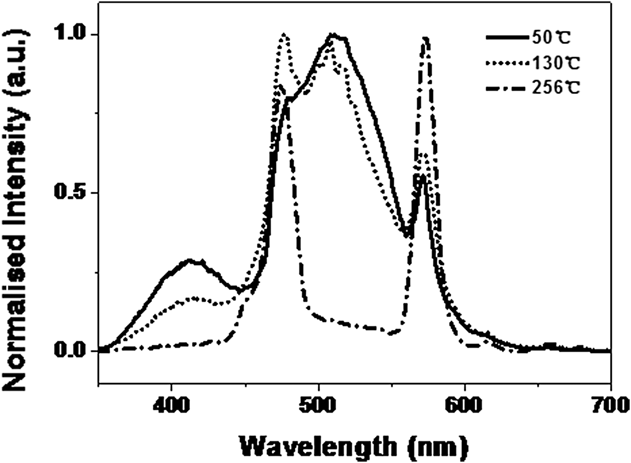
For the CP material, the RL spectra during heating strongly resemble the TL emission, although in the RL case, there is a shoulder at 574 nm on the main emission band. Both the broad green band and the shoulder band fade away with heating, but do so with different temperature dependence, as shown in Fig. 6(a). The RL “peak” temperature is much higher than that of the TL and is postponed to until ∼130 °C for the green emission [Fig. 6(b)]. The 574 nm emission is consistent with one of the emission lines of Dy, but surprisingly, the other Dy lines are not apparent.
Emission spectra (a) and glow curve (b) of RL from “CP”.
However, the RL spectra of “SAO”, as presented in Fig. 5, are completely different from the TL. There is a shoulder band located on the blue side at 411 nm. Additionally, the SAO samples show many of the Dy emission lines as apparent in the data of Fig. 7. At the higher temperatures, the two characteristic Dy lines which are 477 nm and 578 nm are retained.
Emission spectra with temperature of RL from SAO.
C. Low temperature TL
The isometric plot of low temperature TL from “CP” material is shown in Fig. 8. Figure 8(a) is the isometric plot, (b) is contour one, and (c) is the glow curve. No resolved TL peaks are apparent, and the only signals appear near room temperature, where they are the onset of the TL peak already noted above room temperature.
Isometric TL spectra from CP of low temperature range in isometric, contour and temperature slice views.
Isometric TL spectra collected from SrAl2O4:Eu2+,Dy3+ with A1N addition (SAO) at low temperature range are shown in Fig. 9(a). Contour spectra are shown in Figs. 9(b) and 9(c). The SAO TL totally differs from the CP material and has many more features. There is a broad band (∼524 nm) which exists through the whole temperature range. A second band (451 nm) is present below 100 °C. Figure 9(c) is an expanded view of the low temperature contour plot as this has the characteristics of discontinuous intensity changes. The feature near 110 K is apparent but there are regions of intensity steps at lower temperatures. Such contour pattern events have previously been noted in many materials and are typical of phase transitions of the host, or embedded nanoparticles, or of impurity phases.Reference Peto, Townsend, Hole and Harmer25
(a) Isometric TL spectra, (b) contour spectra, and (c) enlarged contour plot of SrAl2O4:Eu2+,Dy3+ with A1N addition at low temperature range (SAO).
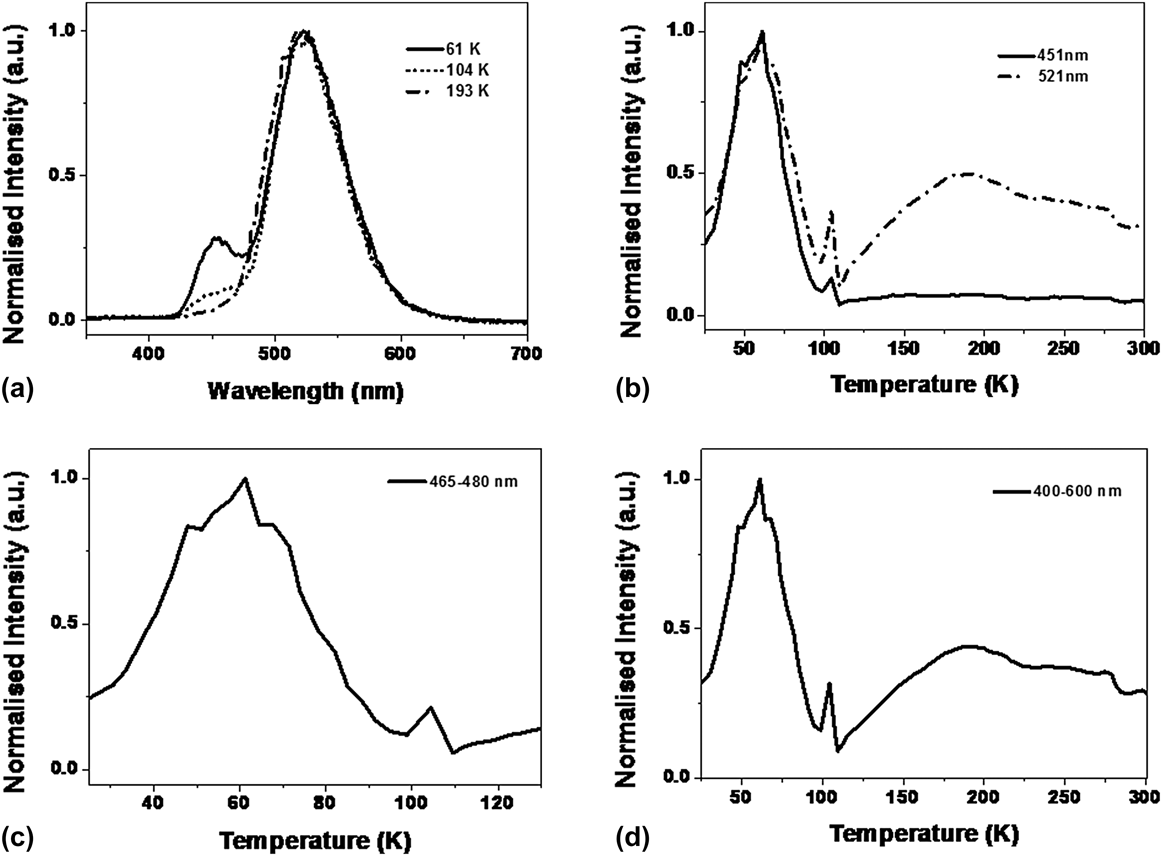
Figure 10 presents both the emission spectra and glow curves of SAO material. There is a small wave length movement of the peak with temperature, which is typical of changes in impurity coupling caused by thermal expansion of the lattice Fig. 10(a). The green signals for the first peak (near 60 K) do not generate a classic smooth glow curve and the data shown in Fig. 10 (from a different set of measurements from that of Fig. 9) confirm this. For the first green peak, there are consistent steps in intensity near ∼50 and 64 K, plus minor irregularities from a normal TL glow peak shape. Equally pronounced on both Figs. 9 and 10 is the very narrow temperature feature between ∼98 and ∼110 K. Finally, there is a downward step near 275 K in each case.
(a) SAO TL emission spectra, (b, c, and d) glow curves with different band width summations.
D. Low temperature RL
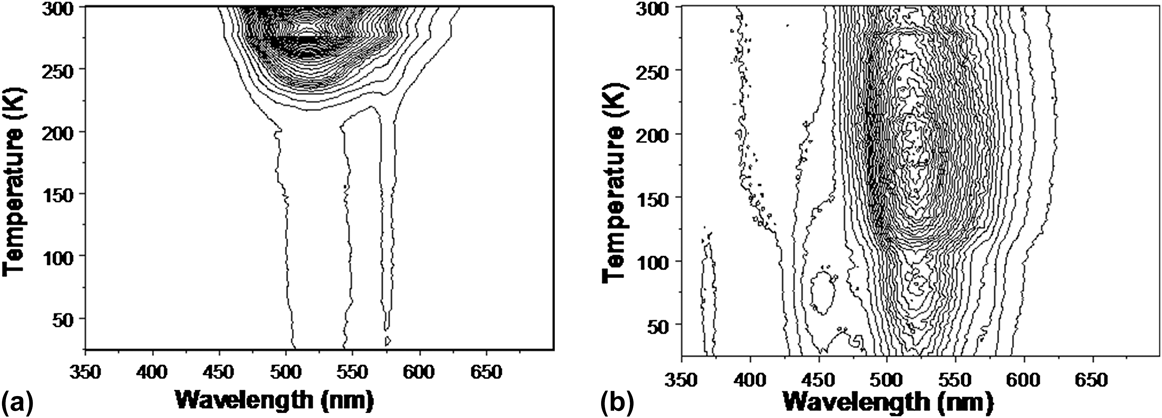
A similar pattern of differences between the CP and SAO material is apparent in the RL data which confirms the observations of the low temperature TL. Figure 11 compares the contour plots of the RL for the different sample types.
Contour plots of the RL data acquired during heating, for CP (a) and SAO (b).
Both materials indicate structure around 275 K, for the SAO samples there is a UV emission near 370 nm, and the blue and green low temperature “peaks” differ slightly in temperature (all with the same pattern as the TL). However in terms of RL excitation of the Dy lines, the CP sample shows the 574 nm line across the entire temperature range (as seen above room temperature).
IV. DISCUSSION
Long-lasting phosphorescence is commercially valuable and therefore there is considerable interest in finding techniques that will both increase the intensity and duration. To some extent these may be conflicting objectives, as if there is a fixed number of electron traps, then rapid depletion will enhance the intensity, but simultaneously shorten the half life of the phosphorescence. Adding further dopants to a system such as SrAl2O4:Eu2+,Dy3+, in this case A1N, has in fact raised the temperature of the TL peak and therefore, in principle, prolonged the decay time. However, in TL terms, it has not produced a brighter phosphor. The room temperature emission spectra of the CP and SAO variants are extremely similar [Figs. 3(b) and 3(c)] and there are no obvious alternative emission sites. The change in trap depth need not imply any difference in trap structure, only that the coupling of the trap to the europium site is weaker. This would be consistent both with the need for a slightly higher escape energy, and also a lower light production efficiency. The overall implication is that the role of the A1N is to perhaps minimize the lattice strains around the Eu/Dy complex, and/or stabilize the trapping site. Alternatively, the A1N may have caused a greater separation between the Dy and Eu parts of the luminescence complex. This would generate less directional distortion of the Dy trapping site, and hence a deeper trap. Equally, a greater separation would allow more excitation of Dy transitions, which indeed is seen in the RL data. Either view of the change will produce a less efficient coupling of a released electron towards the europium emission site (even if they are bound within nominally one complex).
The parallel data from RL are informative and complement the TL data. The RL results reveal considerable differences between the CP and SAO variants. The first RL feature is that for the CP material there is a decay pathway via one of the Dy energy levels that offers a weak signal near 574 nm. By contrast, addition of the A1N has transformed the importance of the decay routes involving Dy, not just by increasing the intensity of the 574 nm transition, but much more dramatically involving higher energy levels as well (i.e., implying greater Eu/Dy separation). Additionally, there is a significant new blue emission near 411 nm. Each one of these additional decay paths implies that the A1N doped material is likely to be less bright at the green wavelengths of the europium emission.
Neither the 411 nm emission, nor the Dy main line signals are ideal for a visually perceived phosphor, as the normal human eye response falls steeply at these wavelengths, compared with the green sensitivity of the eye.
The low temperature luminescence data are informative as to why the CP and SAO materials differ. Whilst the CP samples have negligible TL, except in the temperature range preceding the peak seen at ∼56 °C. There may be other trapping sites as there is an apparent side peak near 275 K. However, one feature in the TL of the SAO samples is an intensity step in this same temperature region, so one possibility is that there are changes in defect structures which influence the overall luminescence intensity. A first model for such a change could be the presence of water that is introduced as a co-dopant with the A1N addition (or subsequently as surface absorbed water). If this has precipitated out into nanoparticle droplets of water, then the ∼275 K may reflect transformation of this inclusion from solid to liquid. Equally, with a more reactive material, generated by the presence of A1N, water vapor may have been chemisorbed on the surface of the micron size particles.
Note there are many detailed examples in other insulating host materials which unequivocally link luminescence intensity steps to phase changes that occur in both nanoparticle inclusionsReference Townsend, Yang and Wang24 and water absorbed on bulk crystalline surfaces.Reference Peto, Townsend, Hole and Harmer25,Reference Maghrabi, Townsend and Vazquez26 Very common examples have been water, CO2, O2, and N2 impurities. Indeed the data shown in Figs. 9 and 10 may also be indicating the presence of such nanoparticle contaminants. The distortions of a classic glow curve shape are seen near 50 and 64 K. These temperatures are similar to the melting points of bulk oxygen and nitrogen (54.6 and 63.2 K). A precise match may not be appropriate as many nanoparticles undergo phase transitions at temperatures that vary with their size. Liquid to gas phase changes of N2 and O2 are 77.2 and 90 K, and once again there are irregularities in the shape of the glow curve at these temperature regions. Therefore, a tentative model for the shape distortion of the curve may be the presence of impurity nanoparticles of these gases.
The second glow peak is unusual in that it is very narrow and spans a range from about 100 to 110 K in the sample with the addition of A1N. With the same premise, one might attribute this to a phase of NO that has formed from the host and additive. In isolation, NO undergoes phase changes at 109.4 and 121.2 K. Therefore, it is nominally in the correct temperature range and it has the appropriate 10 degree scale duration. The downward shift of ∼10 K, compared with bulk NO, is feasible for small particles.
Lattice distortions arise from the presence of the original dopants and also from the structures that evolve because A1N has been added to the mixture. Optically, the changes are apparent by a shift of the center of emission intensity between 511 and 514 nm from europium transitions. There is a multiplicity of Eu levels providing green emission so the shift of the envelope may reflect a change in balance between the components, or a perturbation of the site symmetry.
The Dy signals seen by RL are the familiar lines at 574 nm (shown in Fig. 4) that can be assigned to the transition of 4F2/9 → 6H15/2. The two very strong sharp lines, 477 nm and 578 nm, surviving through the whole temperature range in Fig. 5 are even more obvious. They should be contributed by the transition of 4F2/9 → 6H15/2 and 4F2/9 → 6H13/2. The peak position of the emission spectra of Dy3+ and the ratio between blue (477 nm) and yellow (578 nm) may vary with references and the possible reason has been recently proposed.Reference Ayvacikli, Ege and Can27 The more difficult question is why there is normally no sign of these characteristic lines of Dy3+ during TL, although they can be generated during RL, whereas the broad emission band of Eu2+, caused by the various 4f 7 → 4f 65d transitions, occurs in each case.
The underlying difficulty in modeling the processes, and the reason for such speculative suggestions of the role of contaminants, is that the material is in the form of a nanoparticle powder. The excitation spectra (with light) and the emission spectra differ with particle size and the method of preparation. Therefore it is certain that contaminants and long range stresses, and/or defect interactions, are playing different roles in the energy levels and associations of the various impurity sites of Eu and Dy that are key to the overall phosphor process. Scanning electron microscopy imagesReference Ma, Xia and Liu20 indicate that additions of A1N decrease both the lattice parameter and the average particle size. In terms of the unit cell volume, the decrease is ∼1%. However, the images of the particles show that there are a wide range of sizes, and they are not spherical. Therefore surface contaminants may cause long range interactions that perturb “bulk” sites.
The addition of A1N not only influences trap depths, but offers surface states that may react with the atmosphere (e.g., water vapor or oxygen etc.) and may allow the formation of isolated impurity clusters (e.g., NO). The A1N will certainly add more defect sites and hence offer more nonradiative decay paths, or interfere with the ones in the earlier CP structures.
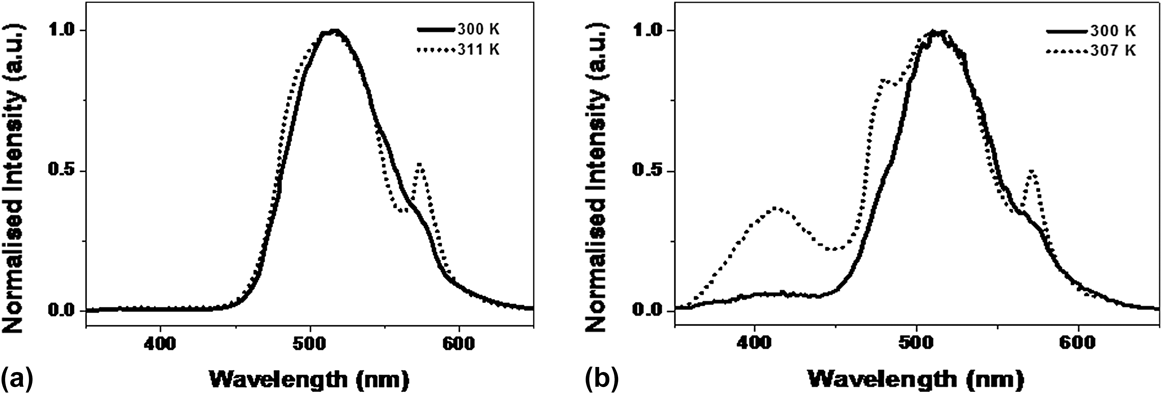
Perusal of the RL data obtained at low and high temperature reveals that at room temperature (where data are seen in each case), neither CP nor SAO samples give identical spectra. Figure 12 compares the spectral matches for the two types of samples.
Spectra taken during RL near room temperature from the high and low temperature data, for CP (a) and for SAO (b). The solid lines are from the low temperature data.
The differences indicate that the previous thermal and radiation histories of the materials and altering the total number, and interactions, between defect sites. This in turn is emphasizing how critical these sites are in terms of the phosphor properties.
Predictive modeling of the defect sites is extremely difficult, hence for more efficient commercial applications, the preferable approach is an empirical one. The concern about the role of surface contaminants suggests that production of larger crystallites might help to resolve which features are from the host and which are influenced by surface states. This is equally true of the commercial CP phosphor materials, as for the new samples with A1N doping. The value of persistent bright visible phosphors justifies further experimentation and assessment of potential benefits, so the value of deeper traps from the A1N additions may still be exploitable in larger grain material.
V. CONCLUSION
Ongoing experimentation to produce persistent phosphors materials based on SrA12O4:Eu2+,Dy3+ demonstrate that doping with A1N can increase the trap depth, which implies an improvement to a longer persistence green phosphor. However, TL and RL data (especially at low temperature) have revealed many more radiative trapping sites which may be the reason why the efficiency decreased. Possible impurity inclusions were identified, and this suggests that the optimum particle size for the original and A1N doped material may need to be different from the earlier material. A final comment is that the comparisons between different treatments and samples are only possible, and crucially dependent on, when one has a full data set for the spectral changes. Simplistic broad band data collection may be misleading.
ACKNOWLEDGMENTS
We would like to thank the support of the Fundamental Research Funds for the Central Universities of China, Beijing Higher Education Young Elite Teacher Project (YETP0640) and National Natural Science Foundation of China (No. 11205134).