I. INTRODUCTION
It is well known that the addition of ceramic hard particles to metal alloys increases the strength, micro-hardness, and wear resistance at both ambient and elevated temperatures. Reference Scamans, Birbilis and Buchheit1–Reference Kumar, Panwar and Pandey3 But, it is essential to have a homogeneous and uniform distribution of the reinforcement in such composites to achieve effective load-bearing capacity of reinforcement. Otherwise, agglomeration or inhomogeneous distribution of reinforcement can lead to lower ductility, strength, and toughness of the composites. Enhanced mechanical properties can be obtained when the reinforcement particles are very small in size, typically less than about 1 µm. Reference Wang, Song, Sun and He4 Such fine particles can be most effectively and homogeneously distributed in the metal matrix through the process of mechanical alloying (MA). Reference Trapp and Kieback5
MA is a solid-state powder processing technique involving repeated cold-welding, fracturing, and rewelding of powder particles in a high-energy ball mill by means of which homogenous particle distribution in the matrix can be achieved. MA offers some advantages of room temperature manufacturing including avoidance of the strong interfacial reactions and minimization of the undesired reactions between the matrix and the reinforcement. Reference Yadav, Yadav and Singh6 Recently, a number of different reinforcements have been added to aluminum and its alloys through the MA technique like those were done in the previous work. Reference Kubota, Kaneko and Kaneko7–Reference Sadeghian, Lotfi, Enayati and Beiss16 In all the mentioned works, there are three types of tests used for calculating the hardness of composites, namely the Brinell hardness test, the Rockwell hardness test, and the Vickers hardness test. Since the definitions of metallurgic ultimate strength and hardness are rather similar, it can generally be assumed that a strong metal is also a hard metal. The way the three of these hardness tests measure a metal's hardness is to determine the metal's resistance to the penetration of a nondeformable ball or cone. The tests determine the depth to which such a ball or cone will sink into the metal, under a given load, within a specific period of time. The following are the most common hardness test methods used in today's technology:
-
(i) Rockwell hardness test Reference Paschke, Weber, Kaestner and Braeuer17
-
(ii) Brinell hardness Reference Wang, Wang, Hopfeld, Grieseler, Rossberg and Schaaf18
-
(iii) Vickers Reference Wang, Wang, Hopfeld, Grieseler, Rossberg and Schaaf18
-
(iv) Knoop hardness Reference Zisis19
-
(v) Shore Reference Bassi, Casa and Mendichi20
Genetic programing (GP) garnered considerable attention due to its ability to model nonlinear relationships for input output mappings. Several studies have utilized GP derivatives for construction industry problems. Baykasoğlu et al. Reference Baykasoğlu, Güllü, Çanakçı and Özbakır21 applied genetic expression programming (GEP) to determine concrete strength, cost, and slump. Yeh and Lien Reference Yeh and Lien22 developed a genetic operation tree (GOT) to study concrete strength. The GOT uses a tree topology (as does GEP) and optimized coefficients that differ from other GP derivatives. Coefficients do not frequently appear in formulae programed using any of these GP models. The presented approach does not transform data into any other type but combines the properties of arithmetic expressions (using numerical data) and logical expressions (using categorical data).
The authors' literature survey shows that utilizing the techniques based on computer for evaluating the properties of synthesized nanopowders is rarely reported. Accordingly, in the present study, GEP has been used to predict the hardness of these materials. The data were collected from the previous studies, Reference Kubota, Kaneko and Kaneko7–Reference Sadeghian, Lotfi, Enayati and Beiss16 trained, and tested by four different GEP models. Eight independent input parameters that cover the method of calculation of the hardness of the product, hardness of reinforced materials, compact pressure, sintering temperature, vial speed, ball to powder ratio, milling time, amount of added reinforcement and sintering time were considered for predicting the mean hardness of nanocomposites.
II. DATA COLLECTION
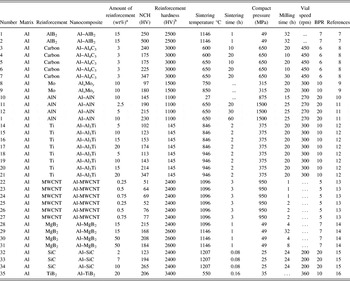
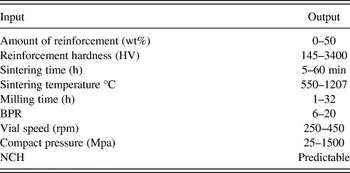
Table I summarizes the details of the different reinforcements and the process parameters used to obtain the nanocomposites. The hardness of several MA-synthesized nanomaterials has been considered as the main objective of this study for prediction by different GEP models. The input parameters were considered for the method of determining hardness of the product, hardness of reinforced materials, compact pressure, sintering temperature, vial speed, ball to powder ratio, milling time, amount of added reinforcement, and sintering time with the given range in Table II.
A summarization of the details of the different reinforcements and the process parameters used to obtain the nanocomposites.

a The used reinforcements in Ref. 15 are based on wt%.
b The hardness of reinforcements is approximate.
The range of the input parameters in GEP models.

III. GENETIC PROGRAMMING
GP is a domain-independent method that genetically breeds populations of computer programs to solve problems by executing the following steps Reference Wahab Khan and Alam23 :
-
(i) generates an initial population of pseudorandom composed of the primitive functions and terminals of the problem.
-
(ii) Iteratively performs generations consisting of the following substeps until the termination criterion of the problem is satisfied:
-
(a) executes each program in the population and determines how fit it is at solving the specific problem.
-
(b) Creates a new generation of the population of programs by applying the following two primary operations to program(s) that are selected from the population with a probability based on fitness (i.e., the fitter the program, the more likely it is to be selected). Reference Wahab Khan and Alam23
-
(1) Reproduction: copies a selected program to the new population.
-
(2) Crossover: creates two new offspring programs for the new population by genetically recombining randomly chosen parts of two selected programs.
-
-
-
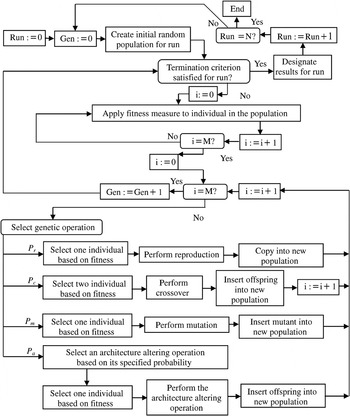
(iii) The single best computer program produced anytime during the run is typically designated as the result of the run. This result may be a solution (or approximate solution) to the problem. Reference Wahab Khan and Alam23 A flowchart of a typical GP algorithm is shown in Fig. 1. Reference Sarıdemir24
GP flowchart.

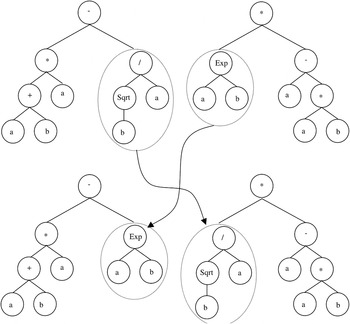
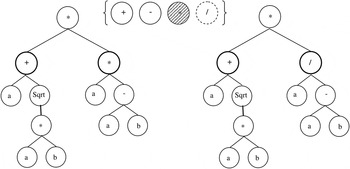
GP approach evolves through the action of 3 basic genetic operators: reproduction, crossover, and mutation. In the reproduction stage, a strategy must be adopted as to which programs should die. In the implementation, a small percentage of the trees with the worst fitness are killed. The population is then filled with the surviving trees according to the accepted selection mechanisms, explained as follows. Reference Sarıdemir24 Crossover swamps randomly selected parts of 2 trees to combine good information from the parents and to develop the fitness of the next generation, as shown in Fig. 2. Reference Fatih Kara25 Mutation protects the model against premature convergence and develops the nonlocal properties of the search, as shown in Fig. 3. Reference Fatih Kara25 Occasionally, one randomly selected node is replaced by another one from the same set, except itself.
Example of GP crossover.

Example of GP mutation.

In applying GP with automatic function definition to solving a problem, five major preparatory steps are used. These steps involve determining terminal set, function set, fitness function, control parameter, and termination criteria. Reference Wahab Khan and Alam23
-
(i) Terminal set selection: a set of either variable atoms (representing, perhaps, the inputs, sensors, detectors, or state variables of some system) or constant atoms (such as the number 3 or the Boolean constant NIL).
-
(ii) Selection of a function set: a set of domain specific functions used in conjunction with the terminal set to construct potential solutions to a given problem. For symbolic regression, this could consist of a set of basic mathematical functions, arithmetic function, recursive and iterative function, Boolean and conditional operators.
-
(iii) Assignment of fitness function: the fitness measure is implied in terms of “what needs to be done” not “how to do it.” Fitness is a numeric value assigned to each member of a population to provide a measure of the appropriateness of a solution to the problem in question. The fitness measure may incorporate any measurable, observable, or calculable behavior or characteristic or combination of behaviors or characteristics.
-
(iv) Control parameters: this includes the population size and the crossover and mutation probabilities.
-
(v) The termination criterion: the termination criterion may include a maximum number of generations to be run as well as a problem-specific success predicate. Reference Wahab Khan and Alam23
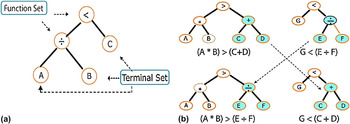
Figure 4 shows the representation used by GP for simple programs and the method of recombining the programs to produce offspring programs. Reference Worzel, Yu, Almal and Chinnaiyan26 In Fig. 4(a), the simple function A/B > C is a Boolean function that produces a TRUE/FALSE result when the input values for the variables A, B, and C are given. It is represented as a tree structure where individual variables or “terminals” are combined with mathematical functions. This is a standard representation used internally by computer compilers to transform high level languages like C or C++ to the machine code in executable programs.
GP process. Programs are represented by tree structures in (a). (b) An illustration of a crossover operator in GP.

Figure 4(b) shows how two such programs may be combined to produce offspring programs during crossover. Here the program (A × B) > (C + D) is combined with the program G < (E/F) by swapping parts of the program trees to produce the offspring programs (A × B) > (E/F) and G < (C + D).
Although not shown, mutation is achieved by stochastically selecting a portion of the tree and randomly replacing it. For example, mutation might change (E/F) in one of the offspring programs to (H–I) after the crossover is completed. Reference Worzel, Yu, Almal and Chinnaiyan26
It is important to note that both crossover and mutation operations are stochastic in nature with a probability assigned by the control parameters of the GP process. Typical values of crossover and mutation rates are 10–50% for crossover and 1–5% for mutation. Reference Worzel, Yu, Almal and Chinnaiyan26
IV. GENE EXPRESSION PARAMETERS AND STRUCTURES
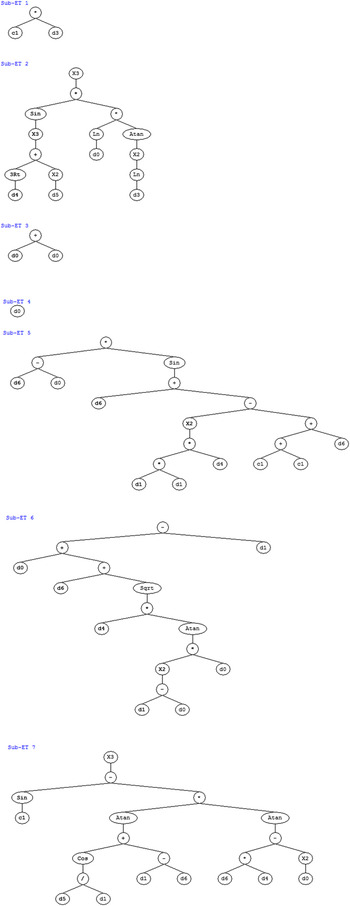
In the present work, as seen for example in Fig. 5 for GEP-4, the expression trees of four different GEP models named GEP-1 to GEP-4 were constructed for mean hardness values of synthesized nanocomposites. As will be described thereinafter, GEP-4 is the best proposed model and for the other models, only the obtained equation has been presented in Table IV. It should be noted that d 0, d 1, d 2, d 3, d 4, d 5, d 6, and d 7 in Fig. 5 represent the values for input layers, which are equivalent to the amount of reinforcement (A), ball to powder ratio (B), compaction pressure (C), milling time (t), reinforcement hardness (H), sintering temperature (S T ), sintering time (S t ) and vial speed (v), respectively. The number of genes (sub-ETs) was 7 for GEP-1, 8 for GEP-2, 6 for GEP-3, and 7 for GEP-4 models. Training and testing of the GEP-1 to GEP-4 approach models constituted different sub-ETs and same linking functions A, B, C, t, H, S T , S t , and v were used as input data and nanocomposite hardness (NCH) as independent output data. Among the 35 experimental sets collected from the literature, 28 sets were randomly chosen as a training set for the GEP-1 to GEP-4 modeling and the remaining 7 sets were used for testing the generalization capacity of the proposed models.
Expression tree with 7 genes for predicting mean hardness of synthesized nanocomposite in GEP-4 model.

For the GEP-based formulations, the first is to choose the fitness function. For this problem, first, the fitness, fi , of an individual program, i, is measured by Eq. (1):
 $${{f_i}} = \mathop \sum \limits_{j{\rm{ = 1}}}^{{C_{\rm{t}}}} \left( {M - \left| {{C_{\left( {i,\,j} \right)}} - {T_j}} \right|} \right)\quad ,$$
where M is the range of selection, C (i,j) is the value returned by the individual chromosome i for fitness case j (out of C t fitness cases) and T j is the target value for fitness case j. If |C( i,j ) − Tj | (the precision) is less than or equal to 0.01, then the precision is equal to zero, and f i = f max = C t M. In this case, M = 100 was used, therefore, f max = 1000. The advantage of this kind of fitness functions is that the system can find the optimal solution for itself. The second important step makes up by choosing the set of terminals T and the set of functions F to create the chromosomes. In this problem, the terminal set consists obviously of the independent variable, i.e., T = {A, B, C, t, H, S T , S t , v}. The choice of the appropriate function set is not so obvious, but a good guess can always be done to include all the necessary functions. In this situation, four basic arithmetic operators (+, −, *, /) and some basic functions (sqrt, x 2, x 3, ln, sin, cos, arctan, exp). Reference Sarıdemir27
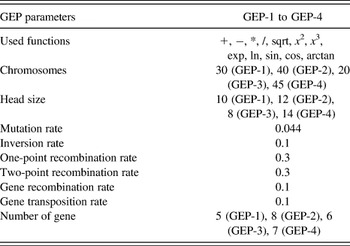
The third important step is to choose the chromosomal tree, i.e., the length of the head and the number of genes. GEP-based formulations initially used single gene and 2 lengths of heads, and increased the number of genes and heads, one after another during each run, and monitored the training and testing performance of each formulation. In the present study, after several trials, for all of the GEP-based formulations, the number of genes and the length of the head are determined as given in Table III. The fourth important step is to select the linking function. In the present study, all of the GEP-based formulations used the linking function addition (+). Finally, the fifth important step is to select the set of genetic operators that give rise to variation and their rates. Reference Sarıdemir27
The combinations of all genetic operators (mutation, transposition, and crossover).

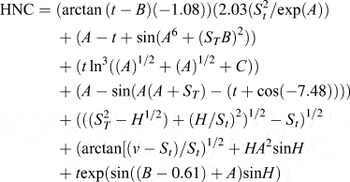
The combinations of all genetic operators (mutation, transposition, and crossover) are given in Table III. For the GEP-1 to GEP-4 approach models, a chromosome number of 40 was observed to be the best of generation individuals predicting the mean hardness of the synthesized nanopowders. Explicit formulations based on the GEP-1 to GEP-4 approach models for mean hardness of nano composite (HNC) were obtained by:
 $${\rm{HNC}} = {{f}}\left( {{{A,B,C,t,H,}}\,{{{S}}_{{T}}},{{{S}}_{{t}}},{{v}}} \right)\quad .$$
The related formulations could be obtained by the procedure shown in Fig. 5.
V. RESULTS AND DISCUSSION
In the present study, to evaluate the capabilities of GEP-based formulations, formulae given by some national building codes, and the developed regression-based formulation, mean absolute percentage error (MAPE), root-mean-squared error (RMSE), and R-squared (R 2) were used as the criteria between the experimental and predicted values according to Eqs. (3)–(5), respectively:
 $${\rm{MAPE}} = {1 \over {{n}}}\left[ {{{\sum _{{{i = 1}}}^{{n}}\left| {{{{t}}_{{i}}} - {{\rm{0}}_{{i}}}} \right|} \over {\sum\nolimits_{{{i}} = 1}^{{n}} {{{{t}}_{{i}}}} }} \times 100} \right]\quad ,$$
 $${\rm{RMSE = }}\sqrt {{{\rm{1}} \over {{n}}}\mathop\sum\limits_{{{i}} = 1}^{{n}} {{\rm{(}}{{{t}}_{{i}}}} - {{\rm{0}}_{{i}}}{)^2}\quad ,}$$
 $${{{R}}^{\rm{2}}} = {{{{\left( {{{n}}\sum {{{t}}_{{i}}}{{\rm{0}}_{{i}}} - \sum {{{t}}_{{i}}}\sum {{\rm{0}}_{{i}}}} \right)}^2}} \over {\left( {{{n}}\sum {{t}}_{{i}}^{\rm{2}} - {{\left( {\sum {{{t}}_{{i}}}} \right)}^2}} \right)\left( {{{n}}\sum {\rm 0}_{{i}}^{\rm{2}} - {{\left( {\sum {{\rm 0}_{{i}}}} \right)}^2}} \right)}}\quad .$$
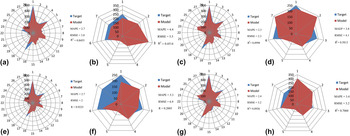
All of the results obtained from experimental studies (target) and predicted by using the training and testing results of GEP-1 to GEP-4 model are given in Fig. 6. The numbers on the circle and hexagonal are samples and those on the vertical axis are the hardness of the studied nanocomposites. The R 2, MAPE, and RMSE values were shown in the figure for the training and testing data. It is seen that the values obtained from the training and testing in GEP-4 [Figs. 6(g) and 6(h)] are relatively close to the collected experimental results by an accuracy of more than 85% for the training set and more than 75% for the testing set. The best value of R 2 in training sets is 0.9225 for the GEP-3 model [Fig. 6(e)]. However, its R 2 in the testing phase is only 0.2005 [Fig. 6(f)]. A high performance network is achieved when its performance in terms of R 2 reaches to at least 75%. The next model with high performance is the GEP-4 model with an R 2 value of 0.8926 in the training phase and 0.7060 in the testing phase. GEP-4 is the only model that could predict the collected experimental results by an accuracy of more than 75% in the testing phase. Therefore, GEP-4 could be the only proposed model to predict the mean hardness value of the synthesized nanocomposites in the considered range of the present work.
The results obtained from experimental studies (target) and predicted by using the training and testing results of GEP-1 to GEP-4 model. Respectively, (a, b) training and testing related to GEP-1; (c, d) training and testing related to GEP-2; (e, f) training and testing related to GEP-3; and (g, h) training and testing related to GEP-4.

Comparing the GEP-4 approach model prediction with the collected experimental results for the testing and training stages demonstrates a generalization capacity of the proposed models and fairly low error values. All of these findings exhibit a successful performance of the model for predicting mean hardness values of synthesized nanocomposite in training and testing stages. The result of the testing phase in Table IV shows that the GEP-4 model is capable of generalizing between input and output variables with reasonably good predictions and accuracy more than 75%.
The performance of four suggested models in terms of R 2 and the obtained equations by the program.

VI. CONCLUSIONS
This study reports a new and efficient approach for the formulation of mean hardness of synthesized nanocomposites produced by MA. In all GEP models, addition was set as linking function and gene number, chromosomes, and head size were changed in each round. The acquired results indicated that GEP can be an alternative approach for the evaluation of mean hardness values of nanocomposite produced by MA. The best values of R 2 for training and testing were related to the GEP-4 model. Comparison between GEP in terms of R 2, MAPE, and RMSE values showed that GEP models are capable of predicting suitable results for hardness values of nanocomposites in the studied range.