



Introduction
Pleistocene Lake Bonneville in the eastern Great Basin of North America (Fig. 1) has been studied since the late 1800s (Gilbert, Reference Gilbert1890), and the scientific understanding of the lake system has evolved considerably during that time (e.g., Sack, Reference Sack and Tinkler1989; Oviatt and Shroder, Reference Oviatt, Shroder, Oviatt and Shroder2016). As recognized long ago by G.K. Gilbert (Reference Gilbert1890), the rises and falls of Lake Bonneville in its hydrographically closed basin are closely tied to changes in climate. The major lake cycle itself is broadly correlated with Marine Oxygen Isotope Stage 2 (Atwood et al., Reference Atwood, Wambeam, Anderson, Oviatt and Shroder2016), and some lake-level oscillations during the Bonneville cycle were probably correlated with global or hemispheric and millennial-scale climate changes (Oviatt, Reference Oviatt1997; Nelson and Jewell, Reference Nelson and Jewell2015). The timing of lake-level changes has research implications in fields such as geology, geomorphology, archaeology, biology, paleoclimatology, and geochemistry. Hydrographs (plots of lake-level change through time) have been fundamental to those interpretations, and the form of the Lake Bonneville hydrograph has evolved along with the science. We do not attempt to review here the many published hydrographs of Lake Bonneville, but the interested reader can consult previous efforts in Eardley et al. (Reference Eardley, Gvosdetsky and Marsell1957), Broecker and Orr (Reference Broecker and Orr1958), Broecker and Kaufman (Reference Broecker and Kaufman1965), Morrison and Frye (Reference Morrison and Frye1965), Scott et al. (Reference Scott, McCoy, Shroba and Rubin1983), Currey and Oviatt (Reference Currey, Oviatt, Kay and Diaz1985), Oviatt et al. (Reference Oviatt, Currey and Sack1992), Godsey et al. (Reference Godsey, Currey and Chan2005), and Oviatt (Reference Oviatt2015).
Map showing Lake Bonneville at its highest level (the Bonneville shoreline). Inset map shows the location of Lake Bonneville in the eastern Great Basin of North America. Black dots mark locations where algal-laminated marl (ALM) has been observed.
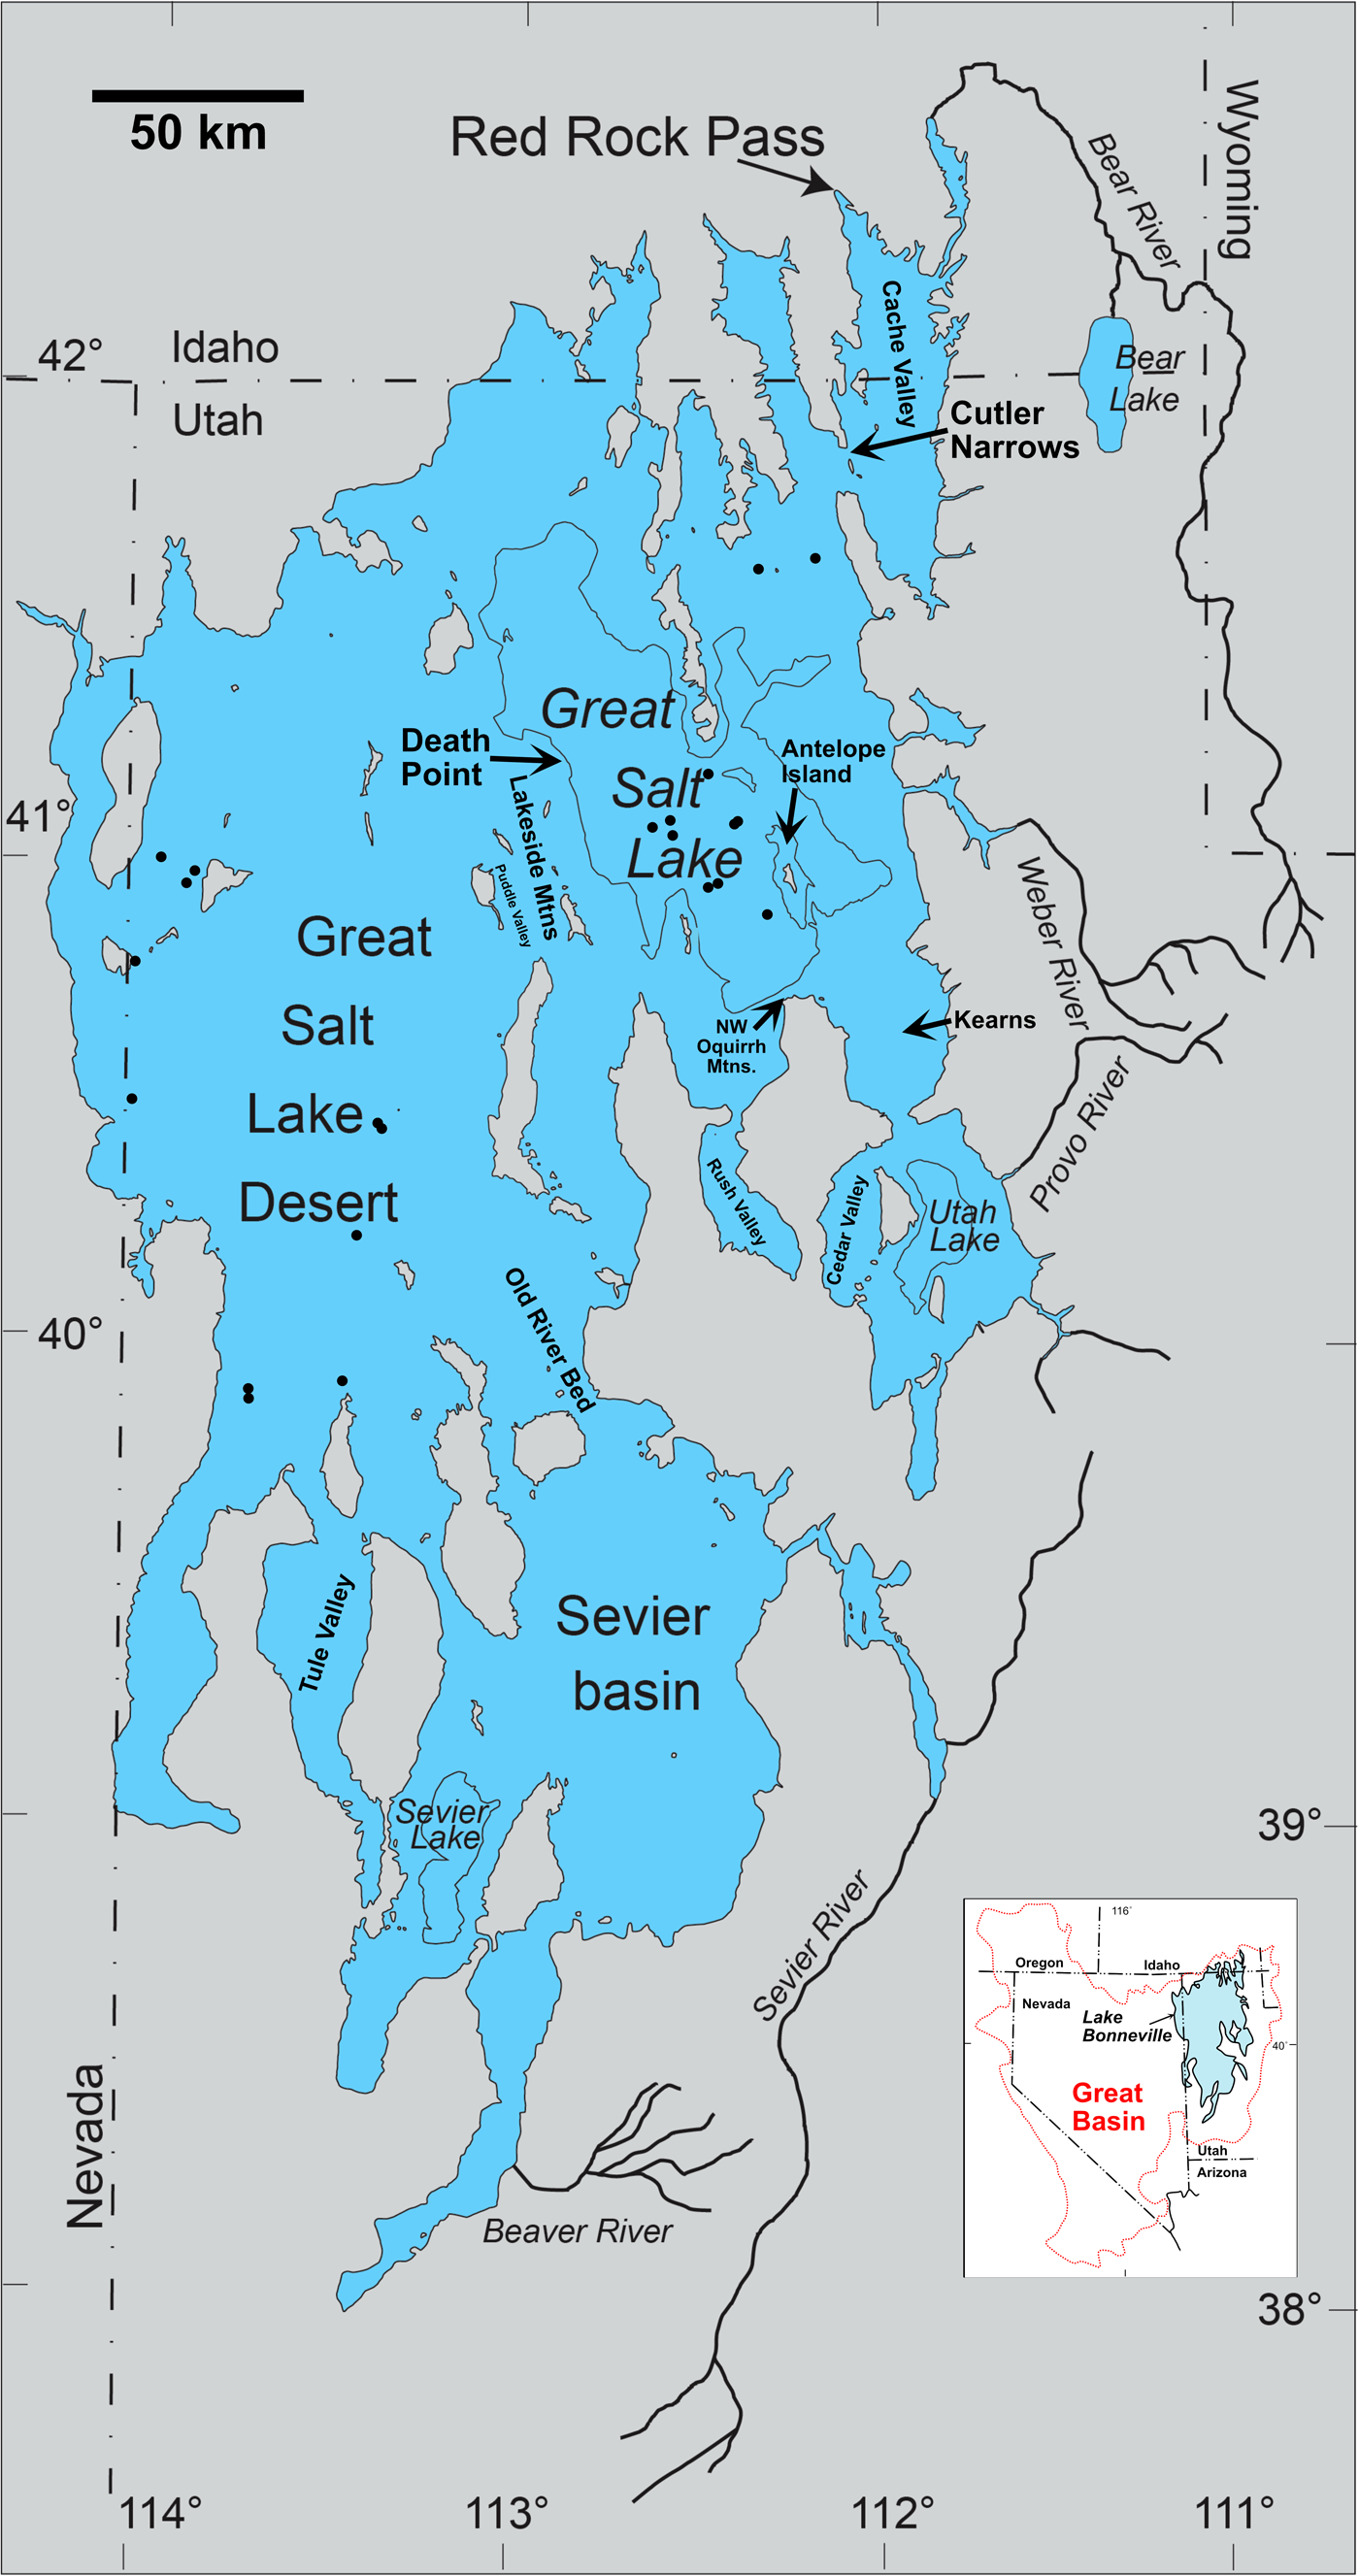
Geochronologic data are limited for the early transgressive phase of the Lake Bonneville hydrograph. New radiocarbon (14C) and uranium-thorium (U-Th) ages from a detailed study of a microbialite (“tufa”) mound at Death Point (Pedone et al., Reference Pedone, Oviatt and McGee2023; Fig. 1) call for a new interpretation of the early history of Lake Bonneville. The microbialite mound is located about 2 km east of Lakeside, UT, at the northern tip of the Lakeside Mountains, where the Union Pacific Railroad causeway intersects the mainland on the west side of Great Salt Lake, with an elevation range between ~1280 and 1285 m, a few meters higher than the historic average lake level. The aragonite microbialite formed in the wave zone, within a few meters of lake level, episodically over a minimum time range of 3600 yr. Episodic exposure resulted in formation of large dissolution pores, which were partly to completely filled by multiple generations of penecontemporaneous prismatic aragonite cement during re-submergence of the mound.
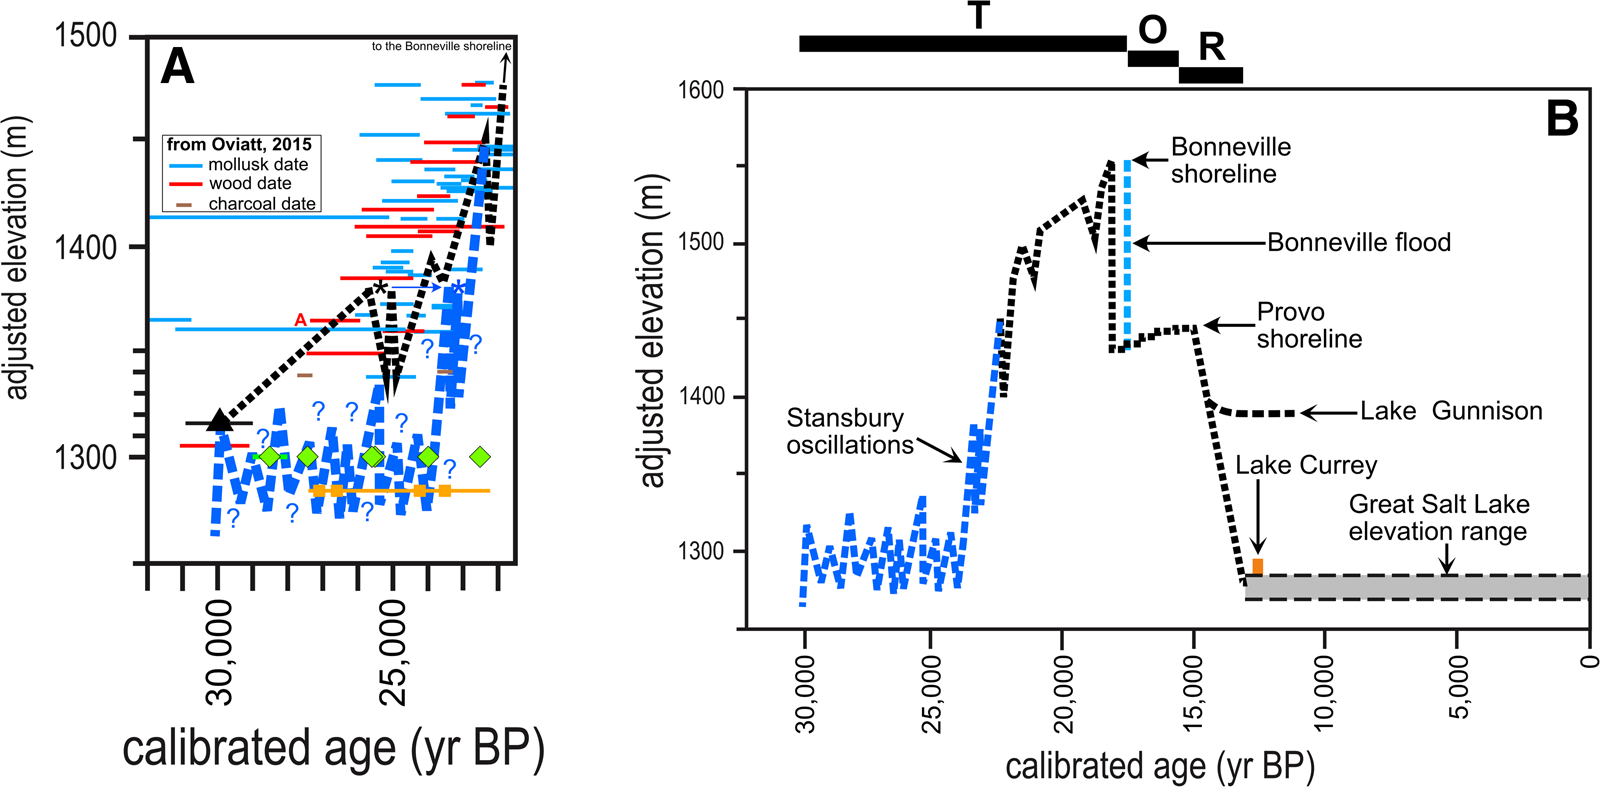
As part of the continuing evolution of the hydrograph of Lake Bonneville, we present in Figure 2A a new version of the early transgressive part of the Bonneville cycle, modified from the hydrograph of Oviatt (Reference Oviatt2015; Fig. 2). Figure 2B shows the hydrograph for the entire Bonneville cycle, modified from Oviatt (Reference Oviatt2015) using the curve from Figure 2A and the shift in the age of the Bonneville flood discussed in Oviatt (Reference Oviatt2020).
Hydrograph of Lake Bonneville. (A) The early transgressive phase with revisions discussed in this paper; the lake-level curve of Oviatt (Reference Oviatt2015) is shown by the dashed black line, and mollusk, wood, and charcoal ages used by Oviatt (Reference Oviatt2015) are shown. Mollusk-shell ages are not considered in this revision (see text for an explanation). New interpretation of the lake-level curve is shown by the blue dashed line. Orange squares are calibrated 14C and U-Th ages of microbialite samples from Death Point (Table 1). The black triangle marks the age and elevation of the eruption of the Hansel Valley basaltic ash (Oviatt et al., Reference Oviatt, Currey and Sack1992). Green diamonds are 14C and U-Th ages of cement in pores in microbialite precipitated when lake level was higher than the microbialite. The red “A” refers to a wood date discussed in the text (W-4898 from Scott et al. Reference Scott, McCoy, Shroba and Rubin1983). The two asterisks mark the high point of the Stansbury oscillation and the shift to a younger age in the revision (blue and black, respectively). (B) The entire Lake Bonneville cycle, modified from figure 2 of Oviatt (Reference Oviatt2015), with revisions discussed in this paper, and adjustment to the age of the Bonneville flood discussed in Oviatt (Reference Oviatt2020). T, transgressive phase; O, overflowing phase; R, regressive phase. The vertical axes (elevation) of both A and B are adjusted for the basin-wide effects of isostatic rebound using the Currey equation (Oviatt, Reference Oviatt2015).
14C and U-Th ages from Death Point, Utaha (Pedone et al., Reference Pedone, Oviatt and McGee2023).b
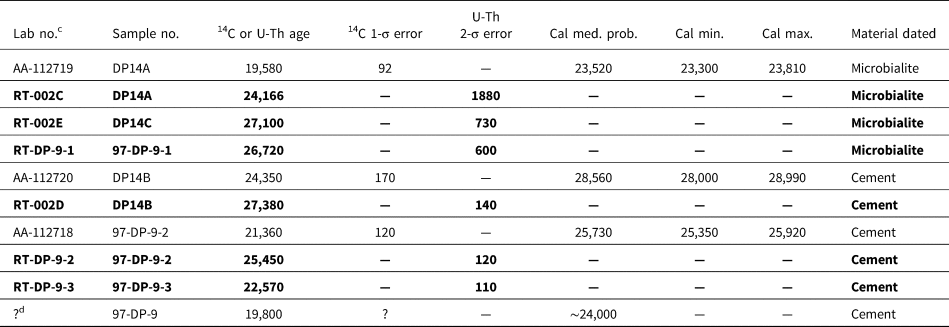
a All samples were collected at Death Point within a few meters of elevation 1283 m; the isostatically adjusted elevations are identical to the collection elevations in all cases, because they were below 1300 m (Oviatt, Reference Oviatt2015).
b Calibrations (“cal”) using CALIB 8.2 and IntCal20 (Stuiver and Reimer, Reference Stuiver and Reimer1993; Reimer et al., Reference Reimer, Austin, Bard, Bayliss, Blackwell, Bronk Ramsey and Butzin2020). U-Th ages are listed in bold type.
c Three pairs of ages (AA-112719 and RT-002C, AA112720 and RT-002D, AA112718 and RT-DP-9-3) each consists of one age based on 14C analysis and the other based on U-Th analysis, each pair for the same sample; the analytical uncertainties overlap for two of the pairs. For one pair (AA-112720 and RT-002D), the 14C age range is ~480 yr younger than the U-Th age range.
d This sample was extracted from hand sample DP-9 in 1997, and information about the exact site of extraction and uncertainties of the analysis are no longer available; it is designated “DP-9” in Pedone et al. (Reference Pedone, Oviatt and McGee2023).
Materials and methods
This paper relies on previously published observations and interpretations in Pedone et al. (Reference Pedone, Oviatt and McGee2023). No new methods or procedures are used here. The 14C ages used in this paper were calibrated with CALIB 8.2 using calibration data set IntCal20 (Stuiver and Reimer, Reference Stuiver and Reimer1993; Reimer et al., Reference Reimer, Austin, Bard, Bayliss, Blackwell, Bronk Ramsey and Butzin2020). Elevations of samples for locations higher than 1300 m are adjusted for isostatic deformation using the Currey equation (Oviatt, Reference Oviatt2015).
Results
Discussions of new interpretations of previously published data are given in the following sections. Table 1 is a list of pertinent 14C and U-Th ages, and Figure 2 provides graphical depictions of the revisions.
Discussion
In this paper, we reinterpret many of the 14C ages that were used to construct previous versions of the Lake Bonneville hydrograph and discuss the reasoning behind the reinterpretations. A major aspect of our revision of the hydrograph is tied to the meanings of 14C ages for wood and charcoal samples.
Ages derived from wood and charcoal
Wood and charcoal generally yield excellent analytical results for radiocarbon; in addition, plants from which wood and charcoal were derived (trees, shrubs, herbs, grasses) receive the carbon that ends up in their tissues directly from the atmosphere, not from some other carbon reservoir, such as water, thus satisfying one of the fundamental principles of radiocarbon dating (Trumbore, Reference Trumbore, Noller, Sowers and Lettis2000). The geologic context of those samples is also extremely important, however, and must be incorporated into interpretations of individual ages in terms of lake history. In most cases, if they could be quantified, the uncertainties resulting from the geologic context of 14C samples would probably exceed the analytical uncertainties of the reported ages. In Figure 2A, only the analytical uncertainties are plotted, because we cannot quantify the geologic uncertainties.
A number of factors could result in the age of the wood or charcoal being older than the Lake Bonneville sediment in which they are enclosed. In most cases, the dated wood fragments or logs were derived from trees that grew before the rise of Lake Bonneville to the elevation of the sample; in some cases, lacustrine deposits bury stumps of trees that grew before the rise of the lake. Furthermore, trees can live for hundreds to thousands of years, so a sample from a tree might be significantly older than the death of the tree. The time span from the growth of wood to the deposition of that wood in the lake sediments could easily be thousands of years. For instance, it is possible, and likely in many cases, that dated wood was preserved in wet environments for a long period before lake transgression and wave erosion and deposition at that site. In some cases (not involving in situ stumps), older wood fragments might have been transported to the site of deposition by fluvial and/or colluvial processes, and the transport time also needs to be considered.
Similar uncertainties apply to processes that deposit charcoal fragments. Carcaillet (Reference Carcaillet2001) documented that charcoal fragments in most soils and colluvium may be thousands of years older than the soil. Charcoal fragments could easily have been incorporated in pre-Bonneville soils or other surficial deposits that later were eroded by waves in rising Lake Bonneville. The charcoal fragments that were deposited with other clastic sediments in the lake would retain the age of their formation (the age of the burning bush or tree) and would be older than the lacustrine deposition. Once formed, charcoal can persist for long periods (even for tens of millions of years; Herring, Reference Herring, Sundquist and Broecker1985) in suitable geochemical environments and undergo one or more episodes of transport, so the age difference between charcoal fragments and lacustrine deposition could range from zero years (in appropriate settings) to many thousands of years.
Therefore, in constructing a hydrograph for Lake Bonneville, the 14C ages of samples of wood and charcoal should be regarded as maximum limiting ages rather than closely limiting ages. Scott et al. (Reference Scott, McCoy, Shroba and Rubin1983, p. 273) recognized that wood and charcoal in transgressive-phase deposits should be regarded as yielding maximum limiting ages, but in their figure 5 (the hydrograph) and in their text, they assumed that wood and charcoal ages closely matched the time of deposition of the enclosing sediment. Currey and Oviatt (Reference Currey, Oviatt, Kay and Diaz1985) and Oviatt et al. (Reference Oviatt, Currey and Sack1992) also assumed that wood and charcoal ages were closely limiting, and most other previously published hydrographs were based on that assumption.
An example from Scott et al. (Reference Scott, McCoy, Shroba and Rubin1983) illustrates this point. They dated a wood sample (W-4898, labeled A in Fig. 2A) collected from transgressive-phase Bonneville deposits in a gravel pit near Kearns, Utah, in Salt Lake Valley (Fig. 1). Specifically, the sample was collected “near [the] base of [a] 0.5-m-thick lens of bluish-gray mud in [a] gravel-bar complex [which overlies] 2.5 m of lake gravel that buries soil formed in deposits of an older lake cycle” (Scott et al., Reference Scott, McCoy, Shroba and Rubin1983, table 4). The collection elevation was 1379 m, isostatically adjusted to 1365 m (1364 m in Scott et al., Reference Scott, McCoy, Shroba and Rubin1983). In figure 5 of Scott et al. (Reference Scott, McCoy, Shroba and Rubin1983), they show the transgression of Lake Bonneville to the elevation of the sample as being fairly close in age to the radiocarbon date. However, we show the transgression as being much younger than the date (Fig. 2A). Wood in mud interbedded with lacustrine gravel could easily be older than the lake transgression to that elevation. Our interpretation of that age as a maximum limiting age does not violate the original description of the sample or the analytical results.
An important aspect of our revision of the early portion of the hydrograph is the recognition that previously published 14C ages of samples of wood and charcoal from the early transgressive phase of Lake Bonneville should be regarded as maximum limiting ages rather than closely limiting ages. We view this as a more scientifically conservative approach and one that is compatible with reconciling previously published results with newly acquired data.
Mollusk samples
The interpretations of 14C ages of aragonite in mollusk samples are more complicated than those for wood or charcoal samples, because mollusk shells have the potential to be older than, the same age as, or younger than the sediment deposition, depending on local geologic contexts. Local geologic contexts include such processes as reworking of shells, radiocarbon reservoir effects from the water from which the shells precipitated, and postdepositional diagenesis and addition of 14C-enriched carbon. These processes are difficult to assess, and insufficient information is available to evaluate potential problems for individual samples from Lake Bonneville deposits.
An additional observation is consistent with the interpretation that 14C ages of aragonite in mollusk samples (mostly gastropods) have large geologic uncertainties. Mollusk 2σ calibrated age ranges form a scatter on Figure 2A in which similar ages are plotted over a broad elevation range (roughly ~1350 to ~1500 m). All these mollusk samples were obtained from sediments that were interpreted as having been deposited in Lake Bonneville. However, even allowing generous interpretations of the age ranges, they cannot all be correct, unless some very rapid and high-amplitude lake-level fluctuations are postulated, all older than the trend of maximum limiting wood ages shown in Figure 2A. No stratigraphic evidence exists for fluctuations of this type and age.
For this paper, we have chosen to interpret 14C ages of mollusks from the early transgressive phase as being of uncertain usefulness in determinations of depositional age. Published ages of mollusk shells from deposits of the early transgressive phase are shown in Figure 2A, but they are not used in the placement of the dashed blue line in the revised hydrograph.
Microbialite ages
Microbialites in the early transgressive phase of Lake Bonneville have been dated using 14C and U-Th dating techniques (Hart et al., Reference Hart, Quade, Madsen, Kaufman and Oviatt2004; Bouton et al., Reference Bouton, Vennin, Boulle, Pace, Bourillot, Thomazo and Brayard2016; Vennin et al., Reference Vennin, Bouton, Bourillot, Pace, Roche, Brayard and Thomazo2019; Pedone et al., Reference Pedone, Oviatt and McGee2023). The 14C ages of CaCO3 in microbialite samples could be influenced by radiocarbon reservoirs in the water from which the CaCO3 precipitated and/or by diagenetic alteration that adds younger CaCO3.
Microbialites might contain detrital grains that include older carbon-bearing minerals, such as reworked fragments of older carbonate deposits. Unlike CaCO3-bearing mollusks, however, the in situ microbialites discussed here cannot have been reworked or transported from their firmly attached locations on solid substrates. U-Th ages are independent of possible radiocarbon reservoirs in water, but inclusion of detrital U- or Th-bearing minerals or loss of U by diagenetic alterations could impact the accuracy of the measured age.
Ages of the microbialite from Death Point are fundamental to the revision of the Lake Bonneville hydrograph that is presented here, so it is important to detail why we are confident in these samples and ages. Pedone et al. (Reference Pedone, Oviatt and McGee2023) presented strong evidence that these microbialites were formed in a wave-agitated, shallow-water shoreline setting in the lake. Another strength of the Pedone et al. (Reference Pedone, Oviatt and McGee2023) study is that they obtained a total of 17 radiometric ages on one microbialite complex at Death Point: 10 ages for early transgressive microbialite and 7 ages for younger stratigraphic units that are not discussed in this paper. Hence, they established a good stratigraphic context for understanding the geologic history of the complex. The meaning and reliability of an isolated radiometric age can be difficult to evaluate if it has limited stratigraphic and geologic context within the basin.
To help assess the applicability of microbialite samples for both 14C and U-Th analyses, microbialite samples from Death Point were thoroughly examined in thin-section and by X-ray diffraction (XRD). Methods used to assess initial 230Th are detailed in Pedone et al. (Reference Pedone, Oviatt and McGee2023). Paired 14C and U-Th ages for one sample of microbialite (dates AA-112719 and RT-002C; Table 1) provide assessment of a radiocarbon reservoir at the time and place that particular microbialite was precipitated. The 14C and U-Th analytical uncertainties overlap. Because U-Th age analysis is independent of carbon, similarity of the paired 14C and U-Th ages provides a reasonable test that a radiocarbon reservoir was not significant at the time of precipitation and provides added confidence in evaluating the accuracy of the ages.
Three other 14C ages for transgressive-age microbialites in the Great Salt Lake basin of Lake Bonneville have been published: (1) ~25,700 cal yr BP from “tufa” (microbialite) near the entrance of Lakeside Cave in the Lakeside Mountains (Fig. 1) at an elevation of 1295 m (AA-20955; Hart et al., Reference Hart, Quade, Madsen, Kaufman and Oviatt2004); (2) ~26,100 cal yr BP from microbialite crust on Antelope Island (Fig. 1) at an elevation of 1281 m (sample POZ-77888 in Bouton et al. Reference Bouton, Vennin, Boulle, Pace, Bourillot, Thomazo and Brayard2016; Vennin et al. Reference Vennin, Bouton, Bourillot, Pace, Roche, Brayard and Thomazo2019); and (3) ~25,700 cal yr BP from microbialite crust on Antelope Island at an elevation of 1378 m (isostatically adjusted elevation of ~1357 m) (sample POZ-77887 in Vennin et al., Reference Vennin, Bouton, Bourillot, Pace, Roche, Brayard and Thomazo2019). The sample from near Lakeside Cave, AA-20955, was examined by J. Quade (personal communication, 2022) and found to be free of contamination from either older detrital grains or younger additions of carbon. Bouton et al. (Reference Bouton, Vennin, Boulle, Pace, Bourillot, Thomazo and Brayard2016) and Vennin et al. (Reference Vennin, Bouton, Bourillot, Pace, Roche, Brayard and Thomazo2019) reported that microbialite samples collected on Antelope Island (including POZ-77888) were examined by thin section and XRD, but specifics for these samples were not reported. These three samples were collected at locations far from the microbialites investigated by Pedone et al. (Reference Pedone, Oviatt and McGee2023), so undocumented radiocarbon reservoirs in those locations could have affected the radiocarbon ages reported by Vennin et al. (Reference Vennin, Bouton, Bourillot, Pace, Roche, Brayard and Thomazo2019) and Hart et al. (Reference Hart, Quade, Madsen, Kaufman and Oviatt2004).
The ages of AA-20955 and POZ-77888 indicate low lake elevations during the early transgressive phase of Lake Bonneville, similar to those indicated by microbialites from Death Point (Pedone et al., Reference Pedone, Oviatt and McGee2023; Fig 2A), and support the revision of the hydrograph presented in this paper. Date POZ-77887 (Vennin et al., Reference Vennin, Bouton, Bourillot, Pace, Roche, Brayard and Thomazo2019), however, suggests Lake Bonneville was at least 60 m higher about 25,700 cal yr BP than AA-20955, POZ-77888, and the ages from Death Point. Without further information about sample POZ-77887 (including its precise location and stratigraphic connections), it is difficult to interpret the age, and we have chosen not to use it in our reconstruction of lake history.
Carbonate cement
CaCO3 cement also has the possibility to form from a fluid not in equilibrium with atmospheric 14C, to include mineral inclusions, and/or to undergo diagenesis. Hence, as with samples of microbialite, selection of samples of cement for 14C and/or U-Th dating should include thin-section and XRD examination. This was done by Pedone et al. (Reference Pedone, Oviatt and McGee2023).
Because accuracy of 14C and U-Th ages can be affected by different factors, paired results with overlapping uncertainties provide added confidence in evaluating the ages. Table 1 and Figure 2A include ages of prismatic aragonite cement that partly or completely fills solution-enlarged pores in the microbialite at Death Point. Samples appear pristine, with no indication of diagenetic alteration, and consist of 100% aragonite in XRD analysis. Two cement samples have paired 14C and U-Th ages (Table 1). One pair has overlapping uncertainties, and one pair has ranges separated by ~480 yr (AA-112720 and RT-002D; Table 1).
The ~6000-yr-long time span defined by ages measured in prismatic aragonite cement samples from the Death Point microbialite (Table 1) indicate that prismatic aragonite precipitated a number of times during the formation of the microbialite. For example, two samples from a multilayer, 2-cm-thick prismatic cement are separated by 3000 yr (97-DP-9-2 inner layer, 97-DP-9-3 outer layer, Table 1). Although we cannot quantitatively define the time between deposition of the microbialite and precipitation of the prismatic aragonite cement in all cases, the U-Th ages of aragonite microbialite 97-DP-9-1 and aragonite cement 97-DP-9-2 (Table 1) are separated by ~1100 yr and 1 cm along the growth direction. This indicates a relatively short time for the shallow-water microbialite to become exposed and experience subaerial meteoric dissolution and enlargement of the pores, then to be resubmerged, and for aragonite cement to precipitate (Pedone et al., Reference Pedone, Oviatt and McGee2023). None of the pores that contain prismatic aragonite cement also contain geopetal sediment, an observation that also supports a minimal time lapse between formation of the pore and precipitation of cement. Although we cannot quantify the depth of water when the prismatic aragonite cement precipitated, the multiple times of formation of aragonite cement during the microbialite history and the relatively short time between secondary pore formation and fill suggest that water depth was likely not more than 10 m, similar to maximum fluctuations for historic Great Salt Lake.
Another age for cement precipitated during the early transgressive phase of Lake Bonneville was reported by Vennin et al. (Reference Vennin, Bouton, Bourillot, Pace, Roche, Brayard and Thomazo2019; sample POZ-79032; calibrated 14C age ~27,000 cal yr BP; NW Oquirrh Mountains; isostatically adjusted elevation of 1343 m). The specific description and mineralogy of POZ-79032 was not given by Vennin et al. (Reference Vennin, Bouton, Bourillot, Pace, Roche, Brayard and Thomazo2019), although the sample might be some of the botryoidal cement in their figure 7H. The age and elevation of this sample suggest the lake was ~60 m higher than the elevation suggested by samples of similar age at Death Point as presented in this paper and in Pedone et al. (Reference Pedone, Oviatt and McGee2023). Without further information, interpretation of POZ-79032 is problematic, and it was not used in the revision of the hydrograph.
Revision of the hydrograph for the early transgressive phase
The Bonneville deep-lake cycle was initiated by an abrupt rise about 30,000 cal yr BP (Fig. 2A). The level of the lake just before 30,000 cal yr BP, when the transgression of the deep-lake cycle began, is not known precisely, but the lake was likely to have been near its modern levels at that time, possibly close to 1300 m (Oviatt, Reference Oviatt2015). The lake experienced an abrupt rise of 20 m, or possibly slightly more, and was near an isostatically adjusted elevation of 1320 m when the Hansel Valley basaltic ash was erupted (Oviatt et al., Reference Oviatt, Currey and Sack1992; Miller et al., Reference Miller, Oviatt and Nash2008). The eruptive source of the ash has not been identified (Miller et al., Reference Miller, Oviatt and Nash2008), but its age in sediment cores from Great Salt Lake is ~30,000 ± ~1000 cal yr BP (Thompson et al., Reference Thompson, Toolin, Forester and Spencer1990, Reference Thompson, Oviatt, Honke, McGeehin, Oviatt and Shroder2016; Thompson, R.S., and Oviatt, C.G., unpublished information; Fig. 2A).
In Figure 2A, the dashed blue line includes multiple schematic lake-level fluctuations (the precise timing and amplitude of those fluctuations are not known) between about 30,000 and 24,000 cal yr BP. The approximate ages of some of those fluctuations have been determined from the 14C and U-Th ages of cement and microbialite at Death Point (Table 1), although the analytical uncertainties for those ages probably exceed the durations of the fluctuations; and it is likely that not all fluctuations have been determined at this point. The youngest age for the microbialite at a low elevation is about 24,000 cal yr BP.
One of the major implications of the revised hydrograph we are presenting here is that the age of the Stansbury shoreline will have to be reconsidered. We suggest that the Stansbury shoreline might be roughly 2000 cal yr younger than the age proposed by Currey et al. (Reference Currey, Oviatt, Plyler and Gurgel1983; i.e., ~23,000 rather than ~25,000 yr BP).
The interpretation that Lake Bonneville remained at low and fluctuating levels before the Stansbury oscillation is consistent with what little is known about the stratigraphy of algal-laminated marl (ALM) in the Bonneville basin (Oviatt et al., Reference Oviatt, Currey and Miller1990, Reference Oviatt, Pigati, Madsen, Rhode and Bright2018; Thompson et al., Reference Thompson, Toolin, Forester and Spencer1990, Reference Thompson, Oviatt, Honke, McGeehin, Oviatt and Shroder2016; Rey et al., Reference Rey, Mayo, Tingey, Nelson, Oviatt and Shroder2016). ALM is found at very low elevations in the Bonneville basin (Fig. 1) and low in the Lake Bonneville stratigraphic sequence, where it forms part of the laminated-marl subfacies of the Bonneville marl (Oviatt et al., Reference Oviatt, Habiger and Hay1994, Reference Oviatt, Pigati, Madsen, Rhode and Bright2018). ALM is composed of well-preserved algal filaments in finely laminated calcareous mud. The alga is probably a species of Cladophora (Oviatt et al., Reference Oviatt, Currey and Miller1990; Thompson et al., Reference Thompson, Toolin, Forester and Spencer1990), a benthic taxon that requires light for photosynthesis. Thus, the lake had to be shallow enough for sunlight to reach the bottom, likely no more than 50 m (Thompson et al., Reference Thompson, Toolin, Forester and Spencer1990; Pedone et al., Reference Pedone, Oviatt and McGee2023)—this interpretation is different from that of Oviatt et al. (Reference Oviatt, Currey and Miller1990), who thought ALM was deposited only once during a short-lived interval, in deep water while the Stansbury shoreline was forming. More work is necessary to understand the spatial and temporal variations in the deposition of ALM, but it is likely to have formed over an extended period, and possibly more than once in different areas, before the Stansbury shoreline formed. ALM appears to be stratigraphically lower than deposits of Stansbury age, and contrary to the interpretations of Oviatt et al. (Reference Oviatt, Currey and Miller1990), the lake would have been too deep during Stansbury time and during the subsequent lake-level rise for sunlight to reach the bottom.
Dated organic matter (calibrated 14C dates) from a total of nine samples of ALM from different parts of the Bonneville basin (Oviatt et al., Reference Oviatt, Currey and Miller1990; Thompson et al., Reference Thompson, Toolin, Forester and Spencer1990, Reference Thompson, Oviatt, Honke, McGeehin, Oviatt and Shroder2016; Rey et al., Reference Rey, Mayo, Tingey, Nelson, Oviatt and Shroder2016) are collectively consistent with its relative age at the base of the Bonneville stratigraphic sequence. All but one of the ages for ALM fall within the time interval 30,000-22,500 cal yr BP. The one anomalous age of ~19,000 cal yr BP (sample PVC22-1012-8 in Rey et al., Reference Rey, Mayo, Tingey, Nelson, Oviatt and Shroder2016,) cannot be correct, because by 19,000 cal yr BP, Lake Bonneville would have been more than 200 m deep in the area where the ALM sample was accumulating, and benthic photosynthetic algae would not have been growing at that depth. The stratigraphic position and approximate age range of ALM support the interpretation of deposition at relatively shallow water depths during the early transgressive phase of Lake Bonneville and a start of transgression to the Stansbury shoreline after 24,000 cal yr BP.
Another indication that lake level was generally low early in the transgressive phase of Lake Bonneville comes from an interpretation of a layer of mirabilite found in shallow cores along the Southern Pacific railroad causeway that crosses Great Salt Lake (Currey, Reference Currey1988). Mirabilite is hydrated sodium sulfate and precipitates in saline lake water when temperatures are low (Jones, Reference Jones1965). Currey (Reference Currey1988, table 1) reported an estimated radiocarbon age of about 20,900 yr BP (about 25,000 cal yr BP) for the mirabilite layer. Oviatt et al. (Reference Oviatt, Currey and Miller1990, p. 302) noted that the age (~25,000 cal yr BP) was similar to the presumed age of the Stansbury shoreline and devised an elaborate interpretive scheme for the deposition of the mirabilite in deep water. However, it makes more sense to interpret that mirabilite layer as having been precipitated in shallow water, and that interpretation fits well with the interpretation of the lake cycle presented in this paper. The mirabilite bed, about 25,000 cal yr old, reported by Currey (Reference Currey1988) has not been found in other places in the Bonneville basin—further work is needed on that mirabilite.
The dashed blue line in Figure 2A, representing the revision suggested in this paper, intersects with the dashed black line of the hydrograph of Oviatt (Reference Oviatt2015) between about 22,000 and 23,000 cal yr BP at an isostatically adjusted elevation of about 1450 m. The part of the chronology between about 22,000 cal yr BP and the Bonneville flood at about 17,500 cal BP (Oviatt Reference Oviatt2020) has not been reviewed critically, and no new information is currently available for that time interval.
Paleoclimate implications
The abrupt lake rise after about 24,000 cal yr BP to elevations roughly equal to or higher than the Stansbury shoreline has not been thoroughly studied at this point. If taken at face value from the revised hydrograph (Fig. 2A) and not including fluctuations, such as those associated with the Stansbury oscillation (Oviatt et al., Reference Oviatt, Currey and Miller1990), the average rate of lake-level rise would be about 90 m/1000 yr (rise from ~1300 to ~1450 m between ~24,000 and 22,300 cal yr BP). This is a much higher rate of transgression than previously suggested for Lake Bonneville. For comparison, part of the hydrograph of Lake Lahontan in the western Great Basin shows a rise of about 95 m/1000 yr (estimated from fig. 12 in Reheis et al. [Reference Reheis, Adams, Oviatt and Bacon2014] between about 17,500 and 16,500 yr BP), and part of the hydrograph of Pleistocene Lake Lisan (Dead Sea basin in Israel and Jordan) shows a rise of >130 m/1000 yr (estimated from fig. 2 in Torfstein et al. [Reference Torfstein, Goldstein, Stein and Enzel2013] between about 31,500 and 30,500 yr BP). Therefore, although the estimated transgressive rate we present here for Lake Bonneville is rapid, it is not unprecedented in reconstructions of the histories of other large Pleistocene lakes on Earth.
The cause of the post–24,000 yr abrupt rise of Lake Bonneville has not been determined, but perhaps it was connected in some way to the increase in the volume of glacial ice that led to the global last glacial maximum (LGM; Clark et al., Reference Clark, Dyke, Shakun, Carlson, Clark, Wohlfarth, Mitrovica, Hostetler and McCabe2009) or to the beginning of the local LGM in the Bonneville basin (Laabs and Munroe, Reference Laabs, Munroe, Oviatt and Shroder2016). Hemming (Reference Hemming2004) has reported the age of Heinrich event 2 as about 24,000 cal yr BP, and the changes in climate associated with that event may be involved in some way. The relationship between lake-level change in Great Basin Pleistocene lakes and Heinrich events in the North Atlantic Ocean, however, has not been well deciphered (Nelson and Jewell, Reference Nelson and Jewell2015); both lake-level rises and lake-level falls have been attributed to hemispheric climate changes associated with Heinrich events and other iceberg-rafting events (Oviatt, Reference Oviatt1997; Munroe and Laabs, Reference Munroe and Laabs2013; McGee et al., Reference McGee, Moreno-Chamarro, Marshall and Galbraith2018).
Antevs (Reference Antevs1948) hypothesized that the Northern Hemisphere ice sheets (Laurentide and Cordilleran) attained sufficient elevation during the LGM to influence atmospheric circulation and thus to divert storm tracks toward the Great Basin, although the relationship between Northern Hemisphere ice sheets and global circulation is not simple (Oster et al., Reference Oster, Ibarra, Winnick and Maher2015). Temperatures were lower when lakes reached their maximum sizes (Ibarra et al., Reference Ibarra, Egger, Weaver, Harris and Maher2014; Belanger et al., Reference Belanger, Amidon, Laabs, Munroe and Quirk2022). Belanger et al. (Reference Belanger, Amidon, Laabs, Munroe and Quirk2022) show that a decrease in temperature was probably more important than an increase in precipitation with regard to causes of the changing levels of Lake Bonneville. The currently available evidence from the Bonneville basin, as presented in this paper, indicates rapid lake-level changes occurred; they should be included in future attempts to decipher the paleoclimate and the climatic controls on lake-level changes.
Summary
After an initial abrupt rise in lake level of about 20 m about 30,000 cal yr BP, Lake Bonneville experienced a series of low-level fluctuations during the ensuing 6000 yr before abruptly rising by more than 100 m after about 24,000 cal yr BP. Subsequently, the lake rose to its highest level, more than 270 m higher than the modern Great Salt Lake, and culminated in the formation of the Bonneville shoreline. The Stansbury shoreline formed during the transgressive phase sometime after about 24,000 cal yr BP. This scenario is different from that presented in previous hydrographs, and future work will undoubtedly test and expand upon these revisions.
Acknowledgments
We are grateful to all our Lake Bonneville colleagues, with whom over years of study, we have had many productive discussions and interactions. Dave Miller and Bob Thompson read earlier drafts of this paper and provided us with valuable specific suggestions and thoughts that helped us improve the presentation. Thanks to Alison Smith for helpful review comments. We declare no outside funding or conflict of interest for this study.



