Poverty has traditionally been understood as a lack of resources necessary to fulfil essential needs, such as healthy nutrition, shelter and clothing, to an adequate standard. The inability of this approach to adjust to changing perceptions of what constitutes essential needs and adequate standards has led to its gradual replacement by a relative definition. In the developed world, it has become common to consider people poor if their resources fall short of the average income in their country of residence by a particular percentage, unrelated to their purchasing power in terms of goods and services. Poverty is defined within a social context, and a relative poverty measure translated this insight into a measurable indicator.
Individual aspirations change with economic development and so do social norms. Two individuals with identical consumption patterns, one placed in a very prosperous society and one placed in a very poor society, can experience considerable differences in the extent to which they are able to engage in activities customary in their respective societies. Relative poverty lines, set as a fixed percentage of national median incomes, implicitly rely on the assumptions that there is a linear relationship between average living standards and the cost of social inclusion, and that national medium income earners are the social standard setters of society. This article argues that relating poverty lines to national median incomes does not anchor them in their social context.
Relative poverty indicators have often been criticised for their detachedness from poor people's actual consumption possibilities. Defenders of absolute poverty measures have argued that a very wealthy but unequal society would display a higher poverty rate than a very poor but egalitarian society (Sarlo Reference Runciman2007). This conventional criticism misses the point, because relative poverty indicators were never meant to measure people's material living standards per se.
This article approaches relative poverty lines from a very different angle: It evaluates them by their own standards, asking whether they are really a reflection of the social norms and attitudes of a particular time and place. It also asks whether they capture all important developments that affect the relative position of the poor, i.e. whether relative poverty standards are actually as relative as they profess to be. It will be argued that relative poverty measures suffer from serious shortcomings that can lead to incomplete or even counterproductive policy conclusions. An alternative measure will be proposed, which should go a long way towards overcoming the identified weaknesses.
Section II summarises the arguments that gave rise to the relative measurement of poverty. Sections III and IV review parts of the subjective well-being (SWB) literature on comparison income effects, i.e. the notion that people feel rich or poor depending on how their living standards compare with those of their peer group(s). Falling behind a peer group is not the same as relative poverty – which is concerned with social participation, not with envy or keeping up with the Joneses – but if the distance to the domestic median really determines the extent of social inclusion, then this relationship might well show up in SWB studies. Interpersonal comparisons do take place, but they do not follow an easily generalisable pattern. Changes in the boundaries within which the median, and thus the poverty line, is calculated have a strong effect on the poverty rate. This will be demonstrated by order-of-magnitude estimates for three hypothetical countries. Section V shows how the use of relative poverty standards can lead to the omission of important information. Developments in product markets which are of relevance to the relative situation of the poor, for example price hikes in goods which occupy a large share in their budgets, are not captured. Conventional absolute poverty measures are not a suitable alternative. They either suffer from similar problems as relative ones, or they replace shortcomings of relative indicators with shortcomings of their own. The concept of socially situated poverty does not easily lend itself to measurement and operationalisation, and therefore any poverty indicator that attempts to be socially relevant will suffer from a certain degree of arbitrariness and crudity. Section VI argues that a combined ‘Consensual Material Deprivation’ and ‘Budget Standard Approach’ might be the least bad out of a number of unsatisfactory options. Section VII shows how the new measure could be used.
The sensitivity of poverty analysis to the choice of indicator
Early attempts to measure poverty systematically were based on a Budget Standard Approach (BSA). The research of Charles Booth and Seebohm Rowntree in nineteenth century Britain defined households as poor if they were unable to afford a basket containing a specific quantity and quality of food, housing, clothing and several miscellaneous goods (Reference RowntreeRowntree, 1922, reprinted 1997).
Peter Townsend (Reference Townsend1954), identified a grave inadequacy in these data. Comparing Booth's and Rowntree's poverty standards with the actual consumption patterns of the poor revealed that even when people experienced a severe lack of resources, they never devoted all of their spending to physical needs, but always reserved a share for social life. The absolute poverty standard, then, did not reflect what poor people needed, but rather what social scientists thought they should consume. This mismatch gave rise to a line of critique which held that an absolute standard ignored the fact that people do not live in a vacuum, but in a social context. Townsend (Reference Townsend1954, p. 134) wrote: ‘The pattern of spending among poor people is largely determined by the accepted modes of behaviour in the communities in which they live’. He later added: ‘Society itself is continuously changing and thrusting new obligations on its members. They, in turn, develop new needs. They are rich or poor according to their share of the resources that are available to all’. (Townsend Reference Townsend1962, p. 225). Similar positions were brought forward by Galbraith (Reference Galbraith1958) and Fuchs (Reference Fuchs1965). Conceiving poverty in relative terms advanced the insight that a person who is able to maintain his or her physical health, but not to participate in the customary social life of his or her society, is still a poor person. Poverty is not a fixed, clearly definable state. Most people's understanding of what constitutes poverty has changed significantly over time and will continue to do so. Absolute poverty indicators, even if they included a social life component, are inadequate.
Relative poverty indicators attempt to formalise the insight that poverty has a context. In the developed world, this has become the most widely used way to measure poverty., (Scruggs and Allan Reference Scruggs and Allan2006, p. 883). This shift has made poverty analysis highly sensitive to the underlying definition of poverty itself. Applying two or more poverty definitions to the same data set usually produces very different poverty profiles of that population. It is not simply the poverty count that differs across poverty definitions. Different poverty indices also display different time trends, identify different risk groups, and correlate with different socioeconomic variables (see Blackburn Reference Blackburn1998, p. 460; Boarini and d'Ercole Reference Boarini and d'Ercole2006; Bradshaw and Finch Reference Bradshaw and Finch2003; Brewer et al. Reference Brewer, Muriel, Philips and Sibieta2008, p. 72–78; Kenworthy et al. Reference Kenworthy, Epstein and Duerr2009; Marks Reference Luttmer2007; OECD, 2008, Figure 1.6 and pp. 129–130; Scruggs and Allan Reference Scruggs and Allan2006; van den Bosch et al. 1993, pp. 248–253).
Different poverty indices provide very different, and often conflicting policy conclusions. Cross-sectional and time series analyses which regress poverty rates against a set of economic, policy-related and sociodemographic variables are usually based on relative indicators. These studies often conclude that economic growth (and related variables) is of minor importance in reducing poverty, and/or that redistributive efforts (and related variables) are the most important determinant of poverty (Scruggs and Allan Reference Scruggs and Allan2006, pp. 900–901; Kenworthy Reference Kenworthy1998; Brady Reference Brady2003, pp. 571–577; Moller et al. Reference Moller, Huber, Stephens, Bradley and Nielsen2003, p. 44; Mitchel Reference Meyer and Sullivan1991; Förster Reference Förster1993; Korpi and Palme Reference Korpi and Palme1998; Kim Reference Kim2000; Lohmann Reference Lohmann2006; Marx Reference Marx2007). This provides a very different outlook on poverty policies than the findings of Harberger (Reference Harberger, Vito and Chu1998, p. 203), as well as Dollar and Kraay (Reference Dollar and Kraay2001), who focus on absolute living standards of those at the bottom of the income distribution, consistent with Booth's or Rowntree's original Budget Standard Approach. Their recommendations for anti-poverty policies largely coincide with recommendations for across-the-board income growth. Studies concerned with relative living standards, in contrast, treat anti-poverty measures as a distinct set of policies, bearing little relation to general economic policy.
There is a large body of empirical evidence suggesting that, controlled for other factors, income redistribution often conflicts with the objective of economic growth and hence absolute living standards. Growth-inhibiting effects have been found for the level of taxation and for the steepness of tax progression, be it taxation of employment earnings, capital gains, or business profits (see Heath Reference Heath2006, pp. 28–37 for a summary of the empirical literature; and Trabandt and Uhlig Reference Trabandt and Uhlig2009, for a recent estimate of ‘Laffer curves’). Further, income redistribution can conflict with incentives to take up work and/or progress in the labour market (see Krueger and Meyer Reference Krueger, Meyer, Auerbach and Feldstein2002, for a review of the empirical literature). Social policy is more often about imperfect trade-offs and a choice of a lesser evil than about promoting several desirable ends simultaneously. The concept of relative poverty suggests that in case of doubt, the poor would be better off foregoing a rise in living standards, as long as the median income households forego an even bigger rise. Since this is a very stark assumption, we should expect the evidence supporting it to be especially strong. If it is not, there would be a strong case for finding a poverty measure which avoids this.
Relative to what? The geographic dimension
With economic progress, social norms change, and so do perceptions of what constitutes necessities and acceptable standards. Over the past century, electricity, indoor bathrooms, telephones and a number of other items have passed from being viewed as desirable amenities to necessities. A poverty standard not including these items would not be considered relevant today; a poverty standard including them could hardly be applied retrospectively. But how exactly does this adaptation process take place? Can it be expressed as a function of average income growth, as relative poverty indicators do?
In principle, information about how people's perceptions of their living standards are affected by the living standards of others around them can be obtained from research on subjective well-being (SWB). SWB-studies take people's self-assessed life satisfaction (or sometimes a narrower subset such as job satisfaction or consumption satisfaction) as the dependent variable. It is then regressed against a set of variables deemed to affect well-being, such as age, marital status, employment status, state of health etc. Crucially, these explanatory variables usually include both the respondent's income, and the income of an imputed reference group or the ratio of the two.
A merging of SWB-research and poverty research has to be treated with caution. The idea of reference group formation and evaluating living standards against a benchmark is based on Runciman's (Reference Runciman1966) theory of relative deprivation, which is not the same as relative poverty. The latter is an objective measure, indicating how many people fall far behind the average living standard of their country. Relative deprivation, as developed by Runciman, is not so much about income gaps per se, but rather about income gaps that are perceived as unfair or arbitrary. These concepts can, but do not have to overlap. In a society where the gap between rich and poor is narrow, but where the small lead enjoyed by the better off is widely perceived to be unmerited, there would be relative deprivation, even if relative poverty is low. The opposite would occur in a society where income differences are large, but generally tolerated. Relative poverty attempts to reflect whether people at the bottom of the income distribution can participate in mainstream society, not whether income differences are perceived to be fair, or whether the poor consciously compare themselves to others.
The idea that subjective well-being is measurable and explainable, remains hugely controversial. Johns and Ormerod (Reference Johns and Ormerod2007) find that SWB-studies are beset with a multitude of statistical and conceptual problems, and studies do not permit strong policy conclusions. At best, they can identify very general patterns.
Nevertheless, it is worth reviewing whether there is some identifiable relationship between SWB, absolute and relative living standards, controlled for other factors. Relative measures can provide problematic signals. A policy that leads to an increase in the real incomes of the poorest would not be poverty-reducing. It would appear poverty-augmenting, if it also leads to an increase in median incomes by the same or a larger magnitude. But is there evidence for the existence of a social exclusion effect resulting from increases in median incomes, and if so, is this effect so strong that it more than outweighs the benefits resulting from material gains? SWB-studies, despite all their faults, may well be the only type of empirical evidence in which such a relationship would show.
SWB-studies do suggest that interpersonal comparisons take place, and that people's well-being is adversely affected if they become relatively worse off, other things equal. The imputed peer group's income usually enters negatively and significantly, and its coefficient is sometimes as large in magnitude as that of the respondent's own income, or even larger. However, what these studies find hard to achieve is to identify the relevant comparison group, and to approximate the comparison income. Some studies on SWB include the national median income or the respondent's position in the national income distribution as an independent variable, hence assuming that the national population represents the comparison group (Easterlin Reference Easterlin1995; Blanchflower and Oswald Reference Blanchflower and Oswald2004, referring to Britain). These findings would be consistent with conventional relative poverty lines. But many authors assume a much narrower, localised reference group, defined at the level of the region (Ferrer-i-Carbonell Reference Ferrer-i-Carbonell2005; Blanchflower and Oswald Reference Blanchflower and Oswald2004, referring to the US), the municipality (Luttmer Reference Luttmer2004; Clark and Oswald Reference Clark and Oswald1996) or even the neighbourhood (Kuhn et al. Reference Kuhn, Kooreman, Soetevent and Kapteyn2008).
Could poverty standards be defined over territories different from the national one? Rainwater et al. (Reference Patanzis, Gordon, Townsend, Patanzis, Gordon and Levithas2003), as well as Kangas and Ritakallio (Reference Kangas and Ritakallio2004), explore how relative poverty rates change in a number of countries if the poverty line of each region is tagged to the median income of that region itself, as opposed to the national median. They show that in larger countries such as the US, Italy and Spain, regional relative poverty rates can easily double in the more prosperous regions, and fall by half in the structurally weaker ones. For Western Europe, several indicators show that within-country differences in the level and distribution of incomes are often more pronounced than cross-country differences (ibid., pp. 11–15).
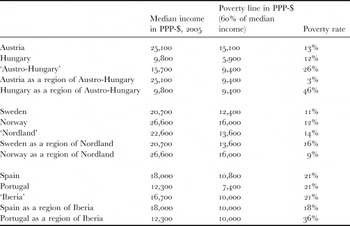
To see how a change in boundaries in the other direction would change the picture, I have calculated relative poverty rates for a hypothetical reunified Austro-Hungary. The two nations were chosen for their shared history. OECD data for PPP-adjusted Dollar referred to deciles instead of percentiles, so I had to make the simplifying assumption that within each income decile, the income difference between two neighbouring percentiles is constant. This is certainly not the case, but it gives an order of magnitude.
Tagging the poverty line to the median income of Austro-Hungary, the relative poverty rate of Austria would drop from 13 per cent to 3 per cent, and rise from 12 per cent to 46 per cent in Hungary. Similarly, if Sweden and Norway were merged into a fictive country, termed ‘Nordland’ in Table 1, relative poverty would rise from 11 per cent to 16 per cent in Sweden, and fall from 12 per cent to 9 per cent in Norway. Merging Spain and Portugal as ‘Iberia’ results in the Spanish poverty rate falling from 21 per cent to 18 per cent and the Portuguese rate rising from 21 per cent to 36 per cent.
Poverty rates in three hypothetical countries

Source: author's calculation based on data from OECD (2008)
Eurostat (Reference Easterlin2008, p. 42) takes this idea a level higher, by providing data on what poverty rates would look like against a threshold of 60 per cent of the median income in the EU-25. Poverty rates then drop to below 10 per cent in much of Western Europe, and rise to above 70 per cent in many Eastern European nations.
There is a clear cut case for favouring the national level as the relevant domain of poverty analysis, because the key social policy decisions, too, are taken at the national level. However, the whole concept of relative poverty is based on the notion that poverty must be viewed in the context of prevailing social norms. Ideally, the geographic area over which a relative poverty rate is defined should approximate the geographic area over which social norms are formed, regardless of administrative arrangements. Responsibility for social and economic policies can be relocated to other levels (in the course of devolution or European integration), but the formation of customary consumption habits would not be affected. It would even be compatible with the logic of relative poverty to draw up a social norms formation map where boundaries are set according to cultural instead of administrative criteria. For example, Falck et al. (Reference Falck, Heblich, Lameli and Suedekum2010) divide areas by a linguistic similarity index, which, they argue, acts as a proxy measure of cultural similarity and can explain real economic phenomena.
There are numerous plausible alternatives to the national level as the domain of poverty assessment, and each one could deliver a fundamentally distinct picture of relative poverty. People do live in societies which place norms and expectations upon them, and a poverty indicator must not ignore that. But it should be robust to minor definitional changes such as an alteration of the domain. The challenge is to maintain relativity in the sense of contextuality, while overcoming relativity in the sense of relative to the average income of an arbitrarily defined area.
Relative to what? The social group and intertemporal dimensions
Conventional relative poverty indicators take median incomes as an approximation of the living standards of mainstream society within a given territory. Implicitly, there is an assumption that median income earners are the standard setters of social norms, and that the relationship between their living standards and social norms is a linear one. SWB studies do not unequivocally support this view. They usually define the reference group in a much more disaggregated way, allowing for a multitude of separate or overlapping reference groups. McBride (Reference McBride2001) uses a model in which comparison only takes place between citizens of the same age group.Footnote 1 Ferrer-i-Carbonell (Reference Ferrer-i-Carbonell2005) defines the reference group even more narrowly as people of the same age group, education level and region. Similarly, van de Stadt et al. (Reference van den Bosch, Callan, Estivill, Hausman, Jeandidier, Muffels and Yfantopoulos1985) define the reference group as people of the same age group, education level and employment status. Clark and Oswald (Reference Clark and Oswald1996) specify a model in which the comparison group consists of people in the same town, age group, education level, employment category, and business sector.
The picture is further complicated by the findings of Fafchamps and Shilpi (Reference Fafchamps and Shilpi2008), who show that the process of reference group formation can vary between municipalities within the same country, depending on their degree of integration into wider patterns of exchange. They also show that comparison effects vary with the composition of spending, because people display a low tolerance towards inequalities in the consumption of some goods (e.g. healthcare), and a high tolerance towards inequalities in the consumption of other goods (e.g. clothing).
In most of the literature on SWB, the time dimension plays no role at all. In a model in which an agent's well-being is not only a function of other people's present consumption, but also of other people's and the agent's own past consumption (such a model is used by Aronsson and Johansson-Stenman Reference Aronsson and Johansson-Stenman2008), conclusions can change substantially. Relative measures convey information about differences in living standards between the middle and the bottom of the income distribution at a given point in time. This is consistent with the assumption that the living standard of the median income earner today defines the social norms of today. But if we allow for a time lag between an increase in median income and an upward adjustment in social norms, then the income distribution at a given point in time is no longer the only variable to be considered. The speed at which low earners advance towards median incomes of the recent past also becomes important. A real-world example would be the ‘Irish Paradox’, which Hills (Reference Hills2004, p. 42) describes in the following terms:
‘[I]n the late 1990s in Ireland overall incomes were rising very rapidly, but incomes at the bottom rose less fast than the average. The poor were a lot better off in real terms than they had been, but relative poverty still rose. This jarred with public perceptions of what poverty constituted, since it had not adjusted upwards as fast as average living standards.’ (See also UNICEF, 2005, p. 7, on the ‘Irish Paradox’.)
In short, there is no reason why the median income household of a given territory at a given point in time should be a standard setter of social norms, or even a particularly important focus of comparison.
Ideally, a poverty standard should reflect some minimum common denominator across social groups on what is required to live a decent life in a particular time and place. It should avoid the pitfall of absolute indicators, which pretend that changes in the living standards of others around us have no impact on our perceptions of needs and necessities. But it should equally avoid the pitfall of automatically treating rising median incomes as a liability for the poor, even as their own living standards are rising.
Product markets, relative prices and relative poverty
The national income distribution is far from being the only determinant of differences in people's consumption experiences. Developments in the product markets can also have vastly different effects on different income groups, even as the nominal income distribution remains constant. For example, according to estimates by the Institute for Fiscal Studies (2008 and 2009), different income groups in the UK faced different inflation rates in recent years. Low-income households have experienced inflation rates that substantially exceeded the official rate, because of above-average rises in cost items with an above-average share in their budgets such as food and domestic energy. Conventional relative poverty indicators do not reflect this. By the same token, policies that would enable pronounced price decreases in markets which are most relevant for the poor for example easing market entry and fostering competition, will not be identified as poverty-reducing measures.Footnote 2 Critics of relative measures sometimes propose fixed poverty lines as a reasonable alternative (Saunders Reference Sarlo2009, pp. 13–15). However, conventional absolute poverty indicators, too, are largely blind to changes in the relative price structure. They are generally updated by the change in the Consumer Price Index. But the CPI is based on the cost of a consumption basket representing the purchases of a typical household. It was never meant to represent the purchases of low-earners.
In the UK, the government has pursued an ambitious policy agenda to reduce child poverty since the late 1990s, focussed mainly on income transfers. But at the same time, the large gap between relative poverty before and after housing costs has not been reduced (IFS, 2008). Housing costs represent 18 per cent of the poorestFootnote 3 decile's total expenditure, compared to 10 per cent for the fifth decile (ONS, 2008, p. 42). Supply side reforms aimed at bringing down the cost of housing might have been a feasible alternative at lower cost to the Treasury. But it would not have shown in the government's child poverty targets, which are based on income figures before housing costs.
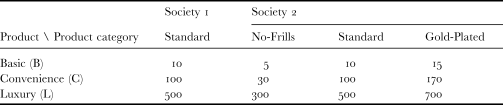
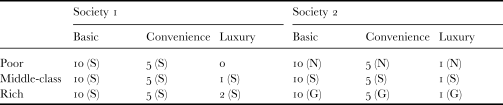
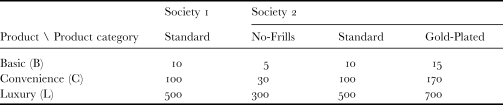
Consumption patterns of three income strata in two hypothetical societies The income distribution in two societies; income in gold coins Product markets in two societies; prices in gold coins Consumption patterns in two societies; quantities purchased
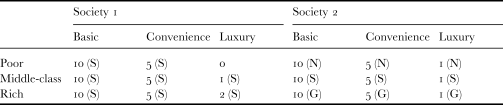
Consumer price indices often neglect important developments in market structures and consumer responses. Meyer and Sullivan (Reference McKay2007, p. 5) noted that the US CPI suffers, among other shortcomings, from an outlet bias, which is ‘the inadequate accounting for the movement of purchases toward low price discount or big box stores’. Yet the emergence of low-price discounters and no-frills market segments is also a development which has the potential of making the consumption patterns of low-income earners more similar to those of middle income earners. This can be illustrated by considering two highly stylised, hypothetical societies with three social strata, each representing one third of the respective population, and three types of consumer goods. All individuals within one stratum are assumed to have the same income and the same consumption pattern, and there is neither saving nor borrowing. The three strata are the poor, the middle-class and the rich. Median incomes are identical in both societies, but, as Table 2a shows, the income distributions differ.
Society 2 is the more unequal one in terms of the income distribution. However, to know whether this translates directly into more unequal consumption behaviour, more information about these societies and the structure of their product markets is needed. The products available in both societies, and their respective prices in gold coins, are given in Table 2b. The three consumer goods are basic (B), convenience (C) and luxury (L) good, and the exact same good carries the same price across both societies.
Product markets differ strongly between both societies. Society 2 has diversified product markets, where each product comes n three versions: A very basic no-frills version (N), a standard version (S), and a gold-plated version (G) with many extra features. (Airline travel or household electronics would be realistic examples.) There is no product market diversification in Society 1, so only the standard version of each product is available there. Table 2c shows how this results in different consumption patterns. For the sake of simplicity, it will be assumed that the poor only buy no-frills products, the middle class only buys standard products, and the rich only buy gold-plated ones.
In Society 1, more money buys more goods and services; in Society 2, more money buys extra product features and enhancements. There is no way of knowing how this affects the welfare of the poor in both societies, but it is no longer obvious which society is the more unequal one. To an outside observer who is not familiar with the precise characteristics of the products, people's everyday consumption behaviour in Society 2 would appear fairly similar across income strata. In Society 1, consumption decisions are more often binary decisions; where people can or cannot afford a particular good. In Society 2, this binary becomes a continuum.
There is not necessarily a conflict between an equitable income distribution and the presence of highly developed and diversified markets. However, in recent debates, rising inequality in the industrialised world has often been associated with skill-biased technological change (see Card and DiNardo Reference Card and DiNardo2002), and with intensified trade with labour-intensive low-wage economies (see Alderson and Nielsen Reference Alderson and Nielsen2002). Yet these factors are also associated with the emergence of low-cost substitutes.
Again, conventional absolute poverty indicators cannot be an alternative. They are just as inept at detecting these changes as relative indicators are. They are updated by the changes in the CPI, which provides no information on changes in product markets which are specifically relevant for the poor. But if a poverty indicator could be devised in such a way that it captures market developments which change the relative consumption behaviour of the poor, even if the distribution of nominal incomes were unchanged, then it would provide a different policy emphasis than conventional relative and absolute poverty rates. It would be less concerned with the nominal income distribution, and more with relative price changes and developments in product markets which are of particular relevance to low-income households. Policies which promote competition and productivity growth in these markets, diversification and the emergence of low-cost segments might then become an important part of an anti-poverty strategy.
Towards a combined consensual material deprivation and budget standard approach indicator
Poverty is a highly abstract concept, and there will never be a strong consensus on what it constitutes and how it should be measured. But nevertheless, an indicator which resonates with what many people in a given society perceive as a modest but decent minimum standard would be a useful tool for poverty researchers and perhaps civil society actors like charities. The Budget Standard Approach may have been discarded too quickly as a potential candidate for such an indicator.
A BSA would respond to changes in relative prices. If the price of one or several items on the list increased (decreased), then, other things equal, the poverty line would rise (fall) and a higher (lower) poverty rate would result, even if the inflation rate and the nominal income distribution were unaffected. A BSA-list could also be amended regularly to accommodate emerging low-cost alternatives of hitherto expensive products. It could thus reflect developments in product markets with relevance for the poor, even though it could by no means solve this matter perfectly. There is no clear-cut way of establishing whether product X is a low-cost alternative for product Y, or whether it lacks so many of Y's features that it has to be considered a distinct product. Microeconomic theory offers no guideline about where one market ends and another one begins, so decisions would involve arbitrary judgements. Still, this would be an improvement over conventional relative and absolute indicators, which do not incorporate these developments at all.
The major challenge, then, is to make the BSA socially relevant, and find a mechanism to update it over time in a way which tracks changes in social perceptions more accurately than relative and conventional absolute indicators do. A possible way of achieving this is to select the items in the BSA-list in a democratic way, as consensual material deprivation (CMD) indicators as the Poverty and Social Exclusion (PSE) survey in Britain does. The PSE survey (see Gordon et al. Reference Gordon, Levitas, Pantazis, Patsios, Payne, Townsend, Adelman, Ashworth, Middleton, Bradshaw and Williams2000 and Patanzis et al. Reference Patanzis, Gordon, Townsend, Patanzis, Gordon and Levithas2006) presents respondents with a list of items and asks them to identify the possession of which of these they view as necessary, as opposed to merely desirable. Items score as necessities when a majority views them as such. Judging from the PSE, there appears to be minimum social consensus on what constitutes necessities, which does not differ systematically across regions and social subgroups. As the authors of the PSE survey emphasise, the important insight is not that there is a perfect consensus on what necessities are. But for those items which a majority considers necessities, deviations from this majority view are unsystematic ones: ‘otherwise, the definition of a necessity would just become the opinion of one group against another’ (ibid p. 114). A potential weakness of the PSE is that there seems to be a certain bias towards goods and against services. But the PSE could provide a reasonable point of departure if it was slightly rebalanced, and if a similar minimum consensus emerged for services as well.
A general trend apparent from the PSE is that the perception of necessities becomes more encompassing over time. Hence, a poverty line derived from these responses would rise over time, but there is no reason why it should be a fixed fraction of median incomes.
Pure CMD standards have been criticised for relying exclusively on people's self-classification. People are asked whether they possess the identified necessities, and are assigned a deprivation score depending on the number of items they profess to lack involuntarily. But people who lack necessities have sometimes been found to possess luxury items at the same time (McKay Reference McKay2004; Myck Reference Myck2005). Material deprivation standards can conflate deprivation with preferences. Moreover, some, though not all of the items contained in the PSE survey represent very broad product categories which can mean different things to different people. Categories like leisure equipment or a holiday away from home encompass a broad spectrum reaching from luxury to very basic products. Therefore, in the combined BSA-CMD indicator proposed here, the precise specification of the products would be streamlined. A way to do this is to use actual spending patterns among lower income strata, revealed in large-scale expenditure surveys like the British Living Cost and Food (LCF) survey, as a guideline. From these surveys, more tangible products can be selected, on the basis of being representative purchases of people on low incomes. The prices of these products would be collected and added, their sum representing the poverty line. People would be categorised as poor or non-poor depending on whether their income, or spending, exceeds the poverty line or not. If they choose to forego some of the items on the list and consume other things instead, they would not be considered poor. What matters is whether they could afford all the items on the list if they so chose. Household expenditure, net of debt repayment, would be a better approximation of living standards than household income for this purpose.
Datasets like the LCF cover a longer period, which enables them to include infrequent purchases such as consumer durables. They also contain some information on the maintenance cost of particular goods, such as the cost of repair and insurance. This should enable a poverty standard to include current costs as well as investment costs. A similar logic should apply to the incorporation of housing costs. The cost of housing should be oriented towards local rent levels around the lower end of the price scale. If individuals with an income/expenditure above the cost of the basket choose to live in an expensive area, and if their income/expenditure after housing costs falls below the cost of the basket minus the housing elements, they would not be counted as poor. This would be considered a personal choice, just like foregoing some elements of the basket in order to afford others. Especially in large cities, rent levels may differ immensely across neighbourhoods. There can be no objective criteria for deciding which should be deemed acceptable places to live, so that their rent level can be taken for the basket. Taking rents as a proxy of housing costs is also simplistic because it assumes that mortgage-paying owner-occupiers face similar housing costs as rent-paying tenants, while owner-occupiers that have paid off their mortgages are not treated differently. However, despite these disadvantages, the BSA-CMD indicator would still be an improvement over conventional poverty indicators, which do not take local differences in housing costs into account at all.
Uses and limitations of the new measure
Contrary to a relative indicator, a BSA-CMD indicator could display falling poverty rates in times of rising inequality in the bottom half of the income distribution. This would occur whenever incomes at the bottom grow faster than social norms adjust upwards. It would also occur when the additional income growth enjoyed by middle income earners is channelled into the purchase of goods which do not affect social norms (e.g. some entirely non-positional goods). Upward-adjustments of social norms could be partially or fully offset, or even outweighed, by price decreases with a pro-poor-bias. The same is true for the emergence of low-cost substitutes, which bring previously unattainable goods into the reach of the poor.
A BSA-CMD indicator would become more demanding with changing social norms – but it would not mechanically follow median incomes. For this reason, it would give a more accurate picture of the evolution of poverty within a country across time. It would effectively measure how the real income or expenditure of the poor develop relative to the cost of social inclusion, but without assuming that the cost of social inclusion evolves proportionally to national median incomes. In principle, it should also be suitable for international comparisons. If the cost of social inclusion differs across countries, e.g. due to differences in the intensity of status race phenomena, or differences in the degree to which status is associated with material possessions, then this may reflect in the composition of the basket. An additional advantage of the proposed measure is that cross-country differences in the generosity of benefits in kind could be more accurately reflected. If, for example, the statutory health system of country A covers the cost of dental treatment while the health system of country B does not, then the insurance value of an equivalent treatment would be part of the basket of necessities in country B but not in country A. Other things equal, the poverty line of country B would have to be higher by that amount. Unfortunately, this requires a number of arbitrary choices. Especially in an area like health care, there is no remotely objective way to decide where the medically necessary ends, and where the area of convenience begins. Even so, the BSA-CMD measure would still be improvement over conventional relative and absolute indicators, which do not account for differences in benefits in kind at all. However, whether the combined CMD-BSA measure is really suitable for international comparisons can only be seen once it is available for a number of countries. It is also conceivable that poverty lines will differ widely across similar countries, and for no visible reason.
Admittedly, much of what has been elaborated here depends on the existence of a minimum common denominator in popular views of what constitutes necessities, with only random deviations. There is no guarantee that future surveys will repeat this result. This potential fragility of the minimum common denominator makes the proposed indicator unsuitable for direct use in the political process. If it were used in a formula to set, for example, benefits levels, then this would surely have repercussions on the CMD survey results themselves. There may be a loose consensus on what constitutes a minimum decent living standard, but there is definitely no consensus on the appropriate level of benefits. The latter is a hugely controversial topic, where views are not so much shaped by their perceptions of what needs are, but rather by their perception of how deserving benefit recipients are (Horton and Gregory Reference Horton and Gregory2009). However, the sole purpose of the CMD survey described here would be to identify what the majority views as necessities. Ideally, this should be completely independent of whether a respondent views benefit recipients as unlucky persons or as welfare scroungers, or whatever other considerations may influence their views on the appropriateness of benefit levels. The proposed indicator's place would be in research, not politics.
Poverty is and remains a highly abstract concept, and any definition will suffer from ambiguities and inaccuracies. The one proposed here is no exception. To name just a few: Not all households have the same needs. People with a health condition that leads to high medical expenses, for example, may end up with a much lower living standard than observable variables reveal. Household surveys do not include data on the homeless or on people who live in shelters. Ironically, the people who are most obviously poor go unnoticed by poverty measures, including the one proposed here. No information is provided about the effort people have to make in order to remain above the poverty line. Some people may be able to cross the poverty line only through working very long hours or holding more than one job. Even if there is a very solid consensus on what constitutes necessities, this would still not be the same as a consensus on what constitutes poverty. There would almost certainly be households who lack the means to afford all the items they have identified as necessities, and who will nevertheless not consider themselves poor. There will also be households who can comfortably afford all the items they have identified as necessities, and who will still consider themselves poor.
Conclusion
Social norms and expectations become more demanding as societies grow wealthier, and social participation can become more costly. Budget Standard Approach measures have largely been discarded in the developed world, partly because they do not cater for this contextuality of poverty. Instead, relative poverty standards, which define the poverty line as a fixed fraction of mean or median incomes, have become widely accepted in the industrialised world. These indicators respond strongly to redistributive policy measures, but not to overall growth and employment creation. Yet since social policy choices usually imply trade-offs and opportunity costs, such conclusions are to be handled with caution. There are reasons to doubt the notion that a poverty standard is automatically anchored in social context only because it is tagged to median incomes. SWB research confirms that individuals do evaluate their material situation to some extent in relative terms, but it seems unlikely that this process of reference group formation follows a generalisable, identifiable pattern. To the very least, we have no reason to assume that national median income earners should occupy an especially prominent space in this process, that is, that they should be the group which sets social standards for the rest of society. At the same time, relative poverty indicators do not capture developments in product markets which affect the relative situation of the poor. Price increases which hurt the poor disproportionally, say increases in the price of staple food, housing, energy or transport, are not reflected in poverty indicators. Policies which make such increases less likely are not identified as poverty-reducing measures. Further, the emergence of no-frills versions of luxury goods is a development which can potentially make everyday life experiences more similar across income strata. Conventional absolute poverty indicators do not solve these problems either. Being tagged to overall inflation rates, they cannot identify any changes in the price or product market structure with particular relevance to the poor. They lack a mechanism of adjustment to changes in social norms and expectations.
A combination of a Budget Standard Approach with a Consensual Material Deprivation indicator could go a long way towards meeting these challenges. The poverty line would be equal to the cost of all items on a list of essential goods and services. The items would be obtained through a large-scale survey (the CMS-element) similar to the Poverty and Social Exclusion survey, to ensure a degree of social relevance. The survey would yield a number of broad product categories. In identifying specific products for each product category, the list would then be streamlined (the BSA-element). In this way, the inability to purchase a particular item could be separated from unwillingness to do so, and structural changes in the relevant product markets could be incorporated.
Like relative poverty indicators, the CMS-BSA poverty line would rise over time. But under many circumstances it could deviate substantially from the development of median incomes. One example would be a country where all real incomes remain constant, but through increased cultural integration, exposure to the lifestyles of wealthier countries increases. If this exposure has an impact on domestic social norms, then the list would become more encompassing, and poverty would rise. On the other hand, if all incomes grow fast and social norms only adjust with a substantial time lag, then poverty could fall even if the income distribution widens. Median incomes would grow faster than low incomes, but low incomes would still grow faster than the poverty line. Increased inequality would not have an impact per se, but only if it affects perceptions of what are necessities. If the additional income growth enjoyed by median income earners vis-à-vis low income earners is channelled into the consumption of goods which have little impact on social norms, then poverty would not necessarily rise. On the other hand, if income inequality reduces slightly, but consumption patterns become more rivalling and positional, then poverty could rise. In the meantime, structural changes in product markets could be reflected through the BSA-element of the indicator. Items would regularly be replaced with more suitable substitutes, and market prices frequently updated. This indicator would still have a number of pitfalls, but it could at least broadly resonate with what most people at a particular time and place associate with poverty, and thus provide a more realistic account of how poverty evolves over time, who is affected, and which factors are effective in tackling it.