
I. INTRODUCTION
Organic–inorganic halide perovskites adopt a typical ABX3 structure where the “A” cations reside at the eight corners of a cubic unit while the “B” cations are located at the center of the octahedral [BX6]4− structure. In the most common organic–inorganic halide perovskites, the “A” position represents an organic or metal cation, e.g., CH3NH3+ (methylammonium MA), HC(NH2)2+ (formamidinium, FA), Cs+ and/or Rb+, “B” represents a divalent metal cation (typically Pb, Sn, and Ge), and “X” represents a halide (I, Br, and/or Cl). Among the advantages of these materials are (i) the abundancy of chemical precursors and (ii) the preparation by easy experimental setups.Reference Schmidt, Larsen-Olsen, Carle, Angmo and Krebs1,Reference Dimesso, Dimamay, Hamburger and Jaegermann2 The modulation of hybrid perovskite properties, by changing the protonated amine as cation, is a very appealing way of performing such tuning with the aim, for example, of extending and/or changing the absorption edge and improving material stability.Reference Ferrara, Patrini, Pisanu, Quadrelli, Milanese, Tealdia and Malavasi3–Reference Patrini, Quadrelli, Milanese and Malavasi9 In particular, lead iodide systems based on formamidinium cation have attracted significant interest because of higher symmetry in the crystalline structure compared with the MAPbI3 phase (which is tetragonal at room temperature) and have an improved thermal stability.Reference Ferrara, Patrini, Pisanu, Quadrelli, Milanese, Tealdia and Malavasi3–Reference Jacobsson, Correa-Baena, Pazoki, Saliba, Schenk, Graetzel and Hagfeldt6 Despite these remarkable properties, the toxicity issue of lead (Pb)Reference Babayigit, Duy Thanh, Ethirajan, Manca, Muller, Boyen and Conings10–12 has slowed down further developments; indeed PbI2 is the product of the decomposition of perovskites and has a larger solubility than the conventionally toxic Cd2+ in CdTe,Reference Patnaik13,Reference Wang, Liang, Wang and Cui14 which indicates a higher toxic level of Pb2+ than Cd2+ in their corresponding solar cells materials. Recently tin (Sn) has been reported to be a suitable alternative in hybrid perovskites mainly due to the similar ionic radii (6-fold coordination, high spin, Pb2+: 1.19 ÅReference Shannon15 and Sn2+: 1.18 ÅReference Harrison and Blackie16). Besides, Sn-based perovskites have a narrower optical band gap and a higher charge mobility of ∼102–103 cm2/(V s) [that of Pb-based perovskites is ∼10–102 cm2/(V s)].Reference Stoumpos, Malliakas and Kanatzidis17 Despite these promising properties, Sn2+ is relatively unstable and easily oxidized to Sn4+ leading to a self-doping process. In addition, upon exposure to ambient conditions, these perovskites tend to degrade into harmful compounds carrying heavy metals, which may readily leach into the environment as a result of the structural failure of a photovoltaic module.Reference Yang, Siempelkamp, Liu and Kelly18–Reference Conings, Drijkoningen, Gauquelin, Babayigit, D’Haen, D’Olieslaeger, Ethirajan, Verbeeck, Manca, Mosconi, De Angelis and Boyen20 B-site or X-site ion replacement with respect to the formula ABX3 is highly efficient in terms of thermal and chemical stability as well as in terms of the absorption energy interval that can be modulated. For instance, Br for I substitution in most of the hybrid perovskites leads to an overall variation of the band gap (E g) close to 0.7 eV.Reference Jacobsson, Correa-Baena, Pazoki, Saliba, Schenk, Graetzel and Hagfeldt6 However, most of the Sn-based organic–inorganic perovskite investigations center on the methylammonium cation and iodide anion whereas less extensive investigations are available regarding other protonated amines and/or halogens in Sn-based systems.
During our research activity on this subject, we found out that the addition of earth-alkaline ions in methylammonium tin iodide perovskitesReference Dimesso, Das, Mayer and Jaegermann21 led to an improvement of the thermal stability of the Sn-containing perovskites at 85 °C under nitrogen as well as to an increase of the photoluminescence (PL) intensity. Particularly, the addition of Sr-ions improved the emission PL properties of the hybrid perovskites and led to a lower number of secondary phases. Moreover the addition of Sr-ions in Pb-containing systems markedly improved the properties of solar cell devicesReference Shai, Zuo, Sun, Liao, Huang, Yao, Li, Liu, Shen, Yang and Wang22,Reference Lau, Zhang, Deng, Zheng, Bing, Ma, Kim, Hu, Green, Huang and Ho-Baillie23 : the formation of Pb° was successfully suppressed, the conduction band edge energy level was shifted up, the exciton binding energy and trap density states of the perovskites were increased,Reference Shai, Zuo, Sun, Liao, Huang, Yao, Li, Liu, Shen, Yang and Wang22 and the efficiency of the devices was enhanced.Reference Shai, Zuo, Sun, Liao, Huang, Yao, Li, Liu, Shen, Yang and Wang22,Reference Lau, Zhang, Deng, Zheng, Bing, Ma, Kim, Hu, Green, Huang and Ho-Baillie23 The obtained results encouraged us to investigate the formamidinium analogue Sn-perovskites and to further extend our investigation to Br-containing perovskites. The main purpose of this work is to investigate the structural, microstructural, optical, and PL properties of strontium-containing Sn-based hybrid perovskites systems (FASnX3, CH(NH2)2Sn1−ySryX3 (X = I, Br, 0.0 ≤ y ≤ 0.1)) in relation to the annealing conditions. Results on the thermal stability of the systems in nitrogen, by annealing the systems at different temperatures on the basis of the data of the thermal analysis, are also discussed.
II. EXPERIMENTAL
Formamidinium tin halides containing Sr ions [CH(NH2)2Sn1−ySryX3, 0.0 ≤ y ≤ 0.1] were prepared by a precipitation process in aqueous solutions obtained by commercially available materials. In particular, Sn(CH3COO)2 [tin(II) acetate, Alfa Aesar (Thermo Fisher GmbH, Dreiech, Germany)], HI (47 wt%, hydroiodic acid stabilized with 1.5 wt% hypophosphorous acid, Alfa Aesar), HBr (48 wt%, hydrobromic acid, Alfa Aesar), HN = CHNH2·CH3COOH (C3H8N2O2, formamidine acetate, Sigma-Aldrich, Munich, Germany), SrCO3 (strontium carbonate, Sigma-Aldrich) were used as delivered. The materials were prepared adding a corresponding amount of C3H8N2O2 in aqueous solutions containing Sn2+ and Sr2+ ions (FA: (Sn + Sr) = 1: 1 molar ratio) in air. To avoid the oxidation of Sn(II) into Sn(IV), 3.5 mL H3PO2 solution (hypophosphorous acid, 50 wt%, Fisher Scientific, Loughborough, UK) was added into the starting solution (9.0 mL) during the heating step up to 100–110 °C.Reference Dimesso, Das, Mayer and Jaegermann21,Reference Scaife, Weller and Fisher24,Reference Foster, Nahas, Lineken and Fernelius25 After cooling down the solution to room temperature, the precipitated black powders were separated from the mother liquor and rinsed with distilled water and 2-propanol, and then the samples were stored in a glovebox under an Ar atmosphere (≤5 ppm H2O).
Structural analysis was performed on the thoroughly ground samples, by X-ray powder diffraction (XRD) using a D8 Bruker powder diffractometer (Cu Kα1 + Cu Kα2 radiation; Bruker, Karlsruhe, Germany) with a theta/2 theta Bragg–Bentano configuration. The diffractometer is equipped with an energy dispersion detector Si(Li) to minimize the fluorescence effects. A scanning electron microscope (SEM) Philips XL 30 FEG (FEI, Eindhoven, The Netherlands) was used to investigate the morphology of the samples. The thermal behavior of the samples was determined by differential thermal analysis (DTA) and thermogravimetry (TG): measurements were carried out from 30 to 600 °C, at a heating rate of 10 K/min in flowing nitrogen using a METTLER STARe SW 10.00 thermoanalyzer (Mettler Toledo GmbH, Schwerzenbach, Switzerland). Optical diffuse-reflectance measurements were performed using a PerkinElmer UV/VIS/NIR double-monochromator spectrometer (PerkinElmer Instruments LLC, Shelton, Connecticut) operated from 200 to 2500 nm. BaSO4 was used as a nonabsorbing reflectance reference. The generated reflectance-versus-wavelength data were used to estimate the band gap of the material by converting reflectance to absorbance data according to the Kubelka–Munk equation: α/S = (1 −=R)2/2R, where R is the reflectance and α and S are the absorption and scattering coefficients, respectively.Reference Dimesso, Dimamay, Hamburger and Jaegermann2 Steady state emission and excitation PL measurements were performed by a VARIAN Cary Ellipse fluorescence spectrophotometer (Varian Optical Spectroscopy Instruments, Mulgrave, Australia) equipped with a Xe arc as the emission source. All measurements were performed at room temperature.
III. RESULT AND DISCUSSION
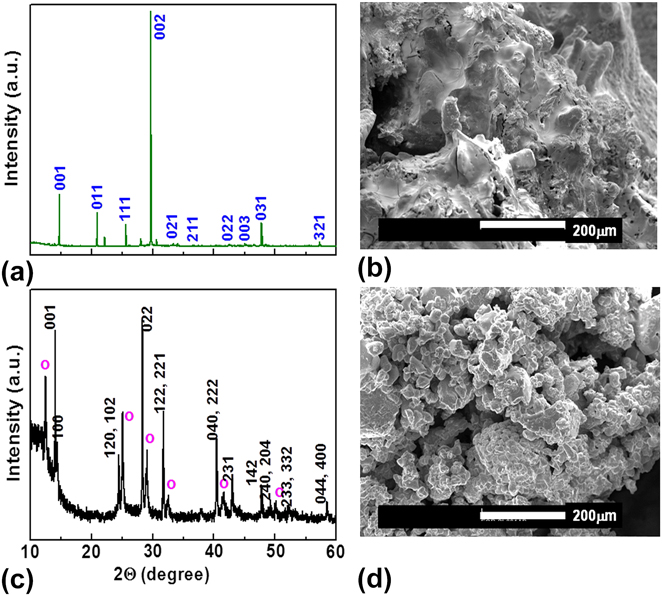
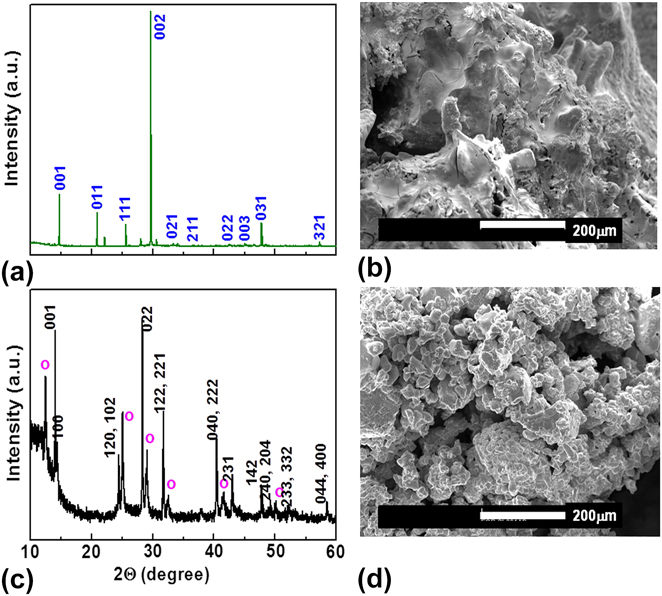
Typical XRD patterns of the as prepared FASn1−ySryX3 systems (for example y = 0.0) are shown in Fig. 1(a) for X = Br and for X = I in Fig. 1(c). Similarly to the X-ray patterns of the methylammonium containing analogue, the XRD pattern of the Br-containing perovskite revealed at room temperature the presence of the cubic FASnBr3 (space group  $Pm\bar{3}m$) perovskiteReference Ferrara, Patrini, Pisanu, Quadrelli, Milanese, Tealdia and Malavasi3 whereas the I-containing system showed the formation of orthorhombic FASnI3 (space group Amm2) as major crystalline phases. Additional crystalline reflections indicated the presence of the monoclinic SnI2 (“o” in Fig. 1(c), X = I) and orthorhombic SnBr2 (“*” in Fig. S1, X = Br)Reference Eckold, Hügel, Dinnebier and Niewa26 as the secondary phases, respectively. Our data confirm the results obtained by FerraraReference Ferrara, Patrini, Pisanu, Quadrelli, Milanese, Tealdia and Malavasi3 indicating direct crystallization of tin bromide-based perovskites with a cubic crystalline structure. In Fig. 1(a), the Miller indices for the FASnBr3 crystalline phase are reported. To the best of our knowledge and after an intensive literature research, we have not found any information on indexing the FASnBr3 crystalline phase. Recently PerumalReference Perumal, Shendre, Li, Tay, Sharma, Chen, Wei, Liu, Gao, Buenconsejo, Tiam Tan, Gan, Xiong, Sum and Demir27 reported the XRD patterns of the Pb-containing analogue which can be indexed to the cubic phase with the space group
 $Pm\bar{3}m$ as well. Taking into account the very similar ionic radii between Pb2+ and Sn2+ ions, the indices can be considered accurate. The morphological analysis, performed by scanning electron microscopy revealed the formation of irregularly shaped crystallites in the I-containing perovskite [Fig. 1(d)] and crystallites embedded in a liquidlike matrix for X = Br [as in Fig. 1(b)] respectively.
Typical XRD patterns and SEM images of the as-prepared HC(NH2)2Sn1−ySryX3 systems (y = 0.0) for (a) and (b) X = Br, (c) and (d) X = I, respectively. “o” indicates the monoclinic SnI2 crystalline phase.
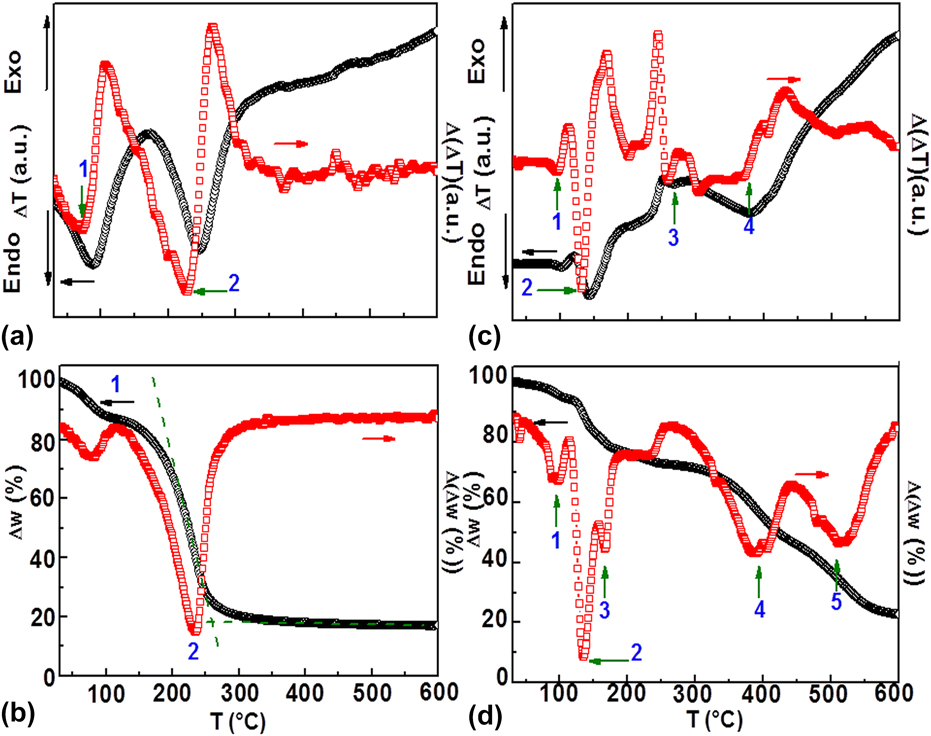
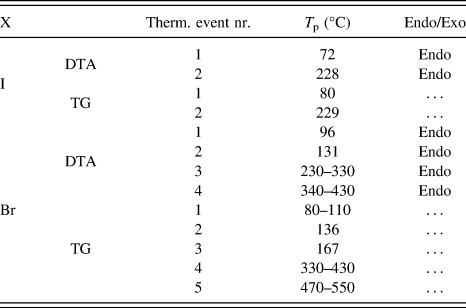
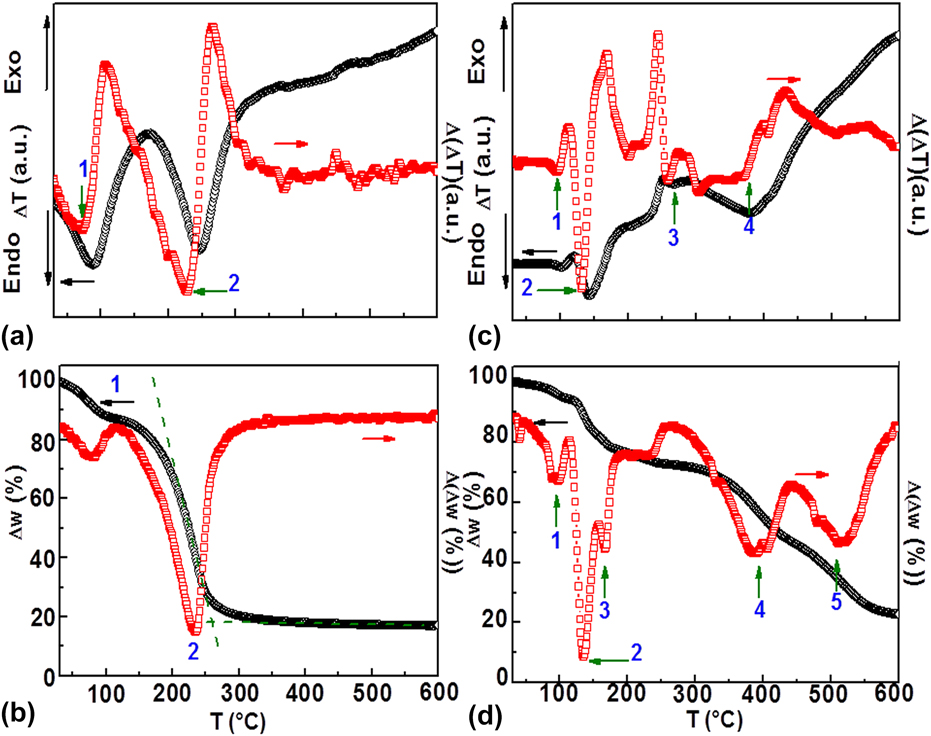
The thermal properties of the as-prepared FASn1−ySryX3 systems were investigated by dynamic DTA and dynamic TG in the range 30 to 600 °C (at the heating rate of 10 K/min) under flowing nitrogen. DTA and TG curves (and their derivatives for a better resolution of the thermal profile) for y = 0.0 are shown in Figs. 2(a) and 2(b) for X = I and in Figs. 2(c) and 2(d) for X = Br. The peak temperatures of the thermal events, from the derivative curves, are summarized in Table I. For X = I, the first derivative curves of the DTA profiles of the as-prepared samples [Fig. 2(a)] showed major endothermic events (labeled “1” and “2”, Table I) peaking at T = 72 °C and T = 228 °C respectively. The thermal peak “1” may be related to the evaporation of the rinse solvents and/or adsorbed species on the crystallite surface as confirmed by the thermogravimetric profile [peak “1” in Fig. 2(b)] and the thermal event “2” was attributed to the decomposition processes of the FASnI3 phase as confirmed by the weight losses recorded in the thermogravimetric profile [peak “2” in Fig. 2(b) and Table I]. Unlike the decomposition of MASnI3 (s) which can lead to the formation of methylamine and SnI2Reference Haynes, Lide, Bruno and Haynes28,Reference Mitzi29 the decomposition of formamidine could give rise to the formation of ammoniac and hydrogen cyanide according to the reaction
 $${\rm{HC}}\left( {{\rm{N}}{{\rm{H}}_2}} \right){\rm{NH}} \to {\rm{N}}{{\rm{H}}_3} + {\rm{HCN}}\quad ,$$
as reported in the literature.Reference Andres, Krechl, Carda and Silla30,Reference Almatarneh, Flinn and Poirier31 Indeed “ab initio” studies using Gaussian-n theories predict the reaction to be exergonic both in the gas phase and in solution, where formation of the separated species (HCN + NH3) is favored over formation of the complex (HCN–NH3) due to the increase of entropy for the formation of separated products.Reference Almatarneh, Flinn and Poirier31 Accordingly, the overall decomposition of FASnI3 can occur as follows
 $${\rm{HC}}\left( {{\rm{N}}{{\rm{H}}_2}} \right){\rm{N}}{{\rm{H}}_2}{\rm{Sn}}{{\rm{I}}_3}\left( {\rm{s}} \right) \to \,\,{\rm{HCN}}\left( {\rm{g}} \right) + {\rm{N}}{{\rm{H}}_3}\left( {\rm{g}} \right) + {\rm{HI}}\left( {\rm{g}} \right) + {\rm{Sn}}{{\rm{I}}_2}\left( {\rm{s}} \right)\quad ,$$
followed by the melt reaction
 $${\rm{Sn}}{{\rm{I}}_2}\left( {\rm{s}} \right) \to {\rm{Sn}}{{\rm{I}}_2}\left( {{\rm{liq}}} \right)\quad .$$
Typical dynamic DTA and TG profiles (with the corresponding first derivative curves, 10 K/min) of the as-prepared FASn1−ySryX3 systems performed under flowing nitrogen (in this case y = 0.0) for (a) and (b) X = I and (c) and (d) X = Br, respectively. The peak temperatures are reported in Table I.
Peak temperatures of the thermal events of the FASnX3 systems (y = 0.0) obtained from the derivative curves in Figs. 2(a) and 2(b) for X = I and in Figs. 2(c) and 2(d) for X = Br respectively.

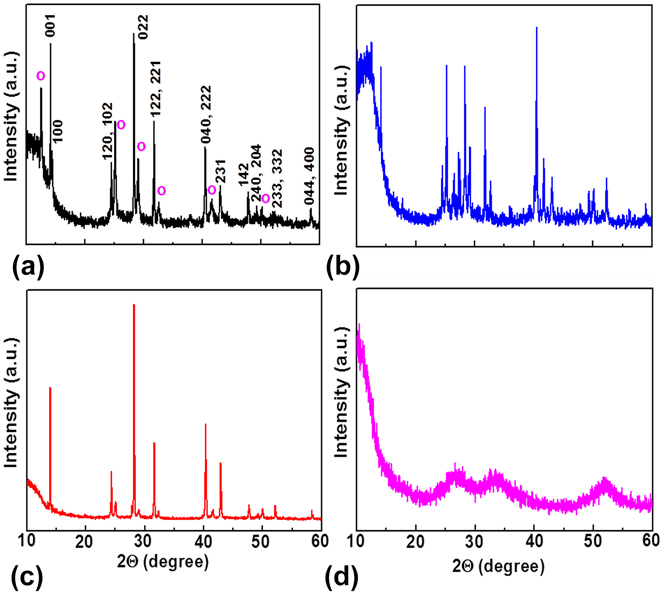
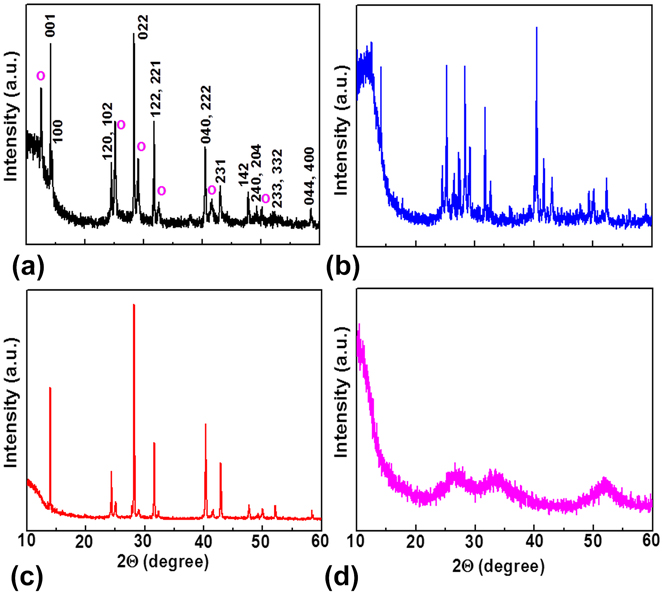
The processes (2) and (3) can be confirmed by the broad DTA event [Fig. 2(a)] as well as by the absence of a “plateau” in the TG curve [Fig. 2(b)]. At higher temperatures, the decomposition of all organic species takes place and the formation of a residual Sn-containing solid phase [∼21.0 wt% in Fig. 2(b)]—the formation of Sn(II)–O and Sn(IV)–O cannot be ruled out—was observed (see Supplementary Material). To better understand the influence of the thermal treatments on the structural and microstructural properties of the FASnI3 system, annealing under nitrogen atmosphere was carried out for t = 8 h at temperature ranging from 115 to 230 °C. The XRD patterns of the samples annealed at T = 115 °C [Fig. 3(b)] and T = 150 °C [Fig. 3(c)] indicate that the orthorhombic FASnI3 phase (space group Amm2) [as shown in Fig. 3(a) for comparison]Reference Stoumpos, Malliakas and Kanatzidis17 exists over this temperature range.Reference Koh, Krishnamoorthy, Yantara, Shi, Leong, Boix, Grimsdale, Mhaisalkar and Mathews32,Reference Milot, Eperon, Green, Snaith, Johnston and Herz33 Moreover, crystalline reflections attributed to monocline SnI2 [labeled with “o” in Fig. 3(a)] and further crystalline reflections of unidentified phase(s) [Fig. 3(c)] were detected. After annealing at T = 230 °C the XRD pattern showed the presence of broad halos [Fig. 3(d)], which indicate the formation of noncrystalline phases possibly due to a degradation process of the FASnI3 crystallites. This was confirmed by the morphological analysis [as shown in Figs. S3(a), S3(b), and S3(c) respectively], which revealed the formation of irregularly shaped crystallites with a flat surface in the as-prepared samples [Fig. S3(a)]. After annealing at T = 150 °C, the formation of a “white” layer on the perovskite crystallites [Fig. S3(b)] which could indicate the growth of an “intermediate” phase before a process of degradation of the crystallites takes place [Fig. S3(c)]. A similar amorphization process of Sn-containing perovskite (under argon) has been recently reported by LüReference Lü, Wang, Stoumpos, Hu, Guo, Chen, Yang, Smith, Yang, Zhao, Xu, Kanatzidis and Jia34 by compressing the prepared powders up to 31.2 GPa using a diamond anvil at room temperature (no information on investigations as a function of the temperature is reported in the published work). The authors observed a transformation from crystalline into amorphous state and a return to the crystalline state after decompression to ambient pressure. In our case, the formation of the noncrystalline phase is related to weight losses, which clearly indicates an irreversible decomposition process.
Typical XRD patterns of the FASnI3 system (a) as-prepared and after thermal treatment for t = 8 h under nitrogen at (b) T = 115 °C, (c) T = 150 °C and (d) T = 230 °C. “o” indicates the monoclinic SnI2 phase.
Unlike the iodine-containing systems, the thermal profiles of the For-Sn–Br perovskite [Fig. 2(c)] show many processes taking place simultaneously as confirmed by the TG analysis [Fig. 2(d)]; consequently the association of a thermal peak to a process is a quite hard task, although partially supported by data in the literature. For better clarity, the thermal profiles have been split in two major temperature ranges: RT(230 °C) and T > 230 °C. The thermal peak at T = 96 °C [”1″ in Fig. 2(c), Table I] can be related to the evaporation of species (rinse solvents, Br-containing compounds) bonded on the surfaces of the crystallites as confirmed by the thermogravimetric profile [Fig. 2(d)]. On the other hand, the major thermal event “2” (T = 131 °C) can be attributed to the main decomposition process of the FA-Sn–Br phase with the formation of formamidinium bromide (FABr), SnBr2 as solid phases and to their melting/decomposition processReference Haynes, Lide, Bruno and Haynes28,35 respectively, according to the following reactions
 $${\rm{CH}}{\left( {{\rm{N}}{{\rm{H}}_2}} \right)_2}{\rm{SnB}}{{\rm{r}}_3}\left( {\rm{s}} \right) \to {\rm{CH}}{\left( {{\rm{N}}{{\rm{H}}_2}} \right)_2}{\rm{Br}}\left( {\rm{s}} \right) + {\rm{SnB}}{{\rm{r}}_2}\left( {\rm{s}} \right)\quad ,$$
 $${\rm{CH}}{\left( {{\rm{N}}{{\rm{H}}_2}} \right)_2}{\rm{Br}}\left( {\rm{s}} \right) \to {\rm{CH}}{\left( {{\rm{N}}{{\rm{H}}_2}} \right)_2}{\rm{Br}}\left( {{\rm{liq}}} \right)\quad ,$$
 $${\rm{SnB}}{{\rm{r}}_2}\left( {\rm{s}} \right) \to {\rm{SnB}}{{\rm{r}}_2}\left( {{\rm{liq}}} \right) \to \,\,{\rm{SnB}}{{\rm{r}}_2}\left( {{\rm{vap}}} \right) \to {\rm{Sn}}\left( {{\rm{liq}}} \right) + {\rm{B}}{{\rm{r}}_2}\left( {{\rm{vap}}} \right)\quad .$$
At higher temperatures (T > 230 °C), endothermic events peaking in ranges T = 240–330 °C and T = 340–430 °C [labeled “3” and “4” respectively in Fig. 2(c) and Table I] were detected. These events can be attributed to further decomposition processes with the formation of volatile species as confirmed by the weight losses recorded by the thermogravimetric measurements [peaks “4” and “5” in Fig. 2(d) and Table I]. In the gas phase, SnBr2 is nonlinear with a Br–Sn–Br angle of 95° and Sn–Br bond length of 255 pm.Reference Wardell and Bruce King36 Evidence of dimerization in the gaseous phase was recently reportedReference Hilpert, Miller and Ramondo37 during the investigation on the composition and thermochemistry of the vapor of metal chlorides and their quasi-binary systems. The processes from (4) to (6) can be confirmed by the broad DTA event [Fig. 2(c)] as well as by the absence of a “plateau” in the TG curve [Fig. 2(d)] in the investigated range of temperature. Similarly to the iodine-containing perovskites, a residual weight of around 22.0% has been calculated, which is very close to the theoretical value of 21.8 wt% (Fig. S2 in Supplementary Material).
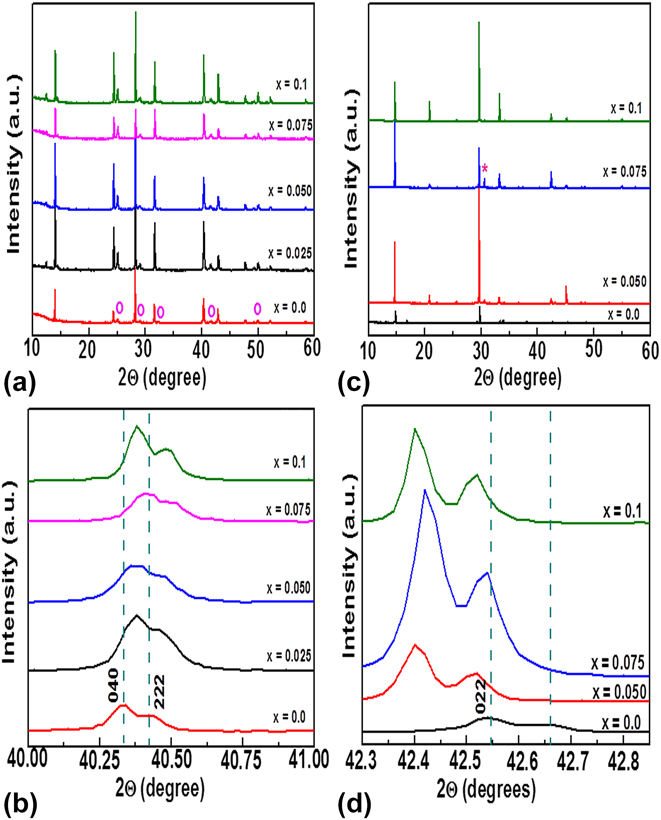
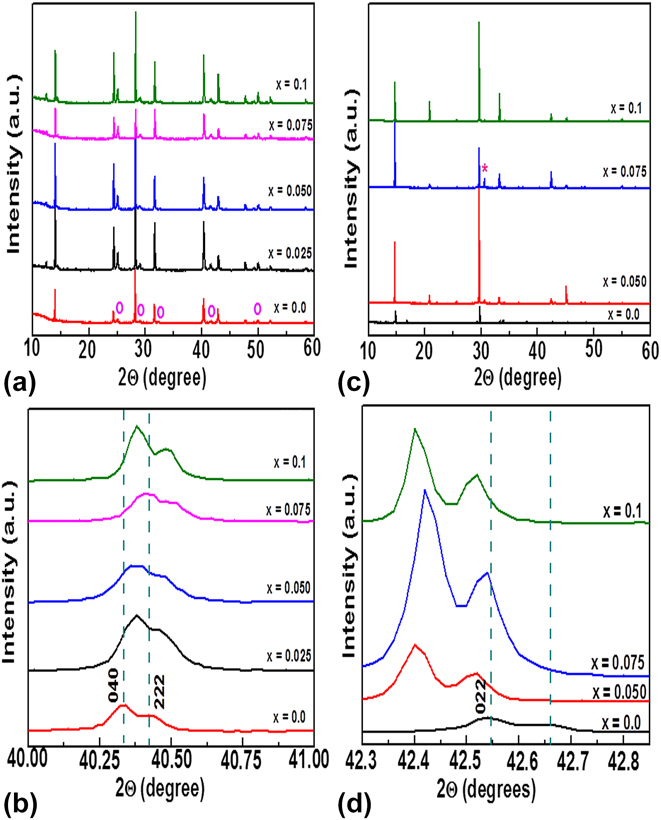
The results of the thermal analysis revealed that the Br-containing perovskite is stable in a narrower range of temperature compared to the iodine-containing analogue. On the basis of these data, to better understand the influence of the thermal treatment on the structural and microstructural properties of the FASn1−ySryX3 systems, thermal treatments were carried out at T = 115 °C for t = 8 h under nitrogen. The XRD patterns of the FASn1−ySryX3 systems after annealing are shown, for X = I, in Fig. 4(a) [and its enlargement Fig. 4(b)] and for X = Br in Fig. 4(c) [and its enlargement in Fig. 4(d)]. For X = I, the XRD patterns showed diffraction peaks, which can be indexed to the planes of the orthorhombic FASnI3 phase (space group Amm2)Reference Stoumpos, Malliakas and Kanatzidis17,Reference Koh, Krishnamoorthy, Yantara, Shi, Leong, Boix, Grimsdale, Mhaisalkar and Mathews32,Reference Milot, Eperon, Green, Snaith, Johnston and Herz33 and revealed the presence of crystalline reflections [“o” in Fig. 4(a)] of the monoclinic SnI2 (pattern 01-070-1492 in ICSD database). In the Pb-containing analogue, FA cations possess higher temperature stabilityReference Dimesso, Kim and Jaegermann38 which could be explained by a more rigid perovskite structure from the enhanced hydrogen bonding between FA cations and the anions of the inorganic matrix.Reference Amat, Mosconi, Ronca, Quarti, Umari, Nazeeruddin, Graetzel and De Angelis39 Furthermore, this halide does not undergo any phase transition up to a temperature of 150 °C, indicating that it could be a much more stable alternative than the commonly explored methylammonium-containing perovskites. Second, the enlarged patterns [Fig. 4(b)] revealed a shift of the positions of (040) and (222) crystalline reflections towards higher diffraction angles in the Sr-containing systems. The shift increases at increasing Sr-content till y = 0.075 and can be explained by the incorporation of the Sr2+ ions into the perovskite structure and can be related to variations in lattice parameters and unit cell volume of the FASnI3 phase which can be understood on the basis of the different properties (polarity, coordination number, etc.) between Sn2+- and Sr2+-ions. On the other hand, for X = Br the XRD patterns revealed that the materials retained the cubic crystalline structure [labeled “x” in Fig. 4(c)] and the formation of tetragonal SrBr2 was detected [”*” in Fig. 4(c), pattern: 01-076-2193, ICSD data base]. In these systems, the incorporation of Sr ions was confirmed by the shift of the crystalline reflections as shown in Fig. 4(d). Unlike the iodine-containing analogue, which showed a shift towards higher 2-theta values, a shift towards lower 2-theta reflection angles was observed. We can only argue that this shift can be due to the nature of the incorporated of Sr ions (higher polarity, higher coordination number), to the nature of the Br-ions which give origin to binds with more ionic character and of the FA-cation with the intramolecular 1,3-sigmatropic hydrogen rearrangement and intermolecular hydrogen transfers [Reference Almatarneh, Flinn and Poirier31 and references in there]. The formation of charges on the formamidinium molecules could result in electrostatic repulsions between the positive charges in FA ions and the Sr ions. These electrostatic repulsions may affect the Sr–Br and Sn–Br bonds (with more ionic character than the Sn–I bonds in the iodine-containing analogue) of the [MBr6] octahedra and consequently increase the unit cell volume leading to the observed shift. The influence of the thermal treatment on the microstructural properties of the Br-containing systems was confirmed by the SEM analysis. The SEM images (shown in Fig. S4) revealed a change of the morphology of the crystallites from polyhedral shape [Fig. S4(a)] to elongated shaped [Fig. S4(b) for y = 0.0 and Fig. S4(c) for y = 0.075 respectively].
XRD patterns of the FASn1−ySryX3 systems (0.0 ≤ y ≤ 0.1) after annealing at T = 115 °C (t = 8 h) under nitrogen for (a) and (b) X = I and (c) and (d) X = Br, respectively. “o” and “*” indicate the monoclinic SnI2 and the tetragonal SrBr2 crystalline phases.
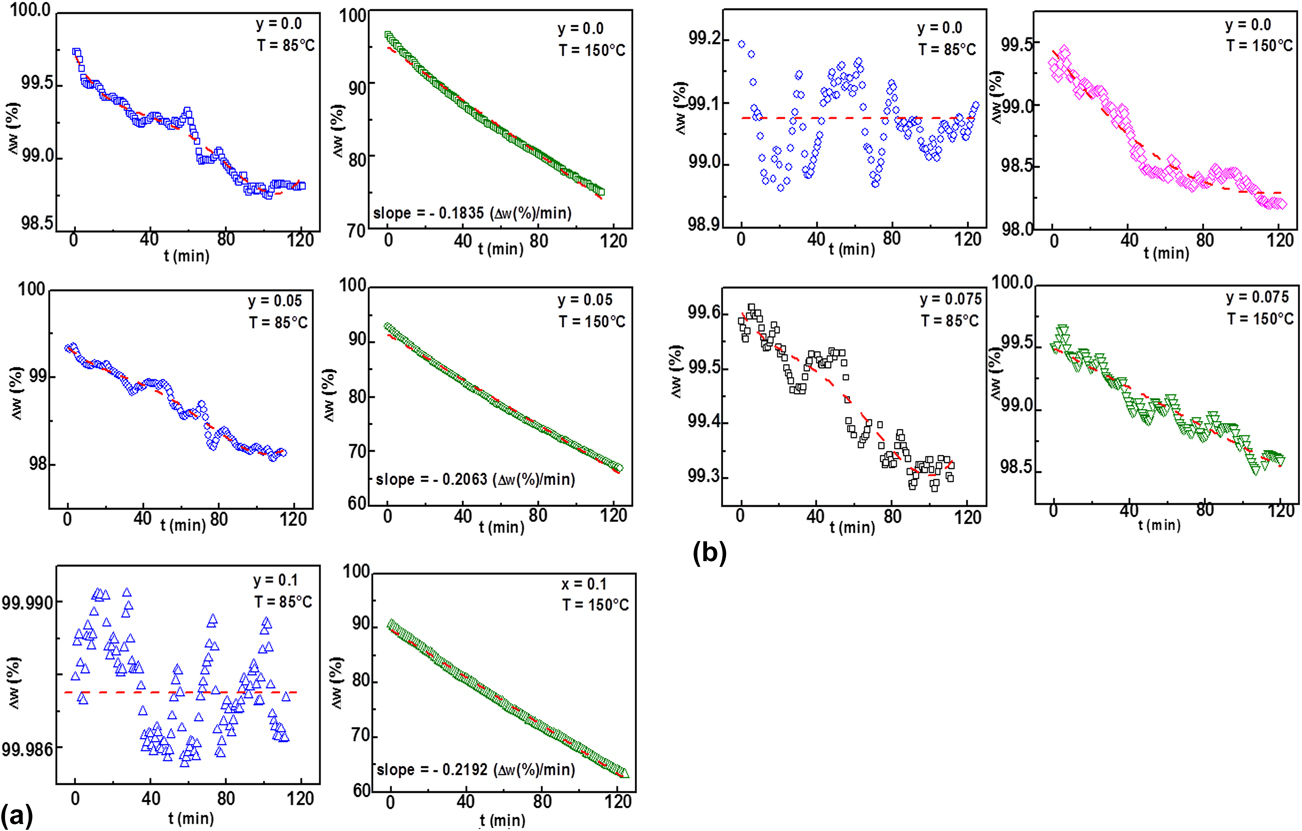
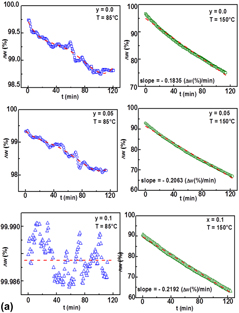
The thermal stability of the FA-Sn–Sr–X halides was investigated by static TG in nitrogen. The samples were heated up to T = 85 °C and to T = 150 °C respectively and weight losses were measured in a time range of t = 2 h. The weight losses of the FASn1−ySryX3 systems as a function of time at constant temperature in nitrogen are shown in Fig. 5(a) for X = I, y = 0.0, y = 0.05, and y = 0.1 and in Fig. 5(b) for X = Br, y = 0.0 and y = 0.075. The weight loss rates (wt%/min) were calculated by fitting the experimental data; the corresponding fit parameters are summarized in Table SI. At T = 85 °C, for X = I (y = 0.0) the data falls under a polynomial relationship of order 4 with asymptotic behavior until t ≈ 100 min; then no further loss was recorded and the estimated weight loss rate was −0.0268 wt%/min [in the linear approximation by neglecting the contribution of higher orders as in Fig. 5(a)]. By adding Sr ions, a decrease of the weight loss rate was observed; indeed, for y = 0.05 an estimated weight loss rate of −0.0197 wt%/min and for x = 0.1 a barely measurable weight loss were recorded (Table SI in the Supplementary Material). This behavior can be explained by the stronger polarization of the Sr–I bonds, which may bind iodine anions more tightly and consequently may reduce the formation of volatile iodine (-containing) species. The data confirmed the higher thermal stability of the formamidinium containing tin organic–inorganic perovskite compared to methylammonium tin iodide, which showed a linear dependence of the weight loss as a function of time in the same investigated range of time.Reference Dimesso, Fasel, Lakus-Wollny, Mayer and Jaegermann40 On the other hand, the static TG measurements performed in nitrogen at T = 150 °C revealed a linear dependence of the weight loss rate as a function of time (Table SI). The FASnI3 system showed a weight loss rate of −0.183 wt%/min and an increase of the weight loss rates was recorded (−0.2063 wt%/min for y = 0.05 and −0.2192 wt%/min for y = 0.1 respectively). A possible explanation is the lower stability of Sr–I ionic bonds at higher temperatures compared to the Sn–I covalent bonds into the [SnI6]4− octahedra which favors the decomposition of the perovskite as confirmed by the dynamic thermal profile.
Isothermal thermogravimetric profiles of the FASn1−ySryX3 systems recorded at T = 85 °C and T = 150 °C (t = 2 h under nitrogen) for (a) X = I (y = 0.0, y = 0.05, and y = 0.1) and (b) X = Br (y = 0.0, y = 0.075). The solid red lines are the fit of the data obtained by the program OriginPro 8. The corresponding fit parameters are reported in Table SI.
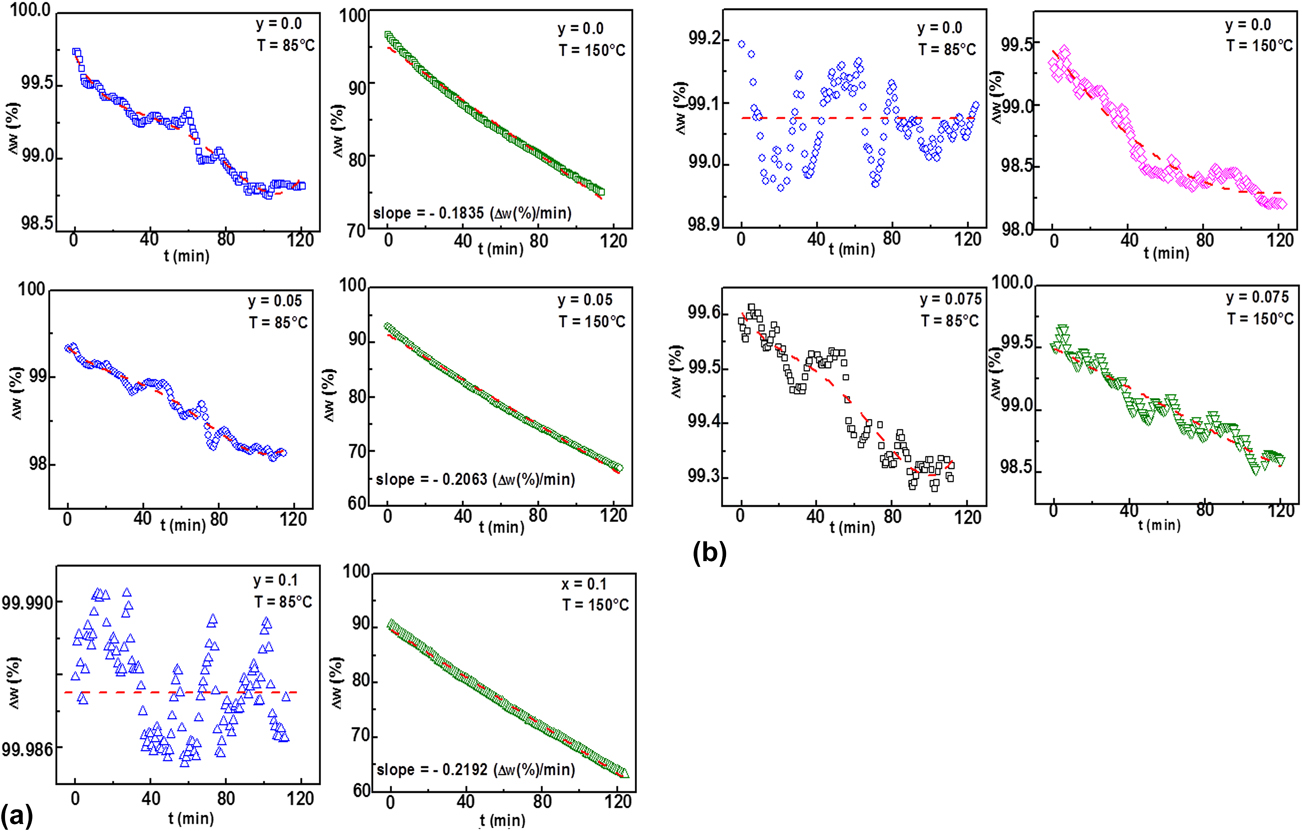
A different behavior was observed in the Br-containing analogue. At T = 85 °C, for y = 0.0, a barely detectable weight loss was observed followed by an exponential weight loss rate for y = 0.075 as a function time [−0.0053 wt%/min in the linear approximation by neglecting the contribution of higher orders as in Fig. 5(b)] till t ≈ 90 min in a very low weight range (∼0.3 wt%); no further loss were recorded. Indeed the obtained thermal data suggested higher thermal stability of the bromide-containing tin hybrid perovskites compared to the iodide-based ones. At higher temperature [T = 150 °C in Fig. 5(b)] for y = 0.0, the system showed a weight loss rate of −0.020 wt%/min, and the data were fitted to a polynomial curve in the order of 2, which indicates that the weight loss is slow but continuous (Table SI) whereas for y = 0.075 a constant decrease of the weight loss rates was recorded (−0.0079 wt%/min) in the entire range of the investigated time. These data are in good agreement with the dynamic thermic profiles, which show an endothermic event related to a weight loss process [Figs. 2(c) and 2(d) respectively], with the SEM analysis, which revealed a change of the morphology after annealing under nitrogen (Figs. S4(b) and S4(c) respectively) and would confirm the occurrence of process (4) that leads to the decomposition of the FA-Sn–Sr–Br system and the formation of volatile species possibly formamidinium bromide (m.p. 133–140 °C35).
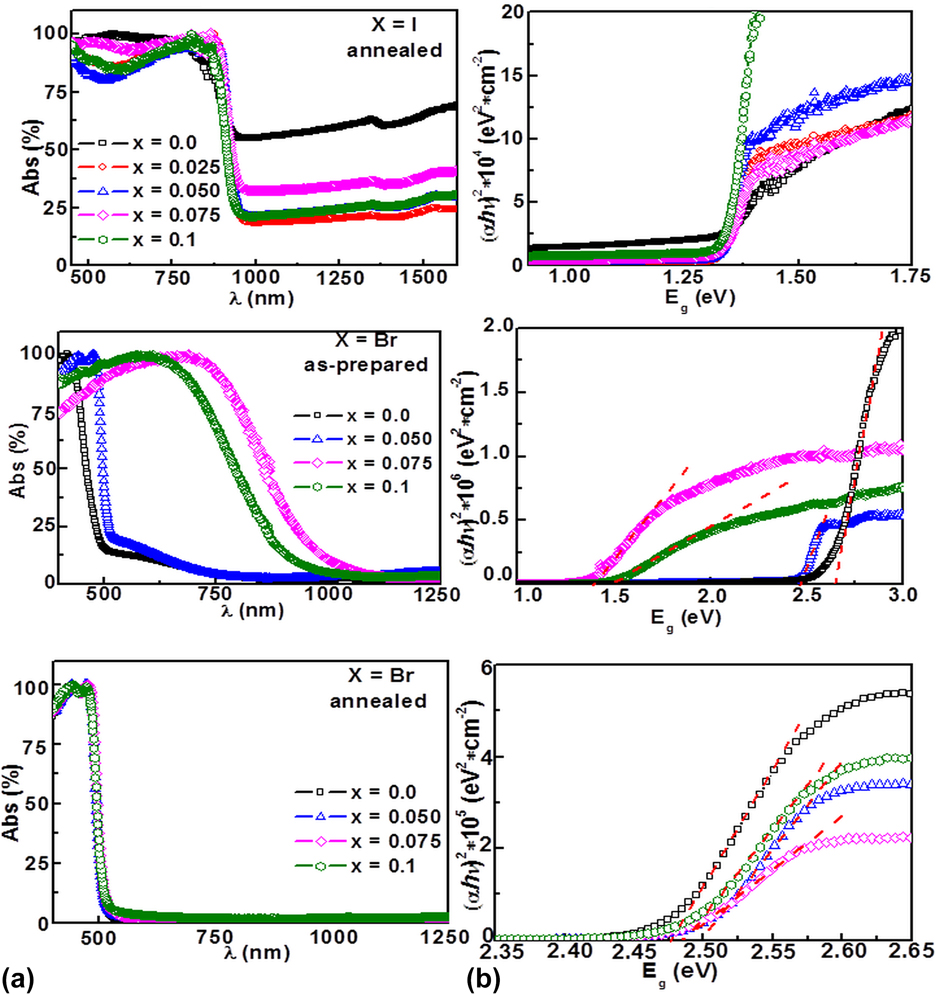
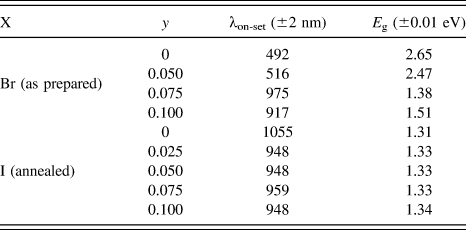
The influence of the annealing conditions on the optical properties of the FA–Sn–Sr–X systems are shown in Figs. 6(a) and 6(b) respectively. Assuming a bulk-like behavior, the absorption edges (λon-set (nm)) can be obtained by fitting the linear part of the absorbance spectrum.Reference Dimesso, Dimamay, Hamburger and Jaegermann2 The values of the absorption edges are reported in Table II. By observing the optical spectra in Fig. 6(a) and the data in Table II following points are to note. First, for X = I the annealing conditions do not affect the optical absorption of the perovskites as observed by comparing, as example, the optical profile of the FASnI3 system (y = 0.0) before (in Fig. S5) and after annealing [Fig. 6(a)]. Indeed the absorption spectra displayed a strong, abrupt absorption in infrared region which decreases from 1055 nm (y = 0.0) to 950–960 nm (as in Table II) at increasing the Sr-content. The sharp absorption would indicate a less important contribution of the secondary phases to the optical profile. Second, the addition of Sr-ions decreases dramatically the higher absorbance background in the optical profiles. Indeed the high absorbance background is a feature of the Sn-containing hybrid systemsReference Dimesso, Das, Mayer and Jaegermann21 which was explained, supposing strong scattering effects of the Sn2+-ions can act like scattering centers. The decrease of the absorbance background would confirm the replacement of the Sn-ions by Sr-ions into the [SnI6]2− octahedra. A different behavior was observed in the Br-containing perovskites. The as-prepared bromides showed an increase of the optical absorption edges from ∼492 nm (y = 0.0, Table II) to a maximum value of ∼975 nm for y = 0.075 [Fig. 6(a)]. The Sr-free material show a lower absorption edge than that observed in the Pb-analogue (550–560 nm),Reference Dimesso, Kim and Jaegermann38 nevertheless the sharp absorption edges would indicate a good quality of the prepared materials. On the other hand, after the thermal treatment the materials displayed absorption edge value in the range 520–530 nm independently of the initial Sr-content [Fig. 6(a)]. As nanoparticles in powders tend to form agglomerates and consequently to develop bulk-like bands a relationship between the adsorption coefficient (α) near the absorption edge and the optical band gap (E g) for direct interband transitions can be obtained.Reference Dimesso, Dimamay, Hamburger and Jaegermann2,Reference Dimesso, Fasel, Lakus-Wollny, Mayer and Jaegermann40 The plots derived from the relationship, leads to graphics as shown in Fig. 6(b). By extrapolating to α = 0, the plots of the iodine containing perovskites revealed a direct semiconducting behavior with band energy gaps between 1.31 eV (y = 0.0) and 1.34 eV (y = 0.1). On the other hand, the bromine containing perovskite systems revealed a direct semiconducting behavior with band energy gaps decreasing at increasing the Sr-content reaching a minimum of ∼1.38 eV for y = 0.075. For y = 0.0, the present experimental value of approximately 2.65 eV is higher than that of 2.40 eV reported recently by FerraraReference Ferrara, Patrini, Pisanu, Quadrelli, Milanese, Tealdia and Malavasi3 and in very good agreement with the theoretical value of 2.58 eV calculated from the GW-BSE theory (the Bethe–Salpeter equation).Reference Bokdam, Sander, Stroppa, Picozzi, Sarma, Franchini and Kresse41 The obtained data suggest a contribution of the A-site cation to the joint density of states in this system. Indeed, our result is in agreement with recent theoretical calculations showing that, for cubic Sn-based hybrid perovskites, the p-electrons of N and C atoms partially contribute to the valence band top.Reference Ma, Pan and Wong42 After annealing the Tauc’s plots showed a band energy gap around 2.43–2.45 eV which would confirm a rearrangement of the morphology, as revealed by the XRD patterns and SEM images.
(a) Normalized optical absorption spectra and (b) plots (αhν)2 for direct transitions (α is absorption coefficient, and hν is photon energy) of the FASn1−ySryX3 systems (0.0 ≤ y ≤ 0.1). The values of the optical absorption edges and of the band gap energy (E g, obtained by extrapolation to α = 0) are reported in Table II.
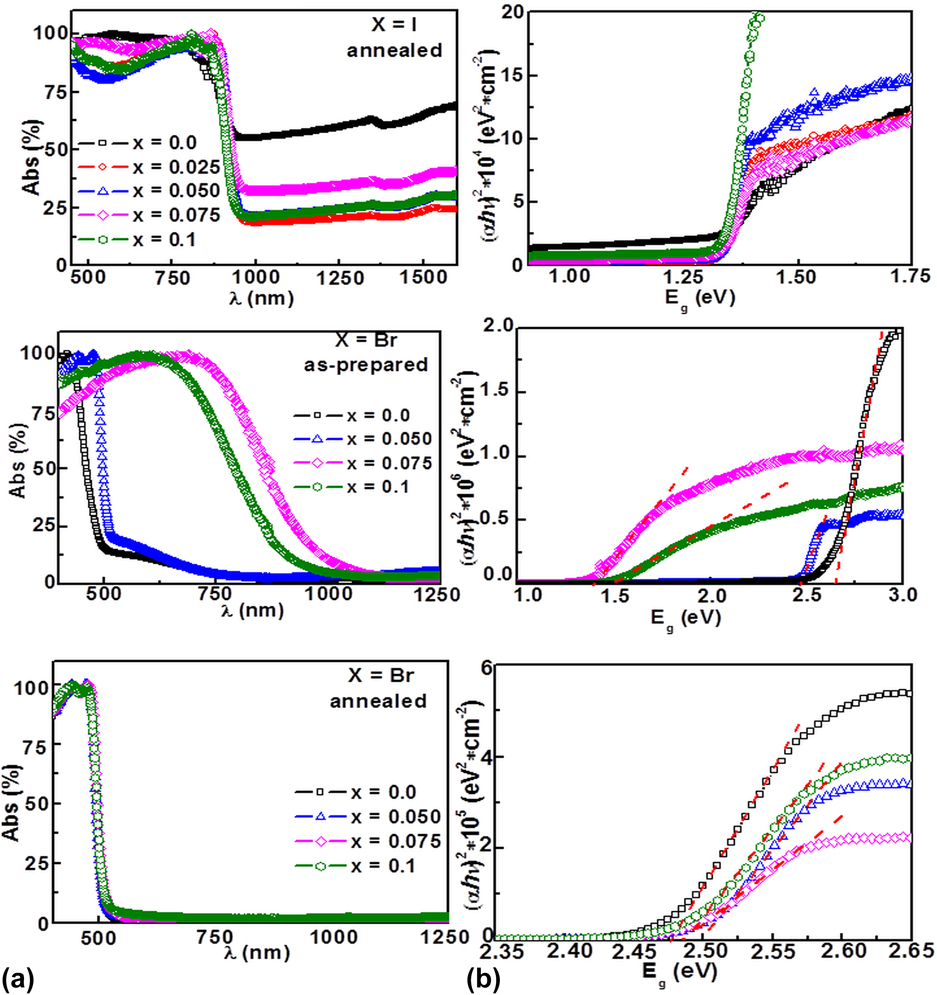
Optical properties of the FASn1−ySryX3 systems. The absorption edges (λon-set (nm)) were obtained by fitting the linear part of the absorbance spectra in Fig. 6(a) in accordance with the model proposed in Ref. Reference Dimesso, Dimamay, Hamburger and Jaegermann2. The optical energy band gaps, obtained from the data in Fig. 6(b), were calculated in accordance with the model in Ref. Reference Dimesso, Dimamay, Hamburger and Jaegermann2.

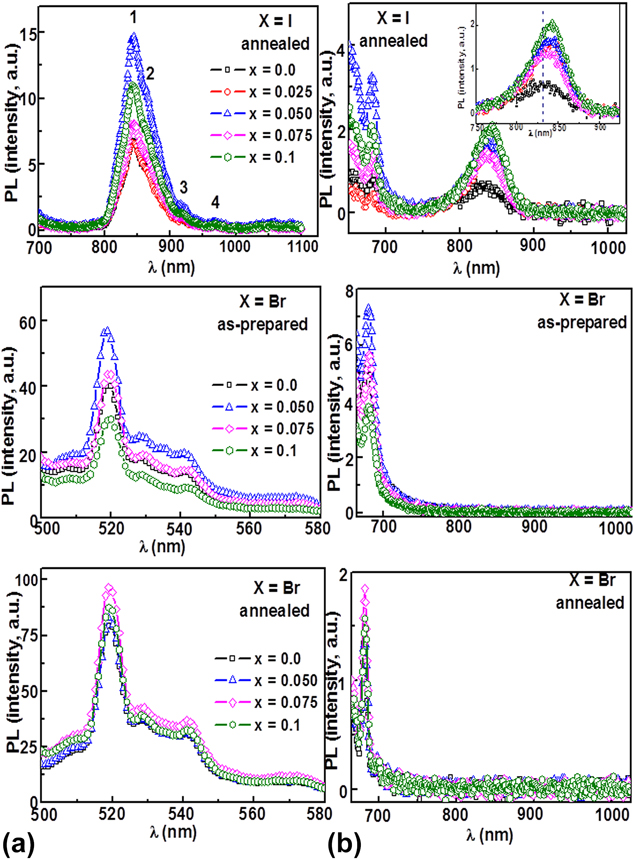
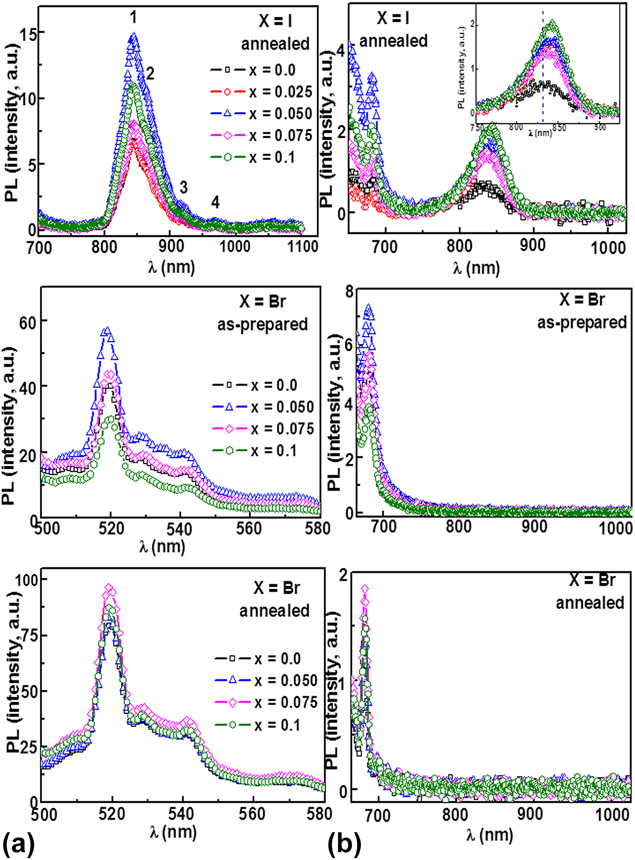
The steady state photoluminescence emission (PL) spectra of the FASn1−ySryX3 systems (0.0 ≤ y ≤ 0.1), measured at room temperature and excitation wavelengths λexc = 380 nm and λexc = 500 nm, are shown in Figs. 7(a) and 7(b) respectively. In the annealed iodine-containing perovskite for y = 0.0, the PL spectrum at λexc = 380 nm showed an emission band peaking at ∼845 nm [labeled with “1” in Fig. 7(a)] with a broad shoulder at ∼865 nm (labeled with “2”) and with additional bands peaking at ∼920 nm [“3” in Fig. 7(a)] and at ∼969 nm [“4” in Fig. 7(a)] respectively. Similar shapes of PL spectra were recently reported by Fang et al.Reference Fang, Protesescu, Balazs, Adjokatse, Kovalenko and Loi43 during their investigation of nanocrystalline ensembles and polycrystalline layer of the Pb-containing analogue. The authors observed PL bands peaking at higher wavelengths (∼855 nm). However, the measurements were recorded at low temperatures (25–35 K) where the formamidinium lead iodide adopt an orthorhombic crystalline structure; these emissions were attributed to free excitons and bound excitons with singlet and triplet characters, respectively. The addition of Sr ions as well their content can influence the PL response as previously observed by our group during the investigation of earth-alkaline-containing MASnI3 systems,Reference Dimesso, Das, Mayer and Jaegermann21 which can be explained by the incorporation of Sr ions into the perovskite crystalline structure and their interaction with the iodine ions which change the local field strength of the Sn ions in the [SnI6]2− octahedra as observed in oxide phosphors.Reference Gasparotto, Lima, Davolos, Varela, Longo and Zaghete44–Reference Cao, Luo, Xu, Luo, Hua, Fu and Peng46 At higher Sr content, a quenching effect may take place with a consequent decrease of the PL intensity.Reference Cao, Luo, Xu, Luo, Hua, Fu and Peng46 The PL profiles of the FASn1−xSrxI3 systems measured at λexc = 500 nm [Fig. 7(b)] revealed emission peaks at ∼681 nm which are typical PL features of iodide-containing systems and were also observed during our investigations of Cs–Sn–IReference Dimesso, Das, Stöhr and Jaegermann47 and MA-Sn–I systems.Reference Dimesso, Das, Mayer and Jaegermann21 Finally the emission peaks at ∼830–840 nm are typical PL features of the formamidinium-containing systems; this emission, peaking at ∼838 nm, was observed by WangReference Wang, Guan, Galeschuk, Yao, He, Jiang, Zhang, Liu, Jin, Jin and Song48 during the investigation of pressure-induced structural and electronic changes of the α-FAPbI3 phase. In our case, the addition of Sr ions shifts the emission peaks from ∼830 nm (y = 0.0) to ∼842 nm (y = 0.1) as shown in the inset of Fig. 7(b). This can be explained by the exchange between Sn2+ and Sr2+ ions, which can change the local environment of the Sn2+ and possibly the mechanism of the spectroscopic transitions and favoring higher intensity of the luminescence emissions without changing the nature of the emission bands. Similar arguments can explain the PL emission profiles of the Br-containing systems. The PL spectrum of the as-prepared samples (y = 0.0) at λexc = 380 nm displayed an emission band peaking at ∼519 nm (with shoulders at ∼528.5 nm and ∼541 nm respectively) and a broader band at ∼572 nm [as shown in Fig. 7(a)]. To the best of our knowledge, the obtained PL spectra have not been reported earlier; therefore, a comparison with previous data cannot be done. On the other hand, the PL spectra measured at excitation wavelength λexc = 500 nm [Fig. 7(b)] revealed emission peaks at ∼681 nm, which are typical PL features of halogenide-containing systems. After thermal treatment, the materials displayed an absorption edge value in the range 520–530 nm [Fig. 7(a)] independently of the initial Sr content and a dramatic increase of the PL response; the data are in agreement with the optical measurements and would confirm the changes occurring after the thermal treatment in nitrogen. On the other hand, a further decrease of the PL response was observed at higher excitation energy as shown in Fig. 7(b) (λexc = 500 nm) although no changes in the peak wavelengths were noted.
Steady state PL emission spectra of the FASn1−ySryX3 systems (0.0 ≤ y ≤ 0.1) measured (at room temperature) at the excitation wavelengths of (a) λexc = 380 nm and (b) λexc = 500 nm, respectively. The y-axis values indicate the PL-intensity ratios using the sample for y = 0.0 as reference only.
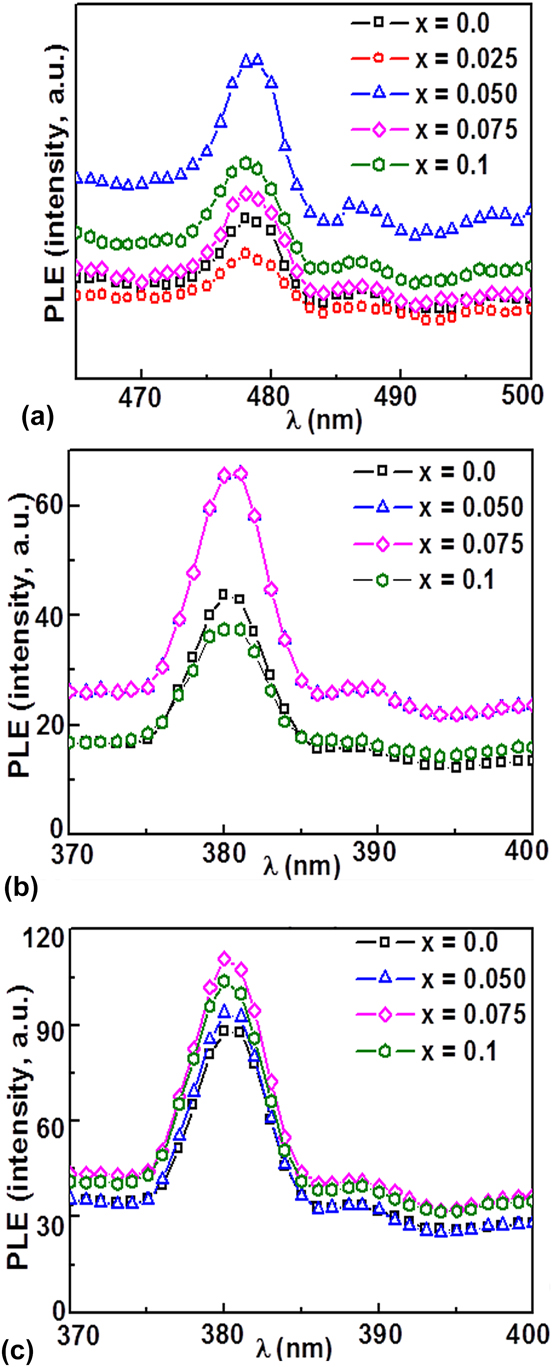
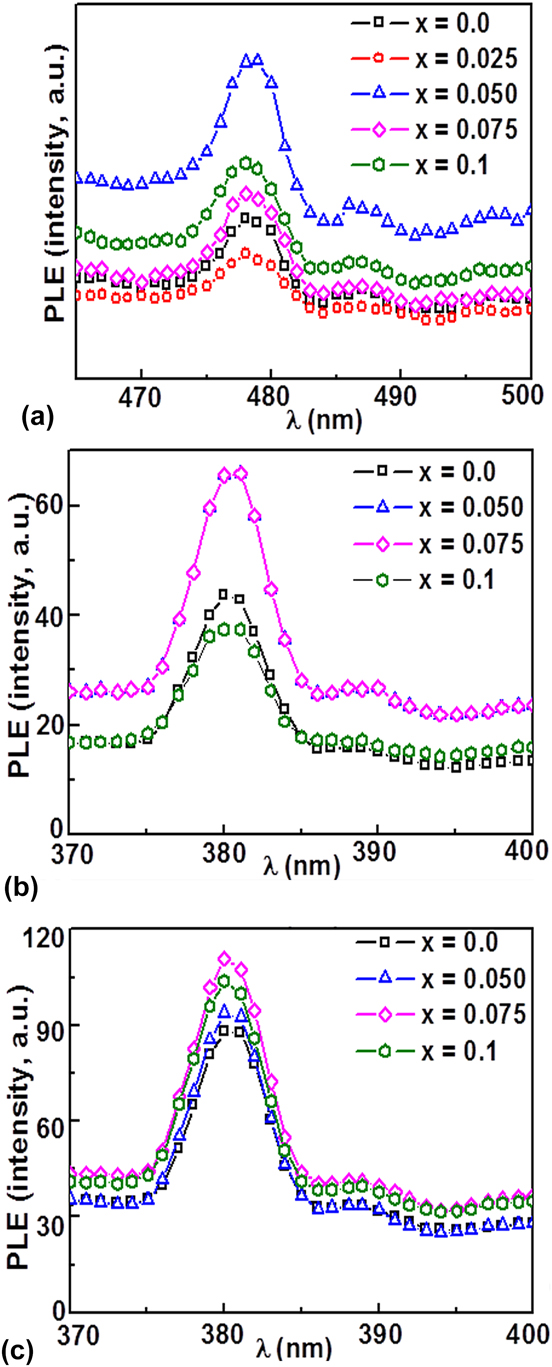
The PL excitation profiles (PLEs) of the FASn1−ySryX3 systems measured at room temperature are shown in Fig. 8(a) for X = I (annealed, emission wavelength λem = 840 nm), Fig. 8(b) for X = Br (as prepared) and Fig. 8(c) for X = Br (annealed) at emission wavelength of λem = 520 nm, respectively. In the I-containing systems, the PLE spectra showed a major excitation band peaking at ∼479 nm and a broad shoulder at ∼487 nm. On the other hand, in the Br-containing systems, the PLE spectra of the as-prepared samples showed a major excitation band peaking at ∼380 nm and a very broad shoulder at ∼389 nm. After annealing, a dramatic increase of the PLE response was observed as shown in Fig. 8(c). The broadness of the PLE maxima can indicate a complicate configuration of the PL mechanisms due to the possible presence of several relatively narrow under-bands. We cannot compare our results due to the lack of literature on PLE investigations on FASnX3 systems, and for the time being, we can only speculate that the lone pair s 2 of the Sn2+ ions plays an important role in the PL features of these systems.
PLE excitation spectra of the FASn1−ySryX3 systems (0.0 ≤ y ≤ 0.1) measured (at room temperature) at the emission wavelength of (a) λem = 840 nm for X = I (annealed); and λem = 520 nm for X = Br, (b) as prepared, and (c) after annealing. The y-axis values indicate the PLE intensity ratios using the sample for y = 0.0 as reference only.
IV. CONCLUSION
In this work the investigation of structural, microstructural, optical, and PL properties of the FASn1−ySryX3 (X = I, Br, 0.0 ≤ y ≤ 0.1) systems prepared by the precipitation process in acidic aqueous solutions are reported.
For the iodine-containing systems, the derivative profile under nitrogen of the dynamic differential analysis showed major endothermic events peaking attributed to the decomposition processes of the FASnI3 system as confirmed by the weight losses recorded in the thermogravimetric profile. The XRD pattern samples revealed the presence of the orthorhombic FASnI3 (space group Amm2), which decomposes to noncrystalline phases at T = 230 °C under nitrogen, and monocline SnI2 phases. The shift in the crystalline reflection at higher diffraction angles after the addition of Sr ions was explained by the incorporation of the Sr2+ ions into the perovskite structure. Static thermogravimetric measurements under nitrogen at T = 85 °C revealed a decrease of the weight loss rate when the Sr content was increased and for y = 0.1 a barely measurable weight loss was recorded. The optical adsorption spectra displayed sharp absorption edges in the infrared region (1055 nm for y = 0.0, 950–960 nm for y = 0.1) as well as a decrease of the absorbance background in the optical profiles possibly due to a decrease of the population of the scattering centers. The Tauc plots revealed a direct semiconducting behavior with band energy gaps in the range of 1.31 and 1.34 eV. The steady state PL spectra (emission wavelength λexc = 380 nm) were consistent with the optical measurements and showed a broad emission event peaking at ∼845 nm with shoulders above 900 nm; the excitation profiles (emission wavelength λem = 520 nm) showed a maximum at ∼479 nm. On the other hand, in the Br-containing systems, the derivative profile of the dynamic differential analysis under nitrogen showed major endothermic events between 90 and 260 °C, which are attributed to decomposition processes of the FASnBr3 phase as confirmed by the weight losses recorded in the thermogravimetric profile. The XRD patterns of the as-prepared samples revealed the presence of the cubic FASnBr3 phase (space group  $Pm\bar{3}m$) as the major crystalline phase and tetragonal SnBr2. The high thermal stability at T = 85 °C was detected by the static thermogravimetric measurements which recorded a barely detectable weight loss, and for y = 0.075 a very low weight loss (∼0.3 wt%) was observed. The optical absorption spectra displayed sharp absorption edges from ∼492 nm (y = 0.0) to a maximum value of ∼975 nm for y = 0.075 which confirmed the beneficial effect of the Sr ions as scattering centers in hybrid perovskites. The Tauc plots revealed a direct semiconducting behavior with band energy gaps decreasing as the Sr content increased, reaching a minimum of ∼1.38 eV for y = 0.075. After the thermal treatment under nitrogen at T = 115 °C for t = 8 h, the XRD spectra revealed that the FASnBr3 phase retained the cubic crystalline structure and the formation of SrBr2 as the secondary phase was observed. Moreover, by adding Sr ions a shift of the crystalline reflections towards lower diffraction angles was detected. The change of the structural properties was confirmed by the SEM microscopy, which revealed a rearrangement of the crystallite morphology possibly due to the formation of a liquid phase. Additionally, the materials displayed a decrease of absorption edge values to 520–530 nm independently of the initial Sr content, and an increase of the PL-excitation response compared to that of the untreated samples was recorded. These changes were explained by the nature of the organic cation (polarization, size) and its interactions with the Sr-ions as well as by the growth of the FA-Sn(Sr)–Br crystallites and the formation of Sr–Br compounds.
The author is aware that this work is not complete and further research is necessary. Nevertheless, this work may open new perspectives in the investigation and application of hybrid perovskites in future technology.
Supplementary Material
To view supplementary material for this article, please visit https://doi.org/10.1557/jmr.2018.412.
ACKNOWLEDGMENTS
The author is very grateful to Prof. W. Jaegermann and to Dr. T. Mayer for the support and the valuable discussion during this work. Many thanks are owed to Mr. J-C. Jaud for the technical assistance in XRD analysis, to Mrs. K. Lakus-Wollny for the technical assistance in the morphological analysis and to Mrs. C. Fasel for the technical assistance in the thermal measurements. The author thanks the Federal Ministry of Research and Development (BMBF) (Project “Perosol” No. 03SF0483A) for the financial support during this work.