


1. Introduction
The stably stratified boundary layer (SBL), where denser fluid lies below lighter fluid aloft in a boundary layer flow, is relevant to many industrial and environmental applications from wind farms to nocturnal atmospheric boundary layers. From an environmental perspective, reduced mixing caused by stable stratification (SS) can locally increase air pollution due to the enhancement of black carbon concentration (Li et al. Reference Li, Guo, Ding, Liao, Liu, Sun, Wang, Xue, Zhang and Zhu2017). The nocturnal atmospheric boundary layer, pycnocline in the upper oceanic boundary layer and flow over sea ice in the arctic boundary layer are a few examples of environmental applications of SBLs.
Due to its practical importance, the SBL has been extensively investigated via laboratory experiments (Nicholl Reference Nicholl1970; Arya Reference Arya1975; Ohya, Neff & Meroney Reference Ohya, Neff and Meroney1997; Van Buren, Williams & Smits Reference Van Buren, Williams and Smits2017; Williams et al. Reference Williams, Hohman, Van Buren, Bou-Zeid and Smits2017), numerical studies (Garg et al. Reference Garg, Ferziger, Monismith and Koseff2000; Armenio & Sarkar Reference Armenio and Sarkar2002; Nieuwstadt Reference Nieuwstadt2005; Taylor, Sarkar & Armenio Reference Taylor, Sarkar and Armenio2005; Deusebio et al. Reference Deusebio, Schlatter, Brethouwer and Lindborg2011; Flores & Riley Reference Flores and Riley2011; García-Villalba & Álamo Reference García-Villalba and del Álamo2011; Huang & Bou-Zeid Reference Huang and Bou-Zeid2013; Donda et al. Reference Donda, van Hooijdonk, Moene, Jonker, van Heijst, Clercx and van de Wiel2015, Reference Donda, van Hooijdonk, Moene, van Heijst, Clercx and van de Wiel2016; van Hooijdonk et al. Reference van Hooijdonk, Moene, Scheffer, Clercx and van de Wiel2017; Flores & Riley Reference Flores and Riley2018; Atoufi, Scott & Waite Reference Atoufi, Scott and Waite2019, Reference Atoufi, Scott and Waite2020; Kirkpatrick et al. Reference Kirkpatrick, Williamson, Armfield and Zecevic2019) and field measurements (Nieuwstadt Reference Nieuwstadt1984; Sorbjan Reference Sorbjan2010; Mahrt Reference Mahrt2014, Reference Mahrt2019). These studies showed that SS reduces turbulent heat flux resulting in reduction of thermal mixing and momentum flux across the boundary layer leading to reduction of skin friction coefficient.
Stably stratified boundary layers are often classified into three different stratification regimes: weak, moderate and strong based on values of the Richardson number (Garg et al. Reference Garg, Ferziger, Monismith and Koseff2000; Armenio & Sarkar Reference Armenio and Sarkar2002; Sorbjan Reference Sorbjan2010; Williams et al. Reference Williams, Hohman, Van Buren, Bou-Zeid and Smits2017) or the ratio between the boundary layer thickness  $h$ and the Monin–Obukhov scale,
 $L_{MO}$ (Obukhov Reference Obukhov1971; Flores & Riley Reference Flores and Riley2011; Gohari & Sarkar Reference Gohari and Sarkar2018; Atoufi et al. Reference Atoufi, Scott and Waite2020). For
 $h/L_{MO} < 0.4$, which are weakly stratified cases, turbulence behaves similar to neutral cases (Garg et al. Reference Garg, Ferziger, Monismith and Koseff2000; Armenio & Sarkar Reference Armenio and Sarkar2002; Taylor et al. Reference Taylor, Sarkar and Armenio2005). For the moderate stratification range, with
 $0.4 \le h/L_{MO} < 0.8$, features of the flow are controlled by buoyancy (Garg et al. Reference Garg, Ferziger, Monismith and Koseff2000; Taylor et al. Reference Taylor, Sarkar and Armenio2005). Strongly stable boundary layers (SSBLs), with
 $h/L_{MO} \ge 0.8$ (García-Villalba & Álamo Reference García-Villalba and del Álamo2011; Flores & Riley Reference Flores and Riley2011; He Reference He2016; Atoufi et al. Reference Atoufi, Scott and Waite2019, Reference Atoufi, Scott and Waite2020) are dominated by the stabilizing effect of buoyancy through which turbulence become patchy or fully collapses, at least at early times. All these regimes involve simultaneous effects of buoyancy and the presence of the wall, each of which adds anisotropy to the kinetic energy cascade (Wyngaard Reference Wyngaard2010; Davidson Reference Davidson2013, Reference Davidson2015). Due to the complex nature of SSBLs, the physics of this flow regime is not yet fully grasped (Nieuwstadt Reference Nieuwstadt2005; Mahrt Reference Mahrt2014). The SSBL may lead to the coexistence of patches of active turbulence next to layered vortices (Atoufi et al. Reference Atoufi, Scott and Waite2019) or full relaminarization depending on the friction Reynolds and Richardson number (Nieuwstadt Reference Nieuwstadt2005; Flores & Riley Reference Flores and Riley2011; Donda et al. Reference Donda, van Hooijdonk, Moene, Jonker, van Heijst, Clercx and van de Wiel2015, Reference Donda, van Hooijdonk, Moene, van Heijst, Clercx and van de Wiel2016; He Reference He2016; Atoufi et al. Reference Atoufi, Scott and Waite2019). Recently, it is shown that the relaminarization could be transient, depending on how the flow is initialized (Donda et al. Reference Donda, van Hooijdonk, Moene, Jonker, van Heijst, Clercx and van de Wiel2015, Reference Donda, van Hooijdonk, Moene, van Heijst, Clercx and van de Wiel2016). Artificial enhancement of turbulent kinetic energy (TKE) at a few turnover times before the full collapse of turbulence will cease the laminarization process (Donda et al. Reference Donda, van Hooijdonk, Moene, Jonker, van Heijst, Clercx and van de Wiel2015, Reference Donda, van Hooijdonk, Moene, van Heijst, Clercx and van de Wiel2016). Furthermore, outer-layer (OUL) structures play an important role in controlling the dynamics of the SSBL where increasing their kinetic energy prevents full collapse of turbulence (Flores & Riley Reference Flores and Riley2011), and removing them prevents recovery from partial collapse (Atoufi et al. Reference Atoufi, Scott and Waite2019).
The first phase of wall turbulence response of a neutral boundary layer to the introduction of SS, whether by cooling from the bottom or heating from the top boundary, is decay (Garg et al. Reference Garg, Ferziger, Monismith and Koseff2000; Flores & Riley Reference Flores and Riley2011; Atoufi et al. Reference Atoufi, Scott and Waite2019). This phase can be understood using Reynolds stress budget equations (Arya Reference Arya1975; Garg et al. Reference Garg, Ferziger, Monismith and Koseff2000; Atoufi et al. Reference Atoufi, Scott and Waite2019, Reference Atoufi, Scott and Waite2020). The diagonal components of these equations explain the evolution of velocity variances. Due to the vertical orientation of the buoyancy force, the immediate effect of SS is to decrease vertical velocity fluctuations. Subsequently, the tangential Reynolds stress and the production of vertical momentum flux of turbulence are suppressed (Stewart Reference Stewart1959; Arya Reference Arya1975; Van Buren et al. Reference Van Buren, Williams and Smits2017; Williams et al. Reference Williams, Hohman, Van Buren, Bou-Zeid and Smits2017; Gohari & Sarkar Reference Gohari and Sarkar2018; Atoufi et al. Reference Atoufi, Scott and Waite2019, Reference Atoufi, Scott and Waite2020). The effect of SS on the production of vertical momentum is shown to be more dominant compared with the effect of SS on the tangential Reynolds stress (and thus the production of turbulent kinetic energy) (Nicholl Reference Nicholl1970; Arya Reference Arya1975; Van Buren et al. Reference Van Buren, Williams and Smits2017; Atoufi et al. Reference Atoufi, Scott and Waite2019; Shah & Bou-Zeid Reference Shah and Bou-Zeid2019). The significance of SS in the evolution of turbulence producing structures embedded in the budget of vertical momentum flux over turbulence production itself led the authors of the current paper to show that the impact of SS on near-wall turbulence is transient for those flows that are weakly stratified or strongly stratified but somehow recovered from partial or full collapse (Atoufi et al. Reference Atoufi, Scott and Waite2020). Thus, even for strong stratification, the near-wall cascade of TKE is expected to follow weakly stratified flows if turbulence is fully recovered. However, details of stratification effects on large outer scale motions are yet to be addressed.
A more comprehensive picture of SS effects can be gained by analysing the spectral representation of velocity components (García-Villalba & Álamo Reference García-Villalba and del Álamo2011; Flores & Riley Reference Flores and Riley2018). In the buffer layer (BFL) of closed-channel flows, while the streamwise and spanwise scales for spanwise velocity are generally smaller in the presence of SS, the wall-normal component is less sensitive (García-Villalba & Álamo Reference García-Villalba and del Álamo2011). In the logarithmic layer (LGL), effects are more pronounced. Spectra of all velocity components reveal that energetic scales become smaller with increasing stratification (García-Villalba & Álamo Reference García-Villalba and del Álamo2011). In the OUL, the effects of strong SS are stronger than in other layers, and spectra become different compared with those from a neutral case. In the OUL, the energy-containing spanwise scales become larger as stratification increases, as shown in figure 16 of García-Villalba & Álamo (Reference García-Villalba and del Álamo2011).
In channels, due to the inhomogeneity of the flow in the vertical direction the conventional representation of velocity components in Fourier space can inform us only about horizontal scales. To better understand kinetic energy cascade in an SBL, the role of vertical scales needs to be considered, which has not been addressed much in earlier studies. For homogeneous directions, by using Fourier transform, the standard energy spectrum provides a convenient definition of energy density (i.e. energy per wavenumber). For inhomogeneous directions there is no consensus in the literature on how to define energy density. One approach is to use the second-order structure function (Davidson & Pearson Reference Davidson and Pearson2005; Cimarelli et al. Reference Cimarelli, De Angelis, Jiménez and Casciola2016). The second-order structure function can describe how kinetic energy is distributed among the hierarchy of eddies. The structure function provides information about the energy of eddies when their size is much smaller than the separation  $r$. The eddies of size much greater than
 $r$ make little contribution to the structure function at separation
 $r$. For eddies of a size in between, the structure function mixes information from large and small scales (Davidson & Pearson Reference Davidson and Pearson2005). Davidson & Pearson (Reference Davidson and Pearson2005) proposed using the signature function, which can reproduce TKE when integrated over all separations and does not involve the Fourier transform. Thus the proposed definition can provide a picture of the energy spectrum in physical space. The authors then showed that (figures 1, 2 of Davidson & Pearson Reference Davidson and Pearson2005) the proposed definition leads to accurate description of viscous effects on the energy cascade by comparing their result against the conventional energy spectrum for grid turbulence. Nonetheless, the second-order structure function and also the signature function are not kinetic energy, but it can be shown that the structure function is related to kinetic energy in the limit of large scales.
Another approach, first proposed by Hamba (Reference Hamba2015, Reference Hamba2018), is to use the two-point correlation function. This idea is inspired by the observation that, for isotropic turbulence, one can write the energy of scales larger than a given scale,  $r$, in terms of the two-point correlation function. Hamba (Reference Hamba2018) used this idea to develop the concept of the energy density (
 $\text {ED}$), which is the kinetic energy per scale for inhomogeneous turbulence. To obtain a positive energy density for isotropic turbulence, Hamba (Reference Hamba2018) used the two-point correlation function filtered with a kernel function. By analysing energy transfer for homogeneous and inhomogeneous directions within scale space, Hamba (Reference Hamba2018) showed that there is an energy cascade from large to small scales using the proposed formulation for energy density. Interestingly, an inverse energy cascade from large to very large scales in the near-wall region was shown to happen in the spanwise direction of scale space (Hamba Reference Hamba2018). Moreover, the new formulation was shown to predict the scale dependence of the upward and downward fluxes of turbulence kinetic energy. These promising capabilities of the energy density formulation for the inhomogeneous direction motivate the present study, where we use it for stably stratified open-channel flow in the vertical direction. The present work contributes to our understanding of the mechanisms involved in the energy cascade for SSBLs. Characterizing scales that are dominant in the kinetic energy cascade is another critical theme which this paper aims to address. To do so, kinetic energy density and its budget equation are investigated in wavenumber-scale space. The energy density is constructed based on a modification of the conventional kinetic energy spectrum by vertical scales. To incorporate vertical scales, we use the filtering of the correlation function as proposed by Hamba (Reference Hamba2018). We mainly analyse the scale dependence in the vertical through the use of a hierarchy of scales based on known channel flow physics. We also analyse and compare unstratified and strongly stably stratified cases, the latter of which is computationally challenging and physically less well understood.
This paper is organized as follows. The mathematical problem formulation is presented in § 2, including numerical methods and a mathematical framework for energy density in spectral-scale space. The budget of energy density in spectral-scale space is introduced and discussed in 2.3. The details of the simulations are introduced in § 3. Results are discussed in § 4. The different mechanisms that contribute to energy cascade are addressed in the results section. Further discussion about results is presented in § 5. This paper will end with § 6, where concluding remarks are highlighted.
2. Mathematical formulation
2.1. Equations of motion and numerical method
In this paper we adopt the non-dimensionalized Navier–Stokes equations under the Oberbeck–Boussinesq approximation (OBA), for which the equations are (Taylor et al. Reference Taylor, Sarkar and Armenio2005; He Reference He2016)
 \begin{gather} \frac{\partial u_i}{\partial x_i}=0, \end{gather}
 \begin{gather} \frac{\partial u_i}{\partial t}+u_j\frac{\partial u_i}{\partial x_j}={-}\frac{\partial p}{\partial x_i}+\frac{1}{Re_\tau}\frac{\partial^2 u_i}{\partial x_j \partial x_j} + Ri_\tau \ \theta \ \delta_{i3} + \delta_{i1}, \end{gather}
 \begin{gather} \frac{\partial \theta}{\partial t}+u_j\frac{\partial \theta}{\partial x_j}=\frac{1}{Pr Re_\tau}\frac{\partial^2 \theta}{\partial x_j \partial x_j} , \end{gather}
where  $t$ denotes time and
 $u_i$
 $(i=1,2,3)$ refers to velocity components in the streamwise (
 $x_1=x$), spanwise (
 $x_2=y$) and wall-normal (
 $x_3=z$) directions, respectively;
 $p$ and
 $\theta$ are deviations in pressure and temperature from a hydrostatic background state of constant temperature;
 $Re_\tau$ and
 $Ri_\tau$ are reference values for the friction Reynolds and Richardson number and
 $Pr$ is the Prandtl number.
With the choice of the reference friction velocity  $u_\tau =\sqrt {\tau _w/\rho _0}$, where
 $\tau _w$ is the wall shear stress and
 $\rho _0$ is the reference density, channel height
 $h$, fluid kinematic viscosity
 $\nu$, fluid thermal conductivity
 $\kappa _\theta$ and imposed heat (cooling) flux at the bottom boundary
 $H_w$, the non-dimensional parameters can be defined as,
 \begin{equation} \left. \begin{gathered} Re_\tau=\frac{u_\tau h}{\nu}, \\ Ri_\tau= \frac{g}{\theta_0} H_w \frac{h^2}{u_\tau^2}, \\ Pr = \frac{\nu}{\kappa_\theta}, \end{gathered} \right\} \end{equation}
where  $g$ is the gravitational acceleration and
 $\theta _0$ is a reference temperature. The bulk Richardson number is defined as
 $Ri_b=Ri_\tau u_\tau ^2/U_b^2$ where
 $U_b$ is domain averaged mean velocity (Taylor et al. Reference Taylor, Sarkar and Armenio2005).
The simulation test case considered for this work is an open-channel flow with constant cooling flux imposed at the bottom boundary and fixed temperature at the top boundary. No-slip and free-slip boundary conditions are respectively applied to velocity components at the bottom and top boundary. Boundary conditions on temperature are cooling ( $\partial \theta /\partial z=1$) at the bottom and constant temperature (
 $\theta =0$) at the top in the wall-normal direction. Periodic boundary conditions are used for all fields in the streamwise and spanwise directions.
This mathematical formulations and boundary conditions have been used in previous studies (Nieuwstadt Reference Nieuwstadt2005; Flores & Riley Reference Flores and Riley2011; Donda et al. Reference Donda, van Hooijdonk, Moene, Jonker, van Heijst, Clercx and van de Wiel2015, Reference Donda, van Hooijdonk, Moene, van Heijst, Clercx and van de Wiel2016). This configuration is similar to the situation at sunset in the atmospheric boundary layers, where the background virtual potential temperature is nearly constant in the first few hundreds of metres above ground (Metzger, McKeon & Holmes Reference Metzger, McKeon and Holmes2007) leading to  $\theta =0$ in Oberbeck–Boussinesq type models for dry air.
The governing equations are solved using a scalable solver called Hercules based on the Fourier spectral method for horizontal derivatives and second-order finite difference scheme for vertical derivatives on a staggered grid (He Reference He2016). Semi-implicit third-order Runge–Kutta and Crank–Nicholson schemes were used for time integration. The fractional step method was used to impose continuity. Further details of the numerical scheme have been presented in previous studies (He Reference He2016; Atoufi et al. Reference Atoufi, Scott and Waite2019, Reference Atoufi, Scott and Waite2020).
2.2. Energy density in spectral-scale space
For horizontally homogeneous and stationary turbulence, the horizontal Fourier transform of the two-point velocity correlation can be written as
 \begin{equation} \widehat{Q_{ii}}^*(\boldsymbol{k},\xi_z,z)= \left\langle \widehat{u'_i}(\boldsymbol{k},z,t) \widehat{u'_i}^*(\boldsymbol{k},z+\xi_z,t) \right\rangle , \end{equation}
where  $\xi _z$ is the vertical separation and
 $\boldsymbol {k}=(k_x,k_y)$ is horizontal wavenumber vector;
 $\langle \cdot \rangle$ stands for time average;
 $\widehat {u'_i}$ are the two-dimensional Fourier transforms of the fluctuating velocity components from the horizontal average;
 $^*$ represents complex conjugate.
For separations with  $\xi _z=0$, i.e. purely horizontal separations, the horizontal energy spectrum can be directly extracted from
 $\widehat {Q_{ii}}^*/2$. For the vertical direction, we adopt the formulation proposed by Hamba (Reference Hamba2018) to define energy density for turbulence with possible inhomogeneity. However, we introduce a criterion for generalization of the filter kernel and, unlike Hamba (Reference Hamba2018, Reference Hamba2019), we keep the Fourier approach in the horizontal while applying Hamba's (Reference Hamba2018, Reference Hamba2019) approach in the vertical direction only. The resulting expression given for energy density is derived in this section, based on the ideas in Hamba (Reference Hamba2015, Reference Hamba2018, Reference Hamba2019). In what follows, we drop the time dependence for simplicity. Moreover, we use the same notation as used in Hamba (Reference Hamba2018) for the energy, but here it is in horizontal Fourier space, whereas in Hamba (Reference Hamba2018), it is in physical space.
First, let  $E_{>}(\boldsymbol {k},r_z,z)$ be the kinetic energy associated with the horizontal wavenumber
 $\boldsymbol {k}$ and vertical scale larger than a given vertical scale
 $r_z$. Then, the contribution to the kinetic energy from eddies with vertical length scales
 $l_z$ slightly larger than
 $r_z$, i.e. with
 $r_z \leq l_z \leq r_z+\textrm {d}r_z$, is
 \begin{equation} E_{>}(\boldsymbol{k},r_z,z)-E_{>}(\boldsymbol{k},r_z+\textrm{d}r_z,z) \approx{-}({\partial E_{>}}/{\partial r_z})\,\textrm{d}r_z, \end{equation}
for sufficiently small  $dr_z$. Thus
 ${\partial E_{>}}/{\partial r_z}$ contains information about the energy concentration around scales
 $r_z$. The next step is constructing
 $E_>$. Two constraints should be satisfied, although they might not lead to a unique expression. These constraints are extensions of the criterion given by Hamba (Reference Hamba2018), who gave them entirely in physical space, to horizontal spectral and vertical scale space (spectral scale). These constraints are
 \begin{equation} \left. \begin{gathered} E_{>}(\boldsymbol{k},r_z=0,z)= \widehat{Q_{ii}}^*(\boldsymbol{k},\xi_z=0,z) , \\ \lim_{r_z\to\infty} E_{>}(\boldsymbol{k},r_z,z)=0. \end{gathered} \right\} \end{equation}
The first constraint is that  $E_{>}(\boldsymbol {k},0,z)$ must recover the horizontal wavenumber kinetic energy spectrum at each
 $z$. The second constraint ensures boundedness for large
 $r_z$. From the first constraint,
 $E_{>}(\boldsymbol {k},r_z=0,z)$ is positive semi-definite. The energy density is defined as
 \begin{equation} \text{ED}={-}\frac{\partial E_{>}}{\partial r_z}. \end{equation}
Here,  $\widehat {Q_{ii}}^*$ satisfies the constraints mentioned above in the case of homogeneity in all three dimensions. Thus
 $\widehat {Q_{ii}}^*$ might be considered as a possible choice for
 $E_>$. However,
 $\widehat {Q_{ii}}^*$ is not necessarily a decreasing function with respect to vertical scale
 $r_z$, and thus special treatment is considered to modify velocity correlations by which the constraints are satisfied.
Given the conditions in (2.7), one may interpret  $E_{>}(\boldsymbol {k},r_z,z)$ as the kinetic energy associated with horizontal wavenumber
 $\boldsymbol {k}$ and vertical scales larger than
 $r_z$. Thus,
 $E_>$ has a low-pass (compared with
 $r_z$) filter of velocity correlation in its definition. In what follows, we adopt
 $\widehat {Q_{ii}}^*$ as a base function and we seek the class of filter kernels which, when applied to
 $\hat {Q}_{ii}^*$, give
 $E_>$ that satisfies the constraints. Following Hamba (Reference Hamba2018, Reference Hamba2019),
 $E_>$ can be expressed as
 \begin{equation} E_>(\boldsymbol{k},r_z,z)=\int_{-\infty}^{+\infty} G(\xi_z, r_z) \widehat{Q_{ii}}^*(\boldsymbol{k},\xi_z,z) \, \mathrm{d}\xi_z, \end{equation}
where  $G$ is the filter kernel that needs to be specified. The first constraint for
 $E_>$ implies that
 \begin{equation} \int_{-\infty}^{+\infty} G(\xi_z, 0) \widehat{Q_{ii}}^*(\boldsymbol{k},\xi_z,z) \, \mathrm{d}\xi_z=\widehat{Q_{ii}}^*(\boldsymbol{k},0,z). \end{equation}
The second constraint imposes that
 \begin{equation} \lim_{r_z\to\infty} \int_{-\infty}^{+\infty} G(\xi_z, r_z) \widehat{Q_{ii}}^*(\boldsymbol{k},\xi_z,z) \, \mathrm{d}\xi_z=0, \end{equation}
and thus  $\lim _{r_z\to \infty } G(\xi _z,r_z)=0$, which suggests
 $G {=} ({1}/{r_z})f(\xi _z/r_z)$ where
 $f$ is a similarity function which should remain bounded when
 $r_z$ approaches infinity. By assuming
 $\widehat {Q_{ii}}^*$ is a smooth function of
 $\xi _z$, using Taylor series expansion around
 $\xi _z=0$ (2.10) yields
 \begin{equation} \left. \begin{gathered} \lim_{r_z\to 0} \int_{-\infty}^{+\infty} G(\xi_z, r_z) \, \mathrm{d}\xi_z=1, \\ \lim_{r_z\to 0} \int_{-\infty}^{+\infty} \xi_z^n G(\xi_z, r_z) \, \mathrm{d}\xi_z=0, \quad (n=1,2,\ldots), \end{gathered} \right\} \end{equation}
as two plausible constraints for the filter kernel and can serve as conditions to be satisfied in the definition of energy density. These imply that  $G$ is a filter kernel of filter width
 $r_z$ where the moments of order greater than one are all equal to zero in the limit of
 $r_z$ approaching zero. These criteria imply that, for very small values of
 $r_z$,
 $f$ should approaches zero at a rate much faster than the rate
 $1/r_z$ approaches infinity. Hence, a Gaussian form for
 $f$ where
 $f(\xi _z/r_z) = ({1}/{a}) \exp {(-(1/b)(\xi _z/r_z)^2)}$ is one possible choice, as employed by Hamba (Reference Hamba2018). Using (2.12) leads to
 $a=\sqrt {2{\rm \pi} }$,
 $b=2$, and thus, the filter kernel could be expressed as
 \begin{equation} G(\xi_z,r_z)=\frac{1}{\sqrt{2{\rm \pi} }r_z}\exp\left(-\frac{\xi_z^2}{2 r_z^2}\right). \end{equation}
Therefore, for channel flow turbulence, energy density in spectral-scale space based on (2.8) can be defined as (Hamba Reference Hamba2018),
 \begin{equation} \text{ED}(\boldsymbol{k},z,r_z,t)=\int_{-\infty}^{+\infty} \widehat{Q_{ii}}^*(\boldsymbol{k},\xi_z,z,t)\ G_D(\xi_z,r_z) \, \text{d} \xi_z = G_D \circ \widehat{Q_{ii}}^*, \end{equation}
where
 \begin{equation} G_D(\xi_z,r_z)={-}\frac{\partial G}{\partial r_z}=\frac{1}{\sqrt{2{\rm \pi}} r_z^2} \left(1-\frac{\xi_z^2}{r_z^2}\right) \exp{\left(-\frac{\xi_z^2}{2r_z^2}\right)}, \end{equation}
and  $\circ$ denotes integral operation, as specified in (2.14).
On the one hand, computations that involve the two-point velocity correlation are generally expensive. Thus, carrying out energy density calculations in purely physical space is costly for analysing simulations with a large computational domain or high Reynolds number. On the other hand, computations of Fourier modes required for spectral analysis are typically fast and can be efficiently extended for massively parallel calculations. The formulation for energy density discussed in this section provides a mathematical framework to incorporate vertical scales in conventional horizontal spectral analysis. This approach can maintain computational expense at affordable levels for large domains and high Reynolds numbers. In addition, analysing horizontal Fourier spectra has been an essential part of the numerous studies (del Álamo & Jiménez Reference del Álamo and Jiménez2003; del Álamo et al. Reference del Álamo, Jiménez, Zandonade and Moser2004; Jiménez Reference Jiménez2012; Mizuno Reference Mizuno2016; Cho, Hwang & Choi Reference Cho, Hwang and Choi2018; Lee & Moser Reference Lee and Moser2019) of kinetic energy cascade in wall-bounded flows. It is convenient to use the same framework wherever possible (horizontal planes). The method developed in this work allows incorporation of vertical scales in the Fourier spectral analysis of wall-bounded turbulent flows and enables us to examine how wall-generated inhomogeneity and vertical scales affect Fourier modes and energy-containing streamwise and spanwise scales.
2.3. Energy density exchange in spectral-scale space
To derive an equation for the evolution of kinetic energy density in stably stratified boundary layers, we employ the governing equations of velocity fluctuations
 \begin{gather} \frac{\partial u'_i}{\partial x_i}=0, \end{gather}
 \begin{gather} \frac{\partial u'_i}{\partial t}+ \frac{\partial \overline{u_i} u'_j}{\partial x_j} + \frac{\partial u'_i \overline{u_j}}{\partial x_j} + \frac{\partial u'_i u'_j}{\partial x_j} ={-}\frac{\partial p'}{\partial x_i}+\frac{1}{Re_\tau}\frac{\partial^2 u'_i}{\partial x_j \partial x_j} + Ri_\tau \theta' \delta_{i3}+\frac{\partial \overline{u'_i u'_j} }{\partial x_j}, \end{gather}
where overbars refer to horizontal averaging and primes refer to fluctuations from the horizontal average. We will use two independent coordinate systems, one of which is vertically shifted by  $\xi _z$ from the original coordinate
 $x_i$. Thus, the vertically shifted coordinate system has components
 $\eta _i=x_i+\xi _z \delta _{i3}$. Variables belonging to the shifted coordinate are denoted by
 ${{|_{\xi _z}}}$. For example,
 $\widehat {u'_i}^*|_{\xi _z}$ describes the complex conjugate of the Fourier transform of the fluctuating velocity component on a domain that is vertically shifted by
 $\xi _z$. The (vertically) shifted domain refers to a domain where the origin of the coordinate system is translated vertically where other components of the Cartesian coordinate system remain the same. Using the governing equation in the original and shifted domains provides the evolution dynamics of two-point correlations, which allows us to study the effects of vertical scale separation
 $\xi _z$.
The governing equation of the rate of change of energy density is readily derived by adding  $\widehat {u'_i}^*|_{\xi _z} ({\partial {\widehat {u'_i}}}/{\partial t})$ and
 $\widehat {u'_i} ({\partial {\widehat {{u'_i}|_{\xi _z}^*}}}/{\partial t})$. Then, the resulting expression is multiplied by the kernel function and integrated. The budget equation for energy density then reads as
 \begin{equation} \frac{\partial \text{ED}}{\partial t} = \frac{1}{2} \left(\text{TR} + \text{SP} + \text{PW} + \text{VD} + \text{BD} + \text{RS} \right) , \end{equation}
where the terms on the right-hand side are: nonlinear transfer, shear production, pressure transport (work), viscous contribution, buoyancy and Reynolds stress work. Before discussing each term in (2.18), it is worth discussing similarities and differences between (2.18) and the TKE budget equation (e.g. Taylor et al. Reference Taylor, Sarkar and Armenio2005). These two equations become equivalent if one considers the integral of (2.18) summed over horizontal wavenumbers and over the entire range of vertical scale since
 \begin{equation} k = \frac{1}{2}\overline{u'_iu'_i} =\int_0^{\infty} \sum_{\boldsymbol{k}} \text{ED}\, \text{d}r_z, \end{equation}
where the summation over wavenumber follows from Parseval's identity and the integration over  $r_z$ is due to the definition of
 $\text {ED}$ in (2.8) and criteria in (2.7). As we will see, (2.18) provides remarkably more information about the scale dependence of the kinetic energy evolution in space–time compared with the TKE budget equation.
The term  $\text {TR}$ is the nonlinear transfer of energy density, which is a convolution sum and therefore involves triad interactions among horizontal wavenumbers. For instance, the first part of the nonlinear term in the OBA equations can be expanded as
 \begin{equation} \widehat{\frac{\partial {u'_i} u'_j}{\partial x_j}} = Ik_1 \widehat{{u'_i} u'_1}+Ik_2 \widehat{{u'_i} u'_2}+{\frac{\partial{\widehat{{u'_i} u'_3}}}{\partial x_3}}, \end{equation}
which involves two kinds of nonlinear interactions: in-plane triad interactions as in the first two term and inter-plane interactions dictated by the last term (Bolotnov et al. Reference Bolotnov, Lahey, Drew, Jansen and Oberai2010). The total nonlinear transfer term is a summation of these two mechanisms as
 \begin{equation} \text{TR}={-}\text{TR}_i - \text{TR}_o={-}G_D \circ \left( \widehat{\frac{\partial {u'_i} u'_j}{\partial x_j}} \widehat{u'_i}^*|_{\xi_z} + \widehat{\frac{\partial {u'_i|_{\xi_z}} u'_j|_{\xi_z}}{\partial \eta_j}}^* \widehat{u'_i} \right), \end{equation}
and represents how energy density is transferred and transported by nonlinear interactions between scales and throughout the channel. For a given set of horizontal wavelengths  $(\lambda _x, \lambda _y)$, vertical scale
 $r_z$ and height
 $z$, positive
 $\text {TR}$ means ED is being transferred into that particular wavelength, vertical scale and height by nonlinear interactions and hence ED is increased. Similarly, for a given set of horizontal wavelengths
 $(\lambda _x, \lambda _y)$, vertical scale
 $r_z$ and height
 $z$, negative
 $\text {TR}$ means ED is being transferred out of that particular wavelength, vertical scale and height by nonlinear interactions and hence ED is decreased. The two contributions to
 $\text {TR}$ are
 $$\begin{gather} \text{TR}_i= G_D \circ \left\{\left(Ik_1 \widehat{{u'_i} u'_1}+Ik_2 \widehat{{u'_i} u'_2}\right) \widehat{u'_i}^*|_{\xi_z}\right\} \nonumber\\ + G_D \circ \left\{\left({-}Ik_1 \widehat{{u'_i|_{\xi_z}} u'_1|_{\xi_z}}^*-Ik_2 \widehat{{u'_i|_{\xi_z}} u'_2|_{\xi_z}}^*\right) \widehat{u'_i}\right\}, \end{gather}$$
which involves in-plane triad interaction, as will be discussed shortly, and
 \begin{equation} \text{TR}_o= G_D \circ \left(\widehat{\frac{\partial{{u'_i} u'_3}}{\partial x_3}} \widehat{u'_i}^*|_{\xi_z} + \widehat{\frac{\partial{{u'_i|_{\xi_z}} u'_3|_{\xi_z}}}{\partial \eta_3}}^* \widehat{u'_i}\right), \end{equation}
includes inter-plane interactions. Here,  $\text {TR}_o$ refers to the rate at which
 $\text {ED}$ varies due to vertical transport with wall-normal velocity in at least one of the pairs. At each vertical level, if this variation positively correlates with a corresponding fluctuating velocity component at a distance
 $\xi _z$ aloft (or below), then energy density increases at that specific height. The terminology in-plane and inter-plane is motivated by horizontal and vertical transport of kinetic energy following Bolotnov et al. (Reference Bolotnov, Lahey, Drew, Jansen and Oberai2010). For the special case of
 $\xi _z=0$,
 $\text {TR}_i$ refers to nonlinear horizontal advection and
 $\text {TR}_o$ refers to nonlinear vertical advection. When
 $\xi _z \ne 0$, it should be noted that both
 $\text {TR}_i$ and
 $\text {TR}_o$ have variability in the wall-normal direction. The change in
 $\text {TR}_i$ with height is the consequence of correlation between the original and vertically shifted domains as a result of the presence of vertical scales. The change of
 $\text {TR}_o$ with height is the results of vertical transport of kinetic energy presented by derivative with respect to
 $z$ in the definition of
 $\text {TR}_o$. Thus, although
 $\text {TR}_i$ can represent nonlinear interactions in horizontal planes for the special case of
 $\xi =0$,
 $\text {TR}_o$ always contains nonlinear inter-plane interactions. Therefore, it is helpful to separate
 $\text {TR}_i$ from nonlinear interactions that take place purely in horizontal planes.
The term  $\text {SP}$ represents production of kinetic energy density caused by mean shear;
 $\text {SP}$ reads as
 \begin{equation} \text{SP} ={-}G_D \circ \left( \widehat{\frac{\partial \overline{u_i} u'_j}{\partial x_j}} \widehat{u'_i}^*|_{\xi_z} + \widehat{\frac{\partial \overline{u_i}|_{\xi_z} u'_j|_{\xi_z}}{\partial \eta_j}}^* \widehat{u'_i} \right), \end{equation}
and involves the contribution of the mean shear to the production of ED for both original and vertically shifted domains. In deriving this equation, the fact that mean profiles and components of Reynolds stresses are only  $z$ dependent and come out of horizontal Fourier transform operations is used. In addition, there is no vertical mean velocity profile (i.e.
 $\overline {u}_3=0$) which has been used accordingly. Positive SP refers to the rate at which
 $\text {ED}$ (TKE density) is injected into a given set of horizontal wavelengths
 $(\lambda _x, \lambda _y)$, vertical scale
 $r_z$ and height
 $z$ from the mean flow. Negative SP refers to the rate at which it is extracted from a given set of horizontal wavelengths
 $(\lambda _x, \lambda _y)$, vertical scale
 $r_z$ and height
 $z$ to the mean flow.
The pressure transport term is given by
 \begin{align} \text{PW}&={-}G_D \circ \left({\widehat{{u'_i}|_{\xi_z}}}^* \frac{\partial{\widehat{p'}}}{\partial x_i} + \widehat{u'_i}\frac{\partial {{\widehat{{u'_3}|_{\xi_z}}}^*}}{\partial \eta_i} \right) \nonumber\\ & ={-}G_D \circ \left( \frac{\partial{\widehat{p'}\widehat{u'_i}^*|_{\xi_z}}}{\partial x_i} + \frac{\partial {{\widehat{{p'}|_{\xi_z}}}^*}\widehat{u'_i}}{\partial \eta_i} \right) \nonumber\\ & ={-} G_D \circ \left({{\frac{\partial {\widehat{{u'_3}|_{\xi_z}}}^* }{\partial \eta_3}}} \widehat{p'} +\widehat{\frac{\partial p'}{\partial x_3}} \widehat{u'_3}^*|_{\xi_z} - {{\frac{\partial {\widehat{{u'_3}}} }{\partial x_3}}} \widehat{p'|_{\xi_z}}^* +{\frac{\partial \widehat{p'|_{\xi_z}}^*}{\partial \eta_3}} \widehat{u'_3} \right), \end{align}
and therefore is due to vertical variation of correlation between the fluctuating pressure in the original domain and the fluctuating velocity of the shifted domain and vice versa;  $\text {PW}$ distributes energy toward different locations across the channel as a result of work exerted on a fluid element by the pressure gradients. As will be seen below, except in the lower viscous sublayer (VSL),
 $\text {TR}$ dominates
 $\text {PW}$ and thus is the main energy transfer/transport mechanism for upper VSL and aloft. However, in the lower VSL, where viscous effects are dominant and TKE is too small to transport the fluid particles aloft, the pressure transport is an inviscid mechanism amplifying energy density of fluid particles and moving them from the lower VSL. The largest values of pressure work occur in the lower VSL and above the VSL the contribution of
 $\text {PW}$ is small. Therefore,
 $\text {PW}$ is not discussed in detail in the results section for brevity.
Similar to nonlinear transfer, the viscous term  $\text {VD}$ has in-plane and inter-plane contributions as (Bolotnov et al. Reference Bolotnov, Lahey, Drew, Jansen and Oberai2010)
 \begin{equation} \text{VD}= \text{VD}_i+ \text{VD}_o=\frac{2}{Re_\tau} G_D \circ \left(\widehat{u'_i}^*|_{\xi_z} \widehat{\frac{\partial^2 u'_i}{\partial x_j \partial x_j}}+ \widehat{u'_i} \widehat{\frac{\partial^2 u'_i|_{\xi_z}}{\partial \eta_j \partial \eta_j}}^*\right) , \end{equation}
where
 \begin{equation} \text{VD}_i={-}\frac{2}{Re_\tau} G_D \circ\left( {k_1}^2 \widehat{u'_i} \widehat{u'_i}^*|_{\xi_z}+ {k_2}^2 \widehat{u'_i} \widehat{u'_i}^*|_{\xi_z}\right) , \end{equation}
is the horizontal gradient effect of viscosity and
 \begin{equation} \text{VD}_o= \frac{2}{Re_\tau} G_D \circ \left(\widehat{u'_i}^*|_{\xi_z} \frac{\partial^2 \widehat{u'_i} }{\partial x_3^2} + \widehat{u'_i} \frac{\partial^2 \widehat{u'_i}^*|_{\xi_z} }{\partial \eta_3^2}\right)= \text{VD}_o^{D} + \text{VD}_o^{\epsilon}, \end{equation}
is the vertical gradient effect of viscosity;  $\text {VD}_o^{D}$ and
 $\text {VD}_o^{\epsilon }$ in (2.28) correspond to viscous diffusion and viscous dissipation. The viscous diffusion is given by
 \begin{equation} \text{VD}_o^{D} = \frac{2}{Re_\tau} G_D \circ \left(\frac{\partial^2 \widehat{u'_i} \widehat{u'_i}^*|_{\xi_z} }{\partial x_3^2} + \frac{\partial^2 \widehat{u'_i}^*|_{\xi_z} \widehat{u'_i} }{\partial \eta_3^2}\right), \end{equation}
and the viscous dissipation is written as
 \begin{equation} \text{VD}_o^{\epsilon} ={-} \frac{4}{Re_\tau} G_D \circ \left(\frac{\partial \widehat{u'_i} }{\partial x_3} \frac{\partial \widehat{u'_i}^*|_{\xi_z} }{\partial x_3} + \frac{\partial \widehat{u'_i} }{\partial \eta_3} \frac{\partial \widehat{u'_i}^*|_{\xi_z} }{\partial \eta_3} \right). \end{equation}
It should be pointed out that  $\text {VD}_o^{\epsilon }$ is necessarily negative only for the special case of
 $\xi _z=0$. When
 $\xi _z \ne 0$,
 $\text {VD}_o^{\epsilon }$ is not necessarily a sink in the budget of the energy density. Thus, the naming of dissipation and diffusion is chosen to distinguish between
 $\text {VD}_o^{\epsilon }$ and
 $\text {VD}_o^{D}$ based on the nature of these two terms for the special case of
 $\xi _z=0$. The contribution due to buoyancy
 $\text {BD}$ is given as
 \begin{equation} \text{BD}= Ri_\tau G_D \circ \left(\hat{\theta'} \widehat{u'_3}^*|_{\xi_z} + \widehat{\theta'|_{\xi_z}}^* \widehat{u'_3}\right), \end{equation}
which involves correlation between fluctuating vertical velocity and temperature among the original and vertically shifted domains. Finally, the contribution of Reynolds stresses has the form
 \begin{equation} \text{RS}= G_D \circ \left(\widehat{u'_i}^*|_{\xi_z} {\frac{\widehat{\partial \overline{u'_i u'_3}} }{\partial x_3}} +\widehat{u'_i} \widehat{\frac{\partial \overline{u'_i|_{\xi_z} u'_3|_{\xi_z}} }{\partial \eta_3}}^*\right) = 0. \end{equation}
The RS term arises from the fact that Reynolds stresses ( $-\overline {u'_iu'_j}$) affect the dynamics of
 $u'_i$ by
 ${\partial \overline {u'_iu'_j}}/{\partial x_j}$. However, terms in the integrand that involve derivatives with respect to
 $x_3$ and
 $\eta _3$ are horizontally uniform, and therefore do not have contributions in spectral space other than the mean mode, and they are multiplied by
 $\widehat {u'_i}$ and
 $\widehat {u'_i}^*|_{\xi _z}$, which do not make mean mode contributions. Hence,
 \begin{equation} \left. \begin{gathered} \widehat{u'_i}(\boldsymbol{k}=0,z,t)=0 \\ \widehat{u'_i}^*|_{\xi_z}(\boldsymbol{k}=0,z,\xi_z,t)=0, \end{gathered} \right\} \end{equation}
due to the fact that the fluctuations at each time are defined as a deviation from the horizontally averaged field. Similarly,
 \begin{equation} \left. \begin{gathered} {\frac{\widehat{\partial \overline{u'_i u'_3}} }{\partial x_3}}(\boldsymbol{k}\neq 0,z,t)=0 \\ \widehat{\frac{\partial \overline{u'_i|_{\xi_z} u'_3|_{\xi_z}} }{\partial \eta_3}}^*(\boldsymbol{k}\neq 0,z,\xi_z,t)=0. \end{gathered} \right\} \end{equation}
Thus  $\text {RS} = 0$.
It is worth mentioning that, apart from the sound mathematical foundation that is provided by the Fourier spectral representation of the flow field data to analyse the energy cascade in the horizontal, we chose it because of its computational efficiency as well. For example, applying the fast Fourier transform to compute the in-plane energy spectrum is much faster than the calculation of the two-point velocity correlation in horizontal planes. However, even applying the scale-space formulation in only one direction, as we do here, is expensive and involves massive calculations in five dimensions at each analysis time: two for horizontal wavenumbers  $\mathrm {k}$, one for the wall-normal direction
 $z$, one for the vertical separation
 $\xi _z$ and one for vertical length scales
 $r_z$. As a result, a moderate Reynolds number is considered to make the computations tractable.
3. Simulation overview
To analyse the TKE cascade for an SBL, we considered three different simulations: an unstratified case, L0, and two strongly stable stratified cases, L1 and L2. Parameters for these test cases are summarized in table 1. In all of these simulations a computational domain of size  $L_x/h=8{\rm \pi}$,
 $L_y/h=6{\rm \pi}$ and
 $L_z/h=1$, with
 $h$ as the height of the open channel, is discretized using
 $N_x=1536$,
 $N_y=2304$ and
 $N_z=192$ grid points. The friction Reynolds number is of a moderate value at
 $Re_\tau =560$. The frictions Richardson numbers considered in this work cover neutral stratification where
 $Ri_\tau =0$ as well as strong stratification with
 $Ri_\tau =1120$ for L1 and
 $Ri_\tau =1680$ for L2. Prandtl number
 $Pr=1$ for all cases. Grid resolution in the horizontal plane (in wall units, e.g.
 $\Delta x ^+=\Delta x Re_\tau$) is
 $\Delta x ^+=9.2$ and
 $\Delta y^+=4.6$. In the vertical direction,
 $\Delta z^+$ increases from 0.32 to 6.3 at the wall and top of the open channel, respectively, as the grid is stretched in the wall-normal direction. The Reynolds number and grid resolutions in our simulations (L0–L2) are comparable to case B5b in García-Villalba & Álamo (Reference García-Villalba and del Álamo2011). Additionally, the
 $Re_\tau$ used in this study is comparable to the other recent studies of the wall-bounded stratified flows (Flores & Riley Reference Flores and Riley2011; Kirkpatrick et al. Reference Kirkpatrick, Williamson, Armfield and Zecevic2019, Reference Kirkpatrick, Williamson, Armfield and Zecevic2020).
Parameters that vary in different simulations.

The  $t_{av}$ in the table 1 refers to the averaging time interval for collecting statistics in stationary state. The
 $t_T$ refers to the total time for which each of the cases continued before collecting statistics. The time step is
 $\Delta t =0.0003$ for L0, and L1 and
 $\Delta t =0.0002$ for L2.
To measure the strength of SS in an open-channel flow, the ratio of open-channel height to the Monin–Obukhov length ( $L_{MO}$) (Flores & Riley Reference Flores and Riley2011, Reference Flores and Riley2018) is often used. In dimensionless form
 $L_{MO}/h$ can be defined as (Flores & Riley Reference Flores and Riley2011; Atoufi et al. Reference Atoufi, Scott and Waite2020)
 \begin{equation} \frac{h}{L_{MO}}=\frac{\kappa Ri_\tau}{Re_\tau Pr}, \end{equation}
where  $\kappa =0.41$ is the von Kármán constant. The
 $Ri_\tau =1120$ and
 $Ri_\tau =1680$ cases considered here correspond to
 $h/L_{MO}=0.82$ and
 $h/L_{MO}=1.23$. For values of
 $h/L_{MO} \lesssim 1$, near-wall turbulence is strongly affected by stratification, although the turbulence may not collapse depending on the initial condition (Atoufi et al. Reference Atoufi, Scott and Waite2019, Reference Atoufi, Scott and Waite2020). In cases such as L2, where
 $h/L_{MO} >1$, turbulence will collapse or undergo significant spatio-temporal intermittencies, as will be described later.
In the strongly SS regime for open-channel flow, the evolution of TKE is extremely sensitive to the choice of the initial condition. In fact, the effect of stratification on the transient dynamics is so strong, only simulations with carefully designed initial conditions will manage to survive significant decay early in the cooling process and recover from laminarization. For example, initializing strongly stratified cases (L1, L2) with the unstratified case (L0) leads to laminarization without recovery.
The unstratified case, L0, is initialized from a neutrally stratified open-channel flow simulation that has reached a stationary state on a smaller domain, with  $L_x=2{\rm \pi}$ and
 $L_y={\rm \pi}$ with the same grid resolution as L0. Then, the initial condition for L0 is obtained by copying the smaller domain simulation 4 times in the streamwise direction and 6 times in the spanwise direction. This systematic approach prevents intense deformation (stretching and tilting) of the coherent structures that are active in the small domain simulation and leads to shorter run time to acquire a new stationary state for L0.
For L1, we first run a small domain simulation with the same parameters and grid resolution as the full domain simulation but with a different upper thermal condition  $\partial \theta /\partial z=0$ (adiabatic free-slip wall at the top). This choice of upper thermal boundary condition was discussed in detail in Atoufi et al. (Reference Atoufi, Scott and Waite2019, Reference Atoufi, Scott and Waite2020). This first stage simulation is itself initialized with the small domain state used to initialize L0. After this first stage simulation reaches stationarity, we carry out the second stage of initialization (still on a small domain) where now the top boundary condition is the same as that used for L1 (free-slip condition for velocity and
 $\theta =0$). The second stage simulation is C5DC in table 1. After this second stage simulation acquires stationarity, we carry out the third stage of initialization, which is copying stage two onto the full domain.
The first stage of initializing L2 is performed with a smaller domain simulation with adiabatic and free-slip top boundary conditions, initialized with instantaneous data taken from the end of L1 in stage 1, at which the TKE reaches its maximum. We then add uniformly distributed random noise to velocity components with an amplitude of 0.2. We then run the first stage of the initialization of L2 with this initial field. As the flow reaches stationarity, we then switch to the second stage, where we use the same boundary condition as L2 (free-slip condition for velocity and  $\theta =0$) but still on a smaller domain until stationarity is reached. It should be pointed out that flow at this second stage becomes spatially intermittent but temporally stationary. At this point, although the flow becomes patchy, this patchiness persists in time and neither entirely collapses nor recovers from such a state. Now, the results of the second stages are then copied into the larger computational domain, and the last stage of initializing L2 is completed. It should be noted that skipping the first stage, and directly simulating the small domain simulation with the same boundary condition as L1 and L2, leads to full collapse due to the importance of the neutral OUL in recovery (Atoufi et al. Reference Atoufi, Scott and Waite2019).
It is worth emphasizing that the initialization process involves alternating with the size of the domain and the temperature boundary condition at the top boundary whereas the boundary conditions at the bottom wall is fixed (i.e. no slip for velocity,  $\partial \theta /\partial z=1$ for the scalar). It is also worth highlighting that when copying the small domain simulations into the full domain, we have added uniformly distributed random noise to the velocity components with an amplitude of 0.2. In addition, the large domain simulations ran for a relatively long turnover time before statistics were collected, as specified by
 $t_T$ in table 1. The range of vertical scales is equivalent in cases C5DC and L1. The lower computational cost associated with C5DC allows us to effectively study the full band of vertical scales to have a continuous picture of the role of different vertical scales in a strong stratification regime. The full band of vertical scales is further discussed in § 4.4.
In this study, carefully initialized flow prevents near-wall turbulence from full collapse and stabilizing the OUL controls recovery from partial collapse, leading to sustained patchiness of the flow in L2. Therefore, we can focus on the statistical characteristic of the flow at such strong stable stratification by having more samples and removing the time dependency of the intermittent state.
4. Results
In this section, the results of the analysis using the formulation for energy density balance given in § 2.3 are presented and discussed.
4.1. Horizontally averaged profiles
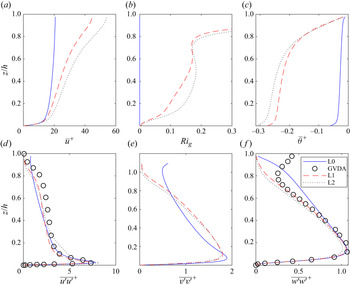
Prior to discussing the kinetic energy density in detail, we explore the main features of the different cases considered in this study. To do so, we consider vertical profiles of horizontally averaged first- and second-order statistics of velocity and temperature (figure 1). The vertical profile of the streamwise mean velocity (figure 1a) shows that the mean streamwise velocity increases with stratification. This is consistent with previous studies on smaller domains (Garg et al. Reference Garg, Ferziger, Monismith and Koseff2000; Armenio & Sarkar Reference Armenio and Sarkar2002; Nieuwstadt Reference Nieuwstadt2005; Taylor et al. Reference Taylor, Sarkar and Armenio2005; Flores & Riley Reference Flores and Riley2011; Donda et al. Reference Donda, van Hooijdonk, Moene, Jonker, van Heijst, Clercx and van de Wiel2015; Atoufi et al. Reference Atoufi, Scott and Waite2019, Reference Atoufi, Scott and Waite2020) and those with comparable domain size (García-Villalba & Álamo Reference García-Villalba and del Álamo2011). However, this increase in mean streamwise velocity is less pronounced in the inner-layer part, where  $z/h \lesssim 0.15$ due to the dominance of wall-generated shear over buoyancy (Nieuwstadt Reference Nieuwstadt2005; Taylor et al. Reference Taylor, Sarkar and Armenio2005; García-Villalba & Álamo Reference García-Villalba and del Álamo2011; Atoufi et al. Reference Atoufi, Scott and Waite2020). SS caused by the flux of heat from the top boundary accentuates this increase in mean streamwise velocity moving upwards.
Vertical profiles of mean flow variables and velocity variances. (a) Mean streamwise velocity, (b) gradient Richardson number, (c) mean temperature, (d) streamwise velocity variance, (e) spanwise velocity variance and (f) wall-normal velocity variance. GVDA refers to digitized data corresponding the case B5b of García-Villalba & Álamo (Reference García-Villalba and del Álamo2011) for closed-channel flow simulation with  $Re_\tau =550$,
 $Ri_\tau =980$,
 $Pr=0.7$ and fixed bottom and top wall temperatures as boundary conditions for temperature.

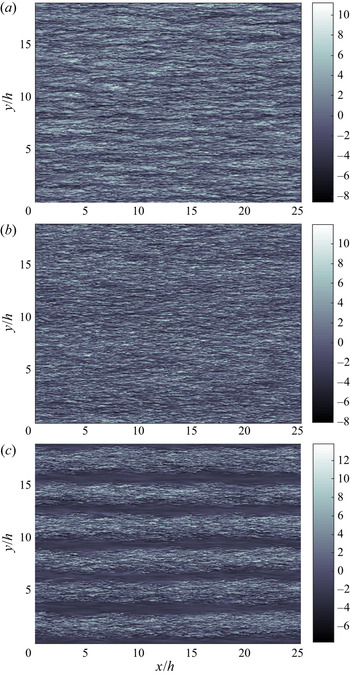
Profiles of streamwise velocity fluctuations in figure 1(d) suggest L0 and L1 have similar near-wall structures (e.g. streaks). The flow pattern in both cases is relatively similar in that spanwise homogeneity of turbulence is achieved. However, in L2, the flow consists of strips of active regions next to quiescent regions, as shown in figure 3. A similar flow structure is seen in the decay and early recovery phase of wall turbulence with surface cooling (Flores & Riley Reference Flores and Riley2011; García-Villalba & Álamo Reference García-Villalba and del Álamo2011; Atoufi et al. Reference Atoufi, Scott and Waite2019). The difference between the patchiness of the flow in L2 and that in our previous studies is that, in L2, the flow does not recover from such spanwise patchiness. This permanent intermittency of the flow in the spanwise direction is due to the balance between two simultaneous sources of SS imposed from the wall and top boundary (figure 1c). The appearance of intermittencies in the form of strips in open-channel turbulence, as opposed to other oblique structures in flows that are bounded by walls at both bottom and at top boundaries (García-Villalba & Álamo Reference García-Villalba and del Álamo2011; Duguet & Schlatter Reference Duguet and Schlatter2013), suggests the importance of the upper boundary condition in the determination of the form and orientation of the intermittent structures. However, further studies are required to understand the relationship between the strips and the oblique structures.
To show the strength of stratification, profiles of gradient Richardson number  $Ri_g$ are presented. The
 $Ri_g$ is defined as
 \begin{equation} Ri_g=\frac{N^2}{S^2}, \end{equation}
where  $N^2=Ri_\tau \partial \bar {\theta }/\partial z$ is the buoyancy frequency and
 $S^2=(\partial \bar {u}/\partial z)^2 + (\partial \bar {v}/\partial z)^2$. The profiles of
 $Ri_g$ are shown in figure 1(b). As can be seen, buoyancy becomes more significant over shear and the boundary layer becomes more stable moving upward and as
 $Ri_\tau$ increases. Consistent with the findings of García-Villalba & Álamo (Reference García-Villalba and del Álamo2011), in the OUL, where
 $z/h \ge 0.8$,
 $Ri_g$ acquires values close to the 0.25 stability criterion for both L1 and L2, which signifies strong effects of stratification in the OUL. In the near-wall region
 $z/h \le 0.15$ shear dominates buoyancy and stratification has minimal effect (Taylor et al. Reference Taylor, Sarkar and Armenio2005; Atoufi et al. Reference Atoufi, Scott and Waite2020).
Mean temperature is roughly constant when temperature is passive as in L0 (figure 1c). For L1 and L2, temperature contributes to the boundary layer dynamics as an active scalar. For both L1 and L2, a strong capping inversion can be seen near the upper boundary of the channel. The vertical gradient of temperature near the bottom wall, in the region  $0.05 \lesssim z/h \lesssim 0.2$ increases as
 $Ri_\tau$ increases.
The velocity variances  $\overline {u'u'}$,
 $\overline {v'v'}$ and
 $\overline {w'w'}$ for L0, L1 and L2 at stationarity are shown in figure 1(d–f), respectively. In the near-wall region, these profiles are consistent with our earlier observation that, at stationarity, near-wall turbulence is governed mostly by wall-generated mean shear, and stratification plays a relatively minor role. The minimal effect of SS in the near-wall region at stationarity can be observed in figure 1(d,f) where we compared profiles of
 $\overline {u'^2}$ and
 $\overline {w'^2}$ with similar profiles from García-Villalba & Álamo (Reference García-Villalba and del Álamo2011) in a closed channel with a different thermal boundary condition (fixed temperature at both walls) and different
 $Ri_\tau$ (
 $Ri_\tau =980$). Despite these differences in
 $Ri_\tau$ and the choice of thermal boundary condition, profiles show similar behaviour in the near-wall region and the dissimilarities become noticeable only in the OUL. The higher values for
 $\overline {u'u'}$ for L2 in the near-wall region where
 $z/h \lesssim 0.15$ (figure 1d) in comparison with cases L0 and L1 are due to spanwise patchiness of the flow rather than more intensive streamwise fluctuations (streaks) in the turbulent strips. The upper LGL in L2 is extended to
 $z/h \approx 0.4$ due to extensive boundary near-wall region growth and shrinkage of the OUL part in L2 (figure 3 side contour plots) relative to L0 and L1. The profiles of
 $\overline {v'v'}$ and
 $\overline {w'w'}$ in L2 closely follow L1 in the OUL, where differences become more prominent between L0 and L2.
Stratified turbulence in the OUL is affected by the choice of upper boundary condition. This effect can be understood by comparing wall-normal velocity fluctuations in L0–L2 and closed-channel flow simulations of García-Villalba & Álamo (Reference García-Villalba and del Álamo2011). While free-slip boundary conditions in open-channel flow simulation prevent wall-normal velocity fluctuations with insignificant influence on the streamwise velocity fluctuations (figure 1d), in the closed-channel vertical velocity, fluctuations in  $z/h \gtrsim 0.8$ can have values as large as 50 % of the maximum across the channel. In a closed channel, these wall-normal velocity fluctuations maintain downward momentum flux from upper boundary layer and mixing in
 $z/h \gtrsim 0.8$. In an open channel, however, the impermeability condition at the top boundary prevents vertical momentum flux, which limits the overturning of OUL motions and thus limits vertical mixing.
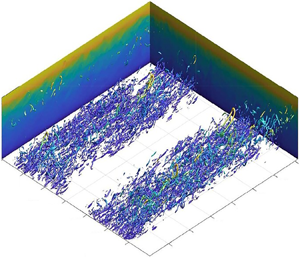
The near-wall streaks spread spanwise direction in L0 and L1 and become patchy in L2, as shown in figure 2. The near-wall vortical structures are dominated by quasi-streamwise vortical structures rather than hairpin-like structures, as shown in figure 3 for L2 in the region where  $6{\rm \pi} \leq x/h \leq 8{\rm \pi}$ and
 $0 \leq y/h \leq 2{\rm \pi}$. Consistent with our previous observations, in which a smaller domain with spanwise domain of size
 ${\rm \pi}$ has one turbulent strip (Atoufi et al. Reference Atoufi, Scott and Waite2019), the full spanwise length has 6 strips, suggesting that spanwise intermittency has a repeating pattern in the spanwise direction at each
 ${\rm \pi}$ (figure 2c).
Streamwise velocity fluctuations ( $u'^+$) at
 $z^+=15$ for (a) L0, (b) L1 and (c) L2.

Isosurfaces of Q-criterion (second invariant of gradient tensor of fluctuating velocities) for L2 in the region where  $6{\rm \pi} \leq x/h \leq 8{\rm \pi}$ and
 $0 \leq y/h \leq 2{\rm \pi}$, which are coloured by distance from the wall. In the cross-sectional slices, the kinetic energy in the streamwise and spanwise planes is shown. The Q-criterion and total kinetic energy are normalized using their maximum values. The isosurfaces are plotted at the level of 0.01. The colour bar illustrates values of normalized (by the maximum value) total kinetic energy.

4.2. Hierarchy of flow structures
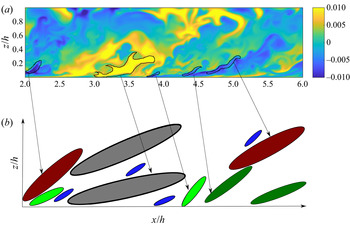
By looking at the energy cascade as a function of specific vertical length scales that are linked to known boundary layer processes, one may have a better understanding of the impact of stable stratification on the energy cascade dynamics. These specific length scales are denoted by  $r_z$, and in an energy cascade of wall turbulence can be categorized into four levels. As shown in figure 4(b), the structures in the flow field can be categorized into a hierarchy of discrete bands of
 $r_z$. The first level of the hierarchy is composed of structures with vertical sizes comparable to the height of the VSL, where
 $r_z^+=3$. The second level of the hierarchy is composed of flow structures with
 $r_z^+=15$ to account for BFL sized structures. Therefore, flow structures that are attached to the wall and belong to the second level of the hierarchy might form the BFL. On the other hand, the flow structures that belong to these first two levels and are detached from the wall are small enough to be affected by viscosity and may be involved in viscous effects further away from the wall. The third level of hierarchy is for structures of a size comparable to the height of LGL where
 $r_z^+=0.14Re_\tau =80$. Finally, the fourth level of hierarchy is composed of the flow structure of the size of the OUL where
 $r_z^+=0.75Re_\tau =420$. We will come back to the choice of hierarchy of vertical scales in more detail in § 4.4.
(a) A vertical slice of instantaneous temperature at  $tu_\tau ^0/h=13$. (b) Schematic of classifying flow into groups of structures with different vertical scales
 $r_z$. Blues have the smallest viscosity affected vertical scales. Light greens are structures of a size comparable to the height of the VSL (
 $r_z^+=3$). Dark greens, red and grey structures represent those with the size of BFL (
 $r_z^+=15$), LGL (
 $r_z^+=80$) and OUL (
 $r_z^5=420$), respectively. The schematic structures in (b) are not scaled representations of those appearing in (a). Smaller structures are actually much smaller than the larger structures shown in (b).

4.3. Kinetic energy
Let us now discuss kinetic energy, which allows us to include the effects of all horizontal modes in the kinetic energy cascade. Before we proceed, it is worth recalling that  $\text {ED}(\boldsymbol {k},r_z,z)$ represents energy density for a vertical scale
 $r_z$ and horizontal wavenumber vector
 $\boldsymbol {k}$. As we will see, the energy density in small
 $r_z$ tends to be large, even though the kinetic energy integrated over small scales is relatively small. As a result, we will consider
 $r_z \text {ED}$ rather than
 $\text {ED}$, and similarly for terms in the budget, since it gives the energy per octave (or decade) of vertical scale (Hamba Reference Hamba2018). Analogously, we premultiply spectra by horizontal wavenumbers, as is common (Jiménez Reference Jiménez2012; Jiménez Reference Jiménez2013; Cho et al. Reference Cho, Hwang and Choi2018; Atoufi et al. Reference Atoufi, Scott and Waite2020).
4.4. Energy cascade from the perspective of full band of vertical scales
In this section we investigate the full range of values of  $r_z$ in the energy density and its budget, before discussing the four representative values in the rest of the manuscript. In this section we consider a smaller domain case C5DC with
 $L_x/h=2{\rm \pi}$,
 $L_y/h={\rm \pi}$ and the same parameters as L1 (table 1) because calculations associated with the full range of values of
 $r_z$ are very expensive on large domains. It was shown in Atoufi et al. (Reference Atoufi, Scott and Waite2020) that the domain size used in C5DC is large enough to capture all essential dominant energy-containing scales of a strongly stable case with similar
 $Ri_\tau$ as in L1. Since the range of vertical scales present in all cases is
 $0 \le r_z/h \le 1$ and the domains in C5DC and L1 have the same height, the small domain simulation can inform us about different mechanisms in the energy cascade with respect to a full range of
 $r_z$ values. Particularly, from the information provided by the full band of
 $r_z$ in the domain size associated with C5DC, one can identify range of
 $r_z$ that makes the dominant contribution to the energy density and different terms in its budget in (2.18).
The dependence of  $\text {ED}$ on the full range of
 $r_z$ at different heights is shown in figure 5 for C5DC. The range of
 $r_z$ values
 $8 \le r_z^+ \le 20$ corresponds to dominant energy-containing vertical scales which are located in the BFL (figure 5a). Thus, the
 $r_z^+ \approx 15$ can properly approximate the dominant energy-containing vertical scale. The dominant
 $r_z$ becomes smaller moving upward from the VSL to the OUL in figure 5(a). In the BFL, where
 $5 \lesssim z^+ \lesssim 30$, the spectrum is concentrated around the line shown in figure 5(a). The peak in the premultiplied energy density takes place at slightly smaller
 $r_z$ as the wall distance increases. Except for the OUL, all of these peaks correspond to BFL size
 $r_z$.
Premultiplied energy density ( $r_z \sum _{\boldsymbol {k}}\text {ED}$) in C5DC for (a) different
 $r_z$, summed over all
 $\lambda _x$ and
 $\lambda _y$ at different heights and (b) premultiplied energy density at vertical locations in VSL, BFL, LGL and OUL for all vertical scales. The blue dashed dotted line in (a) shows the line
 $2.4 + 0.2 \ln {r_z^+}$.

Although we assumed a hierarchy of vertical scales in our analysis, the choice of this hierarchy needs more discussion. To do so, one can employ (2.19) and figure 5(b). The choice of  $r_z^+=3$,
 $r_z^+=15$,
 $r_z^+=80$ and
 $r_z^+=420$ serves as representative values for the different regions (I, II, III, IV) in figure 5(b). In region I:
 $r_z^+ \in [0,5)$, II:
 $r_z^+ \in [5,30)$, IV:
 $r_z^+ \in [30,100)$ and in IV:
 $r_z^+ \in [100,Re_\tau ]$. Except for the OUL (5b), the BFL size
 $r_z$ with
 $8 \lesssim r_z^+ \lesssim 20$ is the most energetic vertical scale. In the VSL,
 $r_z \approx 15$ are dominant vertical scales whereas in the BFL and LGL
 $r_z^+ \approx 8$ and
 $r_z^+ \approx 10$, are the dominant vertical scales, respectively. In the OUL, very small
 $r_z$ of a size comparable to the height of the VSL are dominant. The energy density is less skewed toward large vertical scales by increasing
 $z^+$ as can be seen in figure 5(b). This finding, along with our conclusion from figure 7 in which dominant energy-containing
 $\lambda _x$ become larger as
 $r_z$ increases, suggests that energy-containing structures become elongated but thinner moving upward. This finding suggests an explanation for the appearance of thin, layered, pancake-like structure in the outer-layer part of a strongly stably stratified open-channel flow (Atoufi et al. Reference Atoufi, Scott and Waite2019).
4.5. Energy cascade from the perspective of hierarchy of vertical scales
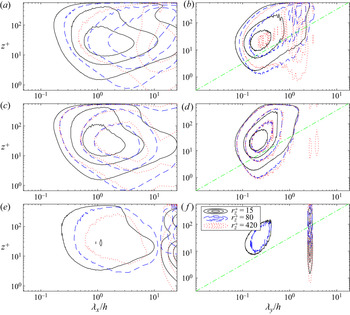
Figure 6 shows the dependence of  $\text {ED}$ upon horizontal and vertical scales and also how the energy distribution is changed by stratification. We first discuss the dependence of energy density upon streamwise scales
 $\lambda _x$ and height for different
 $r_z$ and stratifications. To do so,
 $\text {ED}$ (2.14) is summed over
 $\lambda _y$ and contour plots of the result are shown in figure 6(a,c,e) which correspond to L0, L1 and L2, respectively. In L0 and L1,
 $\text {ED}$ is concentrated at larger
 $\lambda _x$ as
 $r_z$ increases (figure 6a,c). Moreover, by comparing figure 6(a,c) for
 $r_z^+=15$, one can say that the
 $\lambda _x$ spectrum gets narrower by increasing the stability of the boundary layer (increasing
 $Ri_\tau$). For example, the contour lines in L0 for
 $r_z^+=15$, which contain less than 0.15 of the
 $\text {ED}$ maximum, do not become closed for
 $\lambda _x \simeq L_x$. In L1 (for
 $r_z^+=15$), contour lines referring to 0.15 of
 $\text {ED}$ maximum become closed for
 $\lambda _x \simeq L_x$. In L2, the most energetic streamwise scales (
 $\lambda _x/h \sim 1$) are suppressed and the largest
 $\lambda _x$ become more active compared with L1
Premultiplied energy density ( $\text {ED}$) for (a,c,e) streamwise (
 $r_z k_x \sum _{k_y}{\text {ED}}$) and (b,d,f) spanwise (
 $r_z k_y \sum _{k_x}{\text {ED}}$) wavelengths. Panels (a,b), (c,d) and (e,f) respectively refer to L0, L1 and L2. Contours are plotted at 0.15, 0.45 and 0.75 of the maxima of corresponding spectra. The dashed-dotted green straight line in log–log plots in (b,d,f) shows the power-law relation between non-dimensional spanwise wavelengths and height as
 $\log \lambda _y=1.3+\log z$.

In L0, for  $r_z$ the size of the LGL with
 $r_z^+=80$ (figure 6a), the largest
 $\text {ED}$ belongs to large structures with size in the range
 $\lambda _x/h$ from 3 to 10, consistent with García-Villalba & Álamo (Reference García-Villalba and del Álamo2011). These structures reside in the BFL and extend into the OUL, showing that structures with this vertical scale link viscous regions to the OUL. Thus, the third level of hierarchy bridges energy-containing scales of the size
 $\lambda _x/h \sim 1$ in the BFL to less energetic scales of the size
 $\lambda _x/h \sim L_x/h$ in the OUL. In contrast, such a link between streamwise scales in the inner and OULs by vertical structures of the size as the height of LGL (figure 6(a), inclined dashed blue contour lines) is suppressed in stratified cases L1 and L2 (figure 6d,f). In L2,
 $\text {ED}$ resides mostly in the largest
 $\lambda _x$ of the size of
 $L_x$. Moreover, in the most stratified case L2, the structures with a vertical size of
 $r_z^+=80$ do not reach the wall.
Now we discuss the dependence of energy density upon spanwise scales  $\lambda _y$ and height for different
 $r_z$ and different simulations. To do so,
 $\text {ED}$ is summed over
 $\lambda _x$, and contour plots of results are shown in figure 6(b,d,f) which correspond to L0, L1 and L2, respectively. The energy-containing spanwise scales are smaller than the energy-containing streamwise scales for all
 $r_z$. The dependence of energy-containing
 $\lambda _y$ upon
 $r_z$ is much weaker than streamwise scales. The energy density spectrum as a function of
 $\lambda _y$ and height concentrates approximately around the line
 $\lambda _y \sim z$ in the logarithmic region. The approximately linear dependence of
 $\lambda _y$ on the distance from the wall signifies the role of the LGL in the formation of the attached eddies (Cho et al. Reference Cho, Hwang and Choi2018; Hwang & Bengana Reference Hwang and Bengana2016). The symmetry of spanwise scales around the line
 $\lambda _y \sim z$ is preserved for all energetic
 $r_z$, suggesting that energy-containing spanwise scales in the LGL are linearly dependent upon the distance from the wall. The similarity in behaviour of energy-containing spanwise scales upon height also suggests there is a self-similar process affecting all spanwise scales (i.e. self-sustaining process). All of the
 $r_z$ scales are most energetic at
 $z^+ \approx 15$.
In L2, there is a narrow band in which the size of energetic spanwise scales is almost constant with respect to height and for all  $r_z$. This
 $\lambda _y/h \approx 3$ (
 $\lambda _y^+ \approx 1700$) associated with this band contains one turbulent strip and one quiescent region (figure 3). Since there are six strips, the wavelength is
 $\lambda _y=L_y/6$ and therefore
 $\lambda _y/h={\rm \pi} \approx 3$ corresponds to the wavelength of the strip. Moreover, energetic spanwise scales
 $\lambda _y/h \sim 0.2$ at
 $z^+ \in [10 - 100]$ for L2 are dominated by
 $r_z$ of the size of the BFL and LGL height. These energetic scales are responsible for sustaining turbulence in the active regions (turbulent strips). The footprint of the OUL size structures in the BFL is not observed in L2 for energy-containing spanwise scales. The presence of turbulent strips in the near-wall region without a footprint of
 $r_z^+=420$ sized structures suggests that near-wall turbulence in an SBL can be autonomously sustained even without interacting with OUL sized structures with vertical size comparable to
 $h$, similar to unstratified cases (Jiménez & Pinelli Reference Jiménez and Pinelli1999).
The magnitude of premultiplied  $\text {ED}$ for all levels in the hierarchy is shown in figure 7 for a single stratification, L1. This case is chosen since stratification effects on turbulence are shown to be strong earlier in the surface cooling process (Atoufi et al. Reference Atoufi, Scott and Waite2019, Reference Atoufi, Scott and Waite2020). For this case, once turbulence acquires stationarity, spanwise homogeneity of turbulence is maintained. As shown,
 $r_z^+=15$ is the most energetic vertical scale among the
 $r_z$ discussed here, which corresponds to structures of vertical size comparable to the height of the BFL. The second, third and fourth largest
 $r_z\text {ED}$ correspond to
 $r_z^+=3$,
 $r_z^+=80$,
 $r_z^+=420$. Moreover the largest premultiplied
 $\text {ED}$ in the OUL is associated with the small viscous scales,
 $r_z^+=3$. As seen in figure 7(a,b), the energetic streamwise and spanwise scales are much larger than the Kolmogorov scales everywhere, suggesting that the Kolmogorov scales are smaller than the horizontal energy-containing scales, even for the smallest vertical scales of the size comparable to the height of VSL with
 $r_z^+=3$.
Premultiplied energy density for (a,c,e,g) streamwise ( $r_z k_x \sum _{k_y}{\text {ED}}$) and (b,d,f,h) spanwise (
 $r_z k_y \sum _{k_x}{\text {ED}}$) wavelengths for L1. Panels (a,b), (c,d), (e,f) and (g,h) respectively refer to
 $r_z^+=3$,
 $r_z^+=15$,
 $r_z^+=80$ and
 $r_z^+=420$. The dashed-dotted yellow line in (a,b) is the profile of
 $30 \eta (z)/h$ where
 $\eta =(\nu ^3/\epsilon )^{(1/4)}$ refer to Kolmogorov scales.

4.6. Nonlinear energy transfer
In this section, the nonlinear transfer of  $\text {ED}$ is discussed. We start by analysing the dependence of
 $\text {TR}$ on
 $r_z$ only by summing
 $\text {TR}$ over all
 $\lambda _x$ and
 $\lambda _y$, as shown in figure 8. We also include the conventional horizontally averaged turbulence transport
 $T$ in the TKE budget (Garg et al. Reference Garg, Ferziger, Monismith and Koseff2000; Armenio & Sarkar Reference Armenio and Sarkar2002; Taylor et al. Reference Taylor, Sarkar and Armenio2005; Huang & Bou-Zeid Reference Huang and Bou-Zeid2013; Flores & Riley Reference Flores and Riley2018; Atoufi et al. Reference Atoufi, Scott and Waite2019, Reference Atoufi, Scott and Waite2020) to show how closely
 $\text {TR}$ at each
 $r_z$ follows
 $T$.
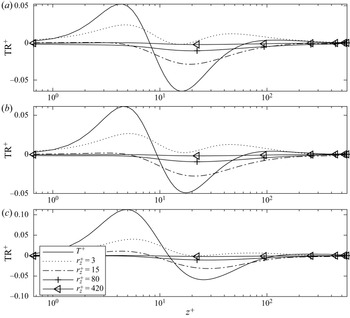
Premultiplied nonlinear transfer ( $r_z \sum _{\boldsymbol {k}}\text {TR}$) for different
 $r_z$, summed over all
 $\lambda _x$ and
 $\lambda _y$, for (a) L0, (b) L1 and (c) L2. Here,
 $r_z=0$ refers to horizontally averaged TKE transport and
 $T^+$ refers to turbulence transport in horizontally averaged TKE budget normalized by
 $Re_\tau$ (Atoufi et al. Reference Atoufi, Scott and Waite2019, Reference Atoufi, Scott and Waite2020).

The value of  $\text {TR}$ summed over all horizontal wavelengths is much smaller for large vertical scales
 $r_z^+=420$ and
 $r_z^+=80$ than small vertical scales
 $r_z^+=15$ and
 $r_z^+=3$ across the channel height. The
 $\text {TR}$ term for
 $r_z^+=15$ is positive in the VSL and negative everywhere else, while
 $\text {TR}$ for
 $r_z^+=3$ is positive across the channel height. For a particular
 $r_z$ and
 $z$, the sign of
 $\text {TR}$ summed over all horizontal wavelengths indicates whether energy density is transferred out of (negative) or into (positive) that particular
 $z$. By comparing the profile for the dominant
 $r_z$ with the TKE transport term
 $T$ one may acquire further insight into the transport of ED for the dominant
 $r_z$ toward or away from the wall. In the near-wall region, the positive and negative transfers are consistent with ejections and sweeps, respectively. By comparing profiles of premultiplied
 $\text {TR}$ (summed over horizontal wavenumbers) for different
 $r_z$ with the TKE transport term
 $T$ (Atoufi et al. Reference Atoufi, Scott and Waite2020), it is clear that ejections in the lower part of VSL are controlled by eddies with a vertical size comparable to the height of the VSL for the different stratifications considered here. Thus, motions of larger eddies of the size of the buffer, logarithmic and OULs do not contribute to transport in the VSL. However, in the BFL and above, all
 $r_z$ contribute to
 $\text {TR}$.
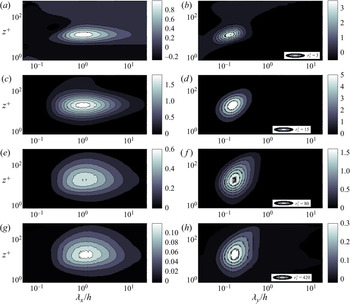
The premultiplied spectra of  $\text {TR}$ are shown in figure 9 for L1. We first discuss the dependence of
 $\text {TR}$ upon
 $\lambda _x$ and
 $r_z$ as shown in figure 9(a,c,e,g). The small streamwise scales with
 $\lambda _x/h \sim 0.2$ contribute to the largest positive values of premultiplied
 $\text {TR}$ for
 $r_z^+=3$ and 15. The vertical scales with
 $r_z^+=3$ contribute more to positive
 $\text {TR}$, as also shown in figure 8. In the VSL and lower BFL, the streamwise scales
 $\lambda _x/h$ from
 $0.2$ to
 $3$ are dominant in positive
 $\text {TR}$ (figure 9a). In the BFL and aloft, the negative
 $\text {TR}$ is associated with
 $1 \lesssim \lambda _x/h \lesssim 10$ (figure 9a,c,e,g).
Premultiplied nonlinear transfer of energy density ( $\text {TR}$) for (a,c,e,g) streamwise (
 $r_z k_x \sum _{k_y}{\text {TR}}$) and (b,d,f,h) spanwise (
 $r_z k_y \sum _{k_x}{\text {TR}}$) wavelengths for L1. Panels (a,b), (c,d), (e,f) and (g,h) respectively refer to
 $r_z^+=3$,
 $r_z^+=15$,
 $r_z^+=80$ and
 $r_z^+=420$.

Insights from nonlinear transfer for different vertical scales may improve our understanding of the inner and OUL interactions. Figure 9(a,c) suggests that, for  $r_z^+=3$ and
 $r_z^+=15$ in the VSL and lower part of BFL,
 $\text {ED}$ transfers into small streamwise scales (
 $\lambda _x/h < 1$) and out of larger streamwise scales (
 $\lambda _x/h > 1$) at the same height and aloft as shown in figure 9(a,c). For a given
 $r_z$, this energy transfer occurs from vertical scales greater than or equal to
 $r_z^+=80$, since for
 $r_z^+=420$ the transfer is mostly negative (figure 8b). For
 $r_z^+=80$ and
 $r_z^+=420$ (figure 9e,g)
 $\text {TR}$ is primarily negative and thus
 $\text {TR}$ mostly transfers out of such
 $r_z$. Also, for
 $r_z^+=420$ the
 $\text {ED}$ at
 $\lambda _x/h \lesssim 1$ is positive, which shows such large
 $r_z$ contributes to transferring energy into
 $\lambda _x/h \lesssim 1$ wavelengths in the upper VSL. The large streamwise scales with
 $\lambda _x \sim L_x$ for OUL size vertical scales (
 $r_z^+=420$, figure 9g) contribute slightly to positive transfer, which penetrates down to the VSL. Large vertical scales with
 $r_z^+=420$ are tall enough (
 $r_z=0.75h$) to influence the whole boundary layer, so they can contribute to the positive transfer of
 $\text {ED}$ for the largest streamwise scales in the VSL. The negative transfer is more pronounced for
 $\lambda _x/h \sim 3$ regardless of
 $r_z$ (and also stratification; not shown).
Now we discuss the dependence of  $\text {TR}$ upon
 $\lambda _y$ and
 $r_z$, as shown in figure 9(b,d,f,h). Generally, transfer takes place at spanwise scales that are an order of magnitude smaller than streamwise scales, consistent with studies of unstratified channel flows (Cho et al. Reference Cho, Hwang and Choi2018). However, the maximum absolute values of transfer rate by spanwise scales are larger than those in streamwise scales. The largest values of positive and negative premultiplied
 $\text {TR}$ are due to
 $r_z^+=3$ and
 $r_z^+=15$ respectively. Similar to the
 $\text {ED}$ spectra in figure 7,
 $\text {TR}$ concentrates around a line
 $\lambda _y \sim z$ in the logarithmic region for
 $r_z^+ > 3$, which strongly suggests that the LGL consists of self-similar attached eddies (Hwang Reference Hwang2015). For
 $r_z^+=3$ (figure 9b) the VSL and lower BFL contain small spanwise scales with
 $\lambda _y/h \sim 0.2$ that contribute to largest positive
 $\text {TR}$. For
 $r_z^+=3$, the upper BFL and lower LGL contains negative transfer. Thus for
 $r_z^+=3$, the
 $\text {ED}$ is transferred into
 $\lambda _y/h \sim 0.2$ in the upper VSL and lower BFL and out of slightly smaller scales in upper BFL and lower LGL. For
 $r_z^+>3$ in figure 9(d,f,h) the
 $\text {ED}$ is mostly transferred out of small spanwise scales with
 $\lambda _y/h \sim 0.2$ in the BFL and
 $\lambda _y \sim z$ in the LGL to other
 $\lambda _y$. For
 $r_z^+=80$ and
 $420$,
 $\text {ED}$ is transferred from
 $\lambda _y/h \lesssim 0.2$ even in the VSL. The nonlinear transfer for
 $r_z^+ > 3$ is dominated by in-plane triad interactions (not shown for brevity).
4.7. Turbulence production
In this section, the production of  $\text {ED}$ is discussed. The spectra of turbulence production (
 $\text {SP}$) are shown in figure 10 for all simulations. The dependences of
 $\text {SP}$ on streamwise scales, vertical scales, distance from the wall and stratification are shown in figure 10(a,c,e). The
 $\lambda _x$ scales of the size of the channel height (
 $\lambda _x/h \approx 1$) centred at the BFL are the most productive scales for premultiplied
 $\text {ED}$. In L0 and L1, the less energetic streamwise scales carrying at least 0.1 of
 $\text {SP}$ maxima become smaller with increasing
 $Ri_\tau$. By comparing figure 10(a,c,e) and figure 6, one can say that less energetic structures in the OUL of vertical size
 $r_z^+=80$ and
 $r_z^+=420$ are large with
 $\lambda _x/h \ge 10$ and penetrate the buffer region, suggesting they are inactive eddies as they only slightly contribute to production.
Premultiplied shear production ( $\text {SP}$) for (a,c,e) streamwise (
 $r_z k_x \sum _{k_y}{\text {SP}}$) and (b,d,f) spanwise (
 $r_z k_y \sum _{k_x}{\text {SP}}$) wavelengths. Panels (a,b), (c,d) and (e,f) respectively refers to L0, L1 and L2. Contours are plotted at 0.15, 0.45 and 0.75 of the maxima of corresponding spectra.

The dependence of  $\text {SP}$ on spanwise scales is shown in figure 10(b,d,f). The most productive spanwise scales for premultiplied
 $\text {ED}$ in the BFL are of the size
 $\lambda _y/h \simeq 0.2$ (
 $\lambda _y ^ + \simeq 100$) for all
 $r_z$ and regardless of stratification. The scale
 $\lambda _y ^ + \simeq 100$ is consistent with near-wall streak spacing for unstratified channels (Jiménez & Moin Reference Jiménez and Moin1991) and thus shows turbulence production in the near-wall region is strongly linked to near-wall streaks. Turbulence producing spanwise scales with vertical size of the logarithmic and OULs are similar when
 $\text {SP}$ is normalized using corresponding maximum values. Thus, turbulence producing spanwise scales with the vertical size of the logarithmic and OULs are similar and SS is in favour of making this coupling even stronger, so that contour lines in figure 10(d) for
 $r_z^+=80$ follow those for
 $r_z^+=420$ even more closely than in figure 10(b). In L2,
 $\lambda _y/h \approx 3$ are spanwise scales containing an active region next to a quiescent region at which production is slightly negative. The similarity between turbulence producing spanwise scales (
 $\lambda _y$ in the
 $\text {SP}$) in L0, L1 and L2 can be seen in figure 10(b,d,f). Figure 10(f) shows that, in L2, the widest turbulence producing structure (active region) is of spanwise size comparable to
 $h$. The presence of
 $\text {SP}$ at
 $\lambda _y/h \approx 3$ in L2 explains why strips appear with a width comparable to
 $3h$.
The magnitude of  $\text {SP}$ for all levels in the hierarchy is shown in figure 11 for a single stratification, L1. Turbulence production takes place at all
 $r_z$. The vertical scale
 $r_z^+=15$ (figure 11c) contributes to the premultiplied
 $\text {SP}$ maximum, and the maximum premultiplied
 $\text {SP}$ occurs in the BFL for all
 $r_z$ considered here for L1. The vertical scale with
 $r_z^+=3$ (figure 11a),
 $r_z^+=80$ (figure 11e) and
 $r_z^+=420$ (figure 11g) contain other relatively large productions for streamwise scales. The largest value of
 $\text {SP}$ associated with
 $\lambda _y$ is three times larger (figure 11b,d,f,h) than the largest production associated with
 $\lambda _x$ for all
 $r_z$ (and also stratification regimes). In fully developed cases (L0 and L1) and also in the active regions of L2 (results for L0 and L2 are not shown here),
 $\text {SP}$ in the BFL for horizontal and vertical scales shows a sustained kinetic energy injection associated with mean shear into all streamwise scales, all vertical scales and spanwise scales between 0.1 and 1. This finding is consistent with a scale-by-scale budget of the structure function in Casciola et al. (Reference Casciola, Gualtieri, Benzi and Piva2003) for unstratified shear layer turbulence.
Premultiplied shear production ( $\text {SP}$) for (a,c,e,g) streamwise (
 $r_z k_x \sum _{k_y}{\text {SP}}$) and (b,d,f,h) spanwise (
 $r_z k_y \sum _{k_x}{\text {SP}}$) wavelengths for L1. Panels (a,b), (c,d), (e,f) and (g,h) respectively refer to
 $r_z^+=3$,
 $r_z^+=15$,
 $r_z^+=80$ and
 $r_z^+=420$.

4.8. Viscous effects
The premultiplied  $\text {VD}$ spectra are shown in figure 12 for L1. Generally, the vertical scale
 $r_z^+=3$ contains the maximum absolute values of viscous effects (premultiplied
 $\text {VD}$) among the
 $r_z$ considered here. The dependence of
 $\text {VD}$ on
 $\lambda _x$ and
 $r_z$ are shown in figure 12(a,c,e,g). The magnitude of the viscous term decreases with increasing vertical scale. The large values of
 $\text {VD}$ (magnitude greater than 0.1) are negative in the near-wall region for
 $r_z^+=3$ and
 $r_z^+=15$ (figure 12a,b). This negative
 $\text {VD}$ suggests that dissipation of
 $\text {ED}$ in the near-wall region is associated with small
 $r_z$, as expected. As opposed to production (
 $\text {SP}$), the spectral distribution of viscous effects among different streamwise scales is more sensitive to
 $r_z$. The
 $\text {VD}$ spectra for
 $r_z^+=3$ and
 $r_z^+=15$ are different than those with
 $r_z^+=80$ and
 $r_z^+=420$. Viscous effects take place at larger streamwise
 $\lambda _x$ as
 $r_z$ increases. Also, viscous effects spread out over a wider range of
 $\lambda _x$ as
 $r_z$ increases. The dependence of the viscous effects on spanwise scale are shown in figure 12(b,d,f,h). The most viscosity affected
 $\lambda _y$ is much smaller than the corresponding
 $\lambda _x$. For
 $r_z^+=3$ and
 $r_z^+=15$
 $\text {VD}$ is negative almost anywhere across channel height for all
 $\lambda _y$ whereas for
 $r_z^+=80$ and
 $r_z^+=420$ the
 $\text {VD}$ is positive, but small, in the VSL. By comparing both
 $\lambda _x$ and
 $\lambda _y$ contours, we see that the strongest viscous effects take place in the lower BFL. The viscous term
 $\text {VD}$ for both
 $\lambda _x$ and
 $\lambda _y$ are similar for
 $r_z$ of size comparable to the height of LGL and OUL.
Premultiplied viscous effects ( $\text {VD}$) for (a,c,e,g) streamwise (
 $r_z k_x \sum _{k_y}{\text {VD}}$) and (b,d,f,h) spanwise (
 $r_z k_y \sum _{k_x}{\text {VD}}$) wavelengths for L1. Panels (a,b), (c,d), (e,f) and (g,h) respectively refer to
 $r_z^+=3$,
 $r_z^+=15$,
 $r_z^+=80$ and
 $r_z^+=420$.

Viscous diffusion in the VSL is positive in the horizontally averaged TKE budget, as discussed in Atoufi et al. (Reference Atoufi, Scott and Waite2020). The  $\text {VD}$ summed over wavelengths is shown in figure 13. As can be seen, the
 $\text {VD}$ term corresponds to the summation of viscous dissipation and diffusion, which are total effects of viscosity in a horizontally averaged TKE budget. Thus, small positive
 $\text {VD}$ for
 $r_z^+=80$ and
 $r_z^+=420$ in the VSL is associated with viscous diffusion since dissipation is negative.
Premultiplied viscous term ( $r_z \sum _{\boldsymbol {k}}\text {VD}$) for different
 $r_z$, summed over all
 $\lambda _x$ and
 $\lambda _y$, for (a) L0, (b) L1 and (c) L2. The
 $\epsilon ^+$ and
 $D^+$ refers to turbulence dissipation and diffusion, respectively in horizontally averaged TKE budget normalized by
 $Re_\tau$ (Atoufi et al. Reference Atoufi, Scott and Waite2019, Reference Atoufi, Scott and Waite2020).

Note that positive values of  $\text {VD}$ come from inter-plane viscous effects since
 $\text {VD}_i$ is directly related to (
 $-\text {ED}$) which is negative ((2.27)). For
 $r_z$ of the size of the LGL and OUL,
 $\text {VD}$ becomes positive at small wavelengths, signifying dominance of inter-plane viscous effects at such scales. These positive
 $\text {VD}$ occur in the lower part of the VSL, suggesting that the role of such tall vertical structures is to actually intensify
 $\text {ED}$. This intensification of
 $\text {ED}$ in the lower part of the VSL takes place at
 $\lambda _x/h \approx 1$ and
 $\lambda _y/h \approx 0.2$, which correspond to the scales contributing to maximum
 $\text {SP}$. Thus, part of the
 $\text {ED}$ generation in the lower part of the VSL is a result of inter-plane viscous effects. We will discuss the importance of the positive
 $\text {VD}$ shortly. The magnitude of the
 $\text {VD}_i$ is much smaller than
 $\text {VD}$ at all scales (not shown for brevity) and therefore the
 $\text {VD}$ is primarily controlled by inter-plane viscous effects, and the role of in-plane viscous effects is secondary.
Now we discuss the importance of positive  $\text {VD}$. It has been discussed by Atoufi et al. (Reference Atoufi, Scott and Waite2020) that pressure work, similar to unstratified channel flows, is a crucial mechanism for transporting turbulence from the lower VSL, where the transport term in the horizontally averaged TKE budget is small. However, pressure work requires sustainable velocity fluctuation to actively transfer TKE to the upper VSL, where transfer terms can distribute TKE to the rest of the channel. An important question is which mechanism in the viscous region, where production is also small due to wall impermeability, can provide sustainable velocity fluctuations? As discussed, inter-plane viscous interactions among scales of the size of the LGL and OUL seem to be a plausible answer. The nonlinear transfer, production and buoyancy (will be discussed shortly) terms are small compared with viscous effects in the lower VSL, similar to unstratified channel flows (Jiménez Reference Jiménez1999; Bernardini, Pirozzoli & Orlandi Reference Bernardini, Pirozzoli and Orlandi2014; Atoufi et al. Reference Atoufi, Scott and Waite2020).
4.9. Buoyancy destruction
Buoyancy is not a dominant mechanism in the budget of horizontally averaged TKE for the SBL (Nicholl Reference Nicholl1970; Arya Reference Arya1975; Van Buren et al. Reference Van Buren, Williams and Smits2017; Shah & Bou-Zeid Reference Shah and Bou-Zeid2019; Atoufi et al. Reference Atoufi, Scott and Waite2020). Similarly, it is not a dominant mechanism in the budget of  $\text {ED}$. However, to identify the range of scales that are most affected by buoyancy, we discuss BD spectra in this section for L1.
The dependence of  $\text {BD}$ on
 $\lambda _x$ is shown in figure 14(a,c,e,g). The premultiplied
 $\text {BD}$ is concentrated in the LGL and is dominated by
 $r_z^+=15$. As
 $r_z$ increases,
 $\text {BD}$ effects extend deeper down in the boundary layer and involves larger
 $\lambda _x$. The range of buoyancy affected
 $\lambda _x/h$ extends from 0.1 to 10 for
 $r_z^+=15$. As
 $r_z^+$ increases to
 $420$, the range of buoyancy affected
 $\lambda _x/h$ extends from 1 to
 $L_x$. The dependence of
 $\text {BD}$ on
 $\lambda _y$ is shown in figure 14(b,d,f,h). The
 $\lambda _y$ spectra are narrower than the
 $\lambda _x$ spectra, similar to other terms in
 $\text {ED}$ budget discussed so far. As
 $r_z$ increases,
 $\text {BD}$ involves larger
 $\lambda _y$. The ranges of buoyancy affected
 $\lambda _y/h$ scales extend from
 $0.2$ to 1 for
 $r_z^+=15$ and from
 $0.2$ to 10 for
 $r_z^+=420$.
Premultiplied buoyancy term ( $\text {BD}$) for (a,c,e,g) streamwise (
 $r_z k_x \sum _{k_y}{\text {BD}}$) and (b,d,f,h) spanwise (
 $r_z k_y \sum _{k_x}{\text {BD}}$) wavelengths for L1. Panels (a,b), (c,d), (e,f) and (g,h) respectively refer to
 $r_z^+=3$,
 $r_z^+=15$,
 $r_z^+=80$ and
 $r_z^+=420$.

By comparing  $\text {BD}$ and
 $\text {SP}$ spectra for L1 (figures 14 and 11), one might say that the range of scales that is affected by buoyancy includes all scales that contribute to turbulence production. This range of buoyancy affected scales is expected since part of the kinetic energy injected by
 $\text {SP}$ is converted to potential energy by
 $\text {BD}$. But there are large scale
 $\lambda _x/h \sim L_x/h$ and
 $\lambda _y/h \gtrsim 1$ for all
 $r_z$ that contribute to
 $\text {BD}$ but not
 $\text {SP}$. Also, the maximum of
 $\text {BD}$ for streamwise scales is centred farther from the wall compared with
 $\text {SP}$.
Although buoyancy is not a dominant mechanism in the energy budget for reasons explained below, it imposes an additional restriction on the computational domain size. As can be seen in figure 14 for  $r_z^+=420$, buoyancy activates large spanwise scales that contribute to
 $\text {BD}$ more than for
 $\text {SP}$. The SS is in favour of suppressing large non-productive vertical scales by widening their corresponding spanwise
 $\lambda _y$ and elongating their
 $\lambda _x$ (figure 14).
5. Discussion
5.1. Balance among different mechanisms
From the results presented in analysing the budget of energy density, it was shown that the overall balance is between  $\text {SP}$,
 $\text {TR}$ and
 $\text {VD}$. The scale dependence of this balance will be discussed in this section. By comparing figures 9, 11 and 12, one can say that
 $\text {SP}$ correlates with negative
 $\text {TR}$ for all
 $r_z$. The net output of the production and nonlinear transfer approximately balances
 $\text {VD}$. Thus
 $\text {ED}$ generated by
 $\text {SP}$ at
 $\lambda _y/h \gtrsim 1$ is transferred by negative TR and dissipated by
 $\text {VD}$. The kinetic energy of vertical scales is mainly altered by three different mechanisms: (i) mean flow production (
 $\text {SP}$), (ii) draining energy from inter-scale interactions by in-plane triads (
 $\text {TR}_i$) and (iii) receiving energy from inter-scales by inter-plane interactions (
 $\text {TR}_o$). As stated, the viscous effect dissipates the net of energy production and transfer. Thus, due to small contribution of buoyancy destruction, the net of transport and production is approximately balanced by viscous effects, consistent with unstratified cases (Marati, Casciola & PIVA Reference Marati, Casciola and PIVA2004). Moreover, the positive
 $\text {TR}$ for
 $r_z^+=3$ and
 $r_z^+=15$ that can be seen at
 $\lambda _x /h < 1$ and
 $\lambda _y/h \sim 1$, are inactive in
 $\text {SP}$, which means at these scales
 $\text {TR}$ and
 $\text {VD}$ are directly connected.
Although  $\text {BD}$ affects all
 $\text {ED}$ producing scales (dominant range of scales in the production term), the centres of action for buoyancy (in LGL) and production (in BFL) are different. For both
 $\text {BD}$ and SP,
 $r_z^+=15$ is the dominant vertical scale. Thus,
 $\lambda _x$ and
 $\lambda _y$ for
 $r_z^+=15$ in the BFL (maximum SP; figure 10a,b) are not significantly affected by buoyancy destruction. The difference in the heights for the centre of action of buoyancy and shear production is a direct result of wall impermeability and the no-slip condition. The impermeability condition on the wall (and also on the top boundary) imposes that vertical fluctuations cannot occur in the viscous region or the OUL close to the top boundary. For a similar reason and also due to no-slip condition at wall, the maximum tangential Reynolds stress is not located in the viscous region. However, strong wall-generated shear with a maximum at the wall shifts the centre of action for shear production further down close to the wall. Starting from the decay phase (Gohari & Sarkar Reference Gohari and Sarkar2018; Atoufi et al. Reference Atoufi, Scott and Waite2019), the wall-generated shear becomes weaker as a result of SS and skin friction is reduced (Flores & Riley Reference Flores and Riley2011; Williams et al. Reference Williams, Hohman, Van Buren, Bou-Zeid and Smits2017; Atoufi et al. Reference Atoufi, Scott and Waite2019). Thus, the near-wall viscous region grows due to reduced mean shear. This growth of the near-wall viscous region shifts the centre of action for production.
It is worth emphasizing that the findings in this paper show that dominant  $r_z$ scales and wall distance are not in direct relation at all heights in both the stratified and unstratified cases. The direct and power relationships (straight line in log–log scale plots as shown in figure 5a) between the wall distance and energetic
 $r_z$ scales are only valid in the upper BFL and lower LGL. As figure 5 also suggests, in the upper LGL and in the OUL the dominant
 $r_z$ scales are small but large
 $r_z$ scales (although not dominantly energetic) have strong connection to the near-wall region as seen in figure 7(e–h).
6. Conclusions
In this paper, we studied the mechanisms that are involved in the kinetic energy cascade in a stably stratified open-channel flow using a mathematical framework introduced to analyse kinetic energy density in spectral-scale space. We categorized flow structures into a hierarchy with four different levels based on the vertical scales of the VSL, BFL, LGL and OUL.
We considered an unstratified case (L0) as well as two strongly stable cases (L1 and L2). For the case with the strongest stratification with the highest  $Ri_\tau$ (L2), the flow evolved into a state with alternating strips of turbulent and quiescent regions. For the unstratified case, for vertical scales of the size of LGL (
 $r_z^+=80$), which correspond to the third level in the hierarchy, the range of streamwise scales (
 $\lambda _x/h$) from 3 to 10 is most energetic. These energetic streamwise scales reside in the BFL and extend into the OUL, showing that the third level in the hierarchy of vertical scales links viscous regions to the OUL. Such link is suppressed in stratified cases. In L2, for which the flow becomes intermittent, the energy density in streamwise scales with
 $\lambda _x/h \approx 1$ is suppressed, and
 $\text {ED}$ is mainly found in the largest streamwise scales of size of
 $L_x$.
It was found that, in all cases considered in this work, energetic  $\lambda _x$ become larger as
 $r_z$ increases. The large
 $\lambda _x$ are reduced with increasing
 $Ri_\tau$ for all
 $r_z$ suggesting that stratification is in favour of shortening the streaks. Energetic spanwise scales are smaller than streamwise scales for all
 $r_z$ and the dependence of
 $\lambda _y$ spectra upon
 $r_z$ is much weaker compared with the
 $\lambda _x$ dependence upon
 $r_z$ regardless of
 $Ri_\tau$. The
 $\lambda _y \sim z$ relation for the energetic scales in the logarithmic region for all
 $r_z$ shows the self-similarity of eddies in the LGL. All of the
 $r_z$ scales are most energetic at
 $z^+ \approx 15$ for all
 $Ri_\tau$ considered here.
Nonlinear transfer for streamwise scales is dominated by in-plane triad interactions, and inter-plane interactions are more active in transferring energy density among spanwise scales. The most energy productive streamwise scales are of the size comparable to the channel height ( $\lambda _x/h \approx 1$) regardless of the given vertical scale and stratification (
 $Ri_\tau$), which are centred in the BFL. Turbulence production takes place at all vertical scales, which strongly supports the presence of a self-sustaining process at all vertical scales, consistent with Cossu & Hwang (Reference Cossu and Hwang2017).
Turbulence producing spanwise scales with vertical size comparable to the height of logarithmic layer ( $r_z^+=80$) and OUL (
 $r_z^+=420$) are similar. The
 $\lambda _y/h \sim 1$ wavelengths contributes slightly to the turbulence production with comparatively low values of premultiplied
 $\text {SP}$ (in all cases) suggesting that turbulent strips appear with width comparable to
 $h$ in L2.
The range of scales that are affected by buoyancy includes all energy producing scales. However, there are  $\lambda _x/h \sim L_x$ and
 $\lambda _y/h \gtrsim 1$ for all
 $r_z$ (buoyancy dominated scales) that are active in buoyancy destruction (
 $\text {BD}$) and are inactive in production (
 $\text {SP}$). These scales that are activated as a result of buoyancy destruction impose extra demands for a larger computational domain size to simulate strongly stable stratified boundary layers.
In this work we only considered four different vertical scales to simplify the analysis of the kinetic energy cascade due to the significant computational expense that would be required to consider the full range of vertical scales for large domain simulations. An important unanswered question in our work, which requires study of the full range of vertical scales, is how the near-wall inverse cascade is impacted by stratification. This will be addressed in the future. Moreover, the effects of higher  $Re_\tau$ on each of the energy cascade mechanisms is desirable to address in the future.
Funding
This research was enabled in part by support provided by the Shared Hierarchical Academic Research Computing Network (SHARCNET), Compute/Calcul Canada, the Natural Sciences and Engineering Research Council of Canada (K.A.S.: Grant No. RGPIN-418344-2012; and M.L.W.: Grant No. RGPIN-386456-2015) and the Canadian Foundation for Innovation.
Declaration of interests
The authors report no conflict of interest.