Menopause and menarche are important universal biological developmental markers indicating the end and beginning, respectively, of reproductive maturation in women. Early natural fertility loss/termination evolved in humans as a consequence of evolutionary changes that made late births increasingly risky (Williams, Reference Williams1957). He and Murabito (Reference He and Murabito2014) identified more than 30 novel gene loci for age at menarche and 17 for age at natural menopause. Women’s ovaries cease functioning at around the age of 50 years, but women live long and healthy lives for decades afterwards. This is an evolutionary puzzle, and although the ‘grandmother hypothesis’ has been forwarded as a possible explanation (Hawkes, Reference Hawkes2003; Pollycove et al., Reference Pollycove, Naftolin and Simon2011), the benefit of this is generally agreed not to be great enough to outweigh that of producing another child (Croft et al., Reference Croft, Brent, Lauren, Franks and Cant2015).
The symptoms of menopause are attributed to a decline in oestrogen production in the presence of a continued production of gonadotrophic hormones by the hypothalamus (Takahashi & Johnson, Reference Takahashi and Johnson2015). The menopause and associated ageing process influence various aspects of women’s health, resulting in bone loss, urogenital atrophy, urinary tract infections and incontinence, increased cardiovascular risk, sexual dysfunction and loss of skin elasticity (Budakoglu et al., Reference Budakoglu, Ozcan, Eroglu and Yanik2007; Chedraui et al., Reference Chedraui, Blumel, Baron, Belzares, Bencosme and Calle2008). The prevalence of these symptoms in populations varies by geographic region and ethnicity (Freeman & Sherif, Reference Freeman and Sherif2007). The biological and other changes associated with menopause are almost universal, but not all post-menopausal women are affected.
Attempts have been made to study the association between age at menopause and age at menarche (Forman et al., Reference Forman, Mangini, Thelus‐Jean and Hayward2013). Population studies have demonstrated an increased risk of earlier natural menopause among nulliparous versus parous women, and a trend towards a delay in menopause with increase in number of live births (Soberon et al., Reference Soberon, Calderon and Goldzieher1966; Jeune, Reference Jeune1986; Whelan et al., Reference Whelan, Sandler, McConnaughey and Weinberg1990; Meschia et al., Reference Meschia, Pansini, Modena, de Aloysio, Gambacciani and Parazzini2000; Ortiz et al., Reference Ortiz, Harlow, Sowers, Nan and Romaguera2006; Kaczmarek, Reference Kaczmarek2007). In view of the contradictory reports, there is a need to explore these associations in different populations of different nationalities in different cultural settings. The present study was undertaken on post-menopausal women from a rural population in Shimla in Himachal Pradesh to investigate: 1) their mean/median age at menopause; 2) the extent and pattern of various menopausal symptoms; 3) the association of the extent/severity of post-menopausal symptoms with mean age at menopause; and 4) the association of age of menopause with age at menarche and other reproductive parameters.
The study sample comprised 75 ever-married, post-menopausal women with a mean age of 52.15 years (SD 4.68). The women were from three villages around Shimla: Sangti, Neri and Chaeli. Since the study was done in small villages and all eligible females who agreed to participate were included in the study, no sampling procedures were required. Eligible women were interviewed to obtain a detailed reproductive history. This was later checked with their husbands and elderly members of the family. Questions were asked on the following key demographic characteristics: fertility, mortality, morbidity, marriage and menopause. Ages at menarche and menopause were determined by retrospective recall. Reported age at menarche suffered from recall bias due to the long recall interval. However, this bias applied to all study respondents, and so was random and not systematic. The inclusion criteria were that the women’s family were permanent residents of the village and that the respondent women were post-menopausal and ever-married. Households with a second, pre-menopausal wife and where no information was available on the first wife were excluded.
The extent of occurrence of menopausal symptoms was assessed using ten vasomotor, vaginal, psychosomatic, psychological and urinary symptoms. A Likert-type scale of responses was used to rate each symptom: none (0), mild (1), moderate (2) severe and very severe (4). To minimize errors of misunderstanding, face-to-face interviews were done rather than using a self-administered questionnaire. All questions were asked in Hindi language. The data were analysed using SPSS version 18. No distinction was made between the terms ‘prevalence’ and ‘incidence’ and these are used interchangeably in the study. The data were subjected to parametric and non-parametric statistical analyses to estimate means and medians, and the Mann–Whitney U-test, t-test, Pearson’s and Spearman’s correlations, partial correlation, ANOVA, multiple regression analysis and Varimax Rotation Factor analysis were performed.
No significant differences in mean and median ages of menarche and menopause were found between women in the age groups 40–55 and 56–65 years. This suggests that the two events were so significant for these women that there was no significant recall error. Their median ages of menarche and menopause were 14 years and 45 years, respectively.
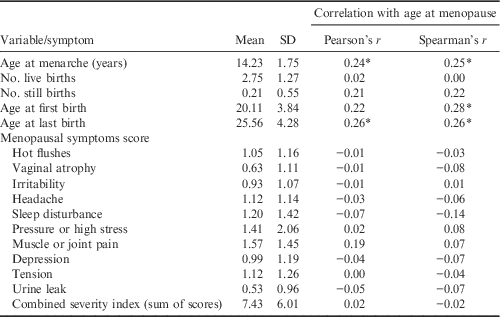
Table 1 shows that age at menarche and ages at birth of the first and last child (parity) were significantly correlated with age at menopause. Variations were observed in the reproductive span of women (subtracting age at menarche from age at natural menopause). Thomas et al. (Reference Thomas, Renaud, Benefice, de Meeus and Guegan2001) described an increase in the average number of reproductive years in US women over time in the twentieth century, from 36.1 years for those born between 1915 and 1919 to 37.7 years among the 1935–1939 cohort (p≤0.0001). The mean natural reproductive life span of the women was similar to that of women in other Indian studies, but lower than that of European countries. There is a need to further explore whether shorter reproductive span has something to do with early age at marriage and/or ages at births of the first and last child, because a significant correlation of these traits with age at menopause was observed in the present study. It was also noted that the number of live births was significantly positively correlated with age at menarche and negatively correlated with age at birth of first child.
Correlation of age at menopause with age at menarche, reproductive variables and severity score of menopause symptoms

*Significant at p<0.05 level (two-tailed)
In view of the significant correlations between age at menopause and various other reproductive traits, multiple regression analysis was performed with age at menopause as the dependent variable. The results were statistically insignificant (p>0.05), indicating that the reproductive variables considered were not necessarily biological determinants of age at menopause.
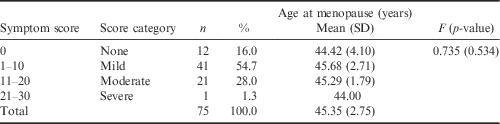
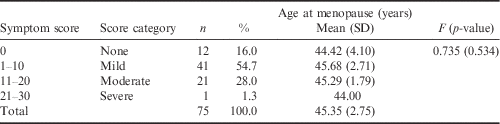
No signification correlations were found between age at menopause and menopausal symptom rating scores (Table 1). Further analysis was done to see whether the severity of menopausal symptoms was associated with age at menopause (Table 2). The results clearly show that age at menopause and the extent of menopause symptoms have no association. The majority of the study women (70.7%) had no or only very mild menopausal symptoms.
Cumulative frequency distribution of menopause symptom scores and age at menopause
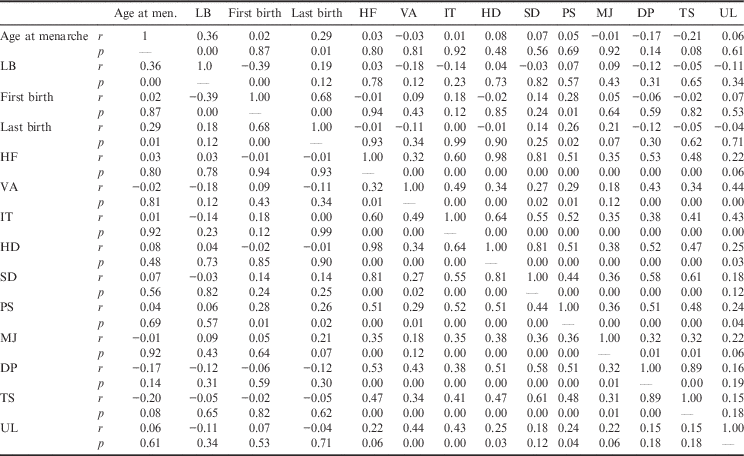
Partial correlation measures the strength and direction of a linear relationship between two continuous variables while controlling for the effect of other variable(s). First-order partial correlation analysis was performed keeping one variable (age at menopause) constant. This tool was used because age at menopause was found to be significantly correlated with some reproductive variables. Age at menarche was found to be significantly correlated with number of live births (r=0.36, p<0.001) and age at birth of the last child (r=0.29, p=0.01) but not with menopausal symptom severity score (Table 3). Since age at menopause was the control factor in the analysis, it can be concluded from these results that age of menopause would also be a significant associated factor in this milieu. These results are consistent with the finding that women who had an early menarche would have early menopause and those with late menarche would have late menopause. These results are preliminary and need to be confirmed with a larger sample.
Partial correlations (r) matrix with age at menopause as control variable
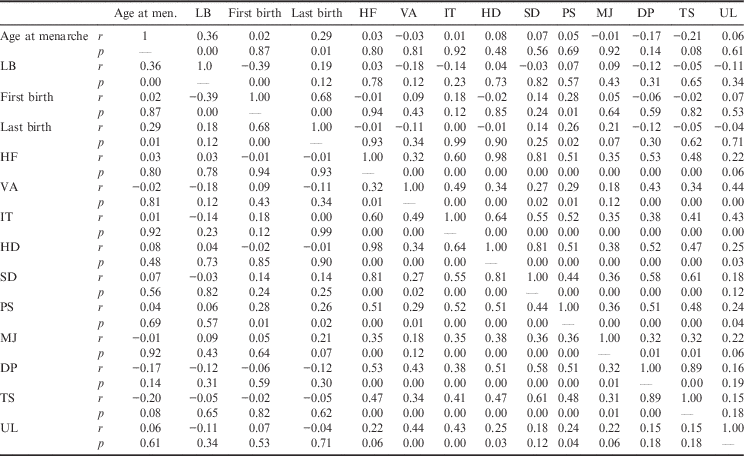
LB, last birth; HF, hot flushes; VA, vaginal atrophy; IT, irritability; HD, headache; SD, sleep disturbance; PS, pressure or high stress; MJ, muscle or joint pain; DS, depression; TS, tension; UL, urine leak.
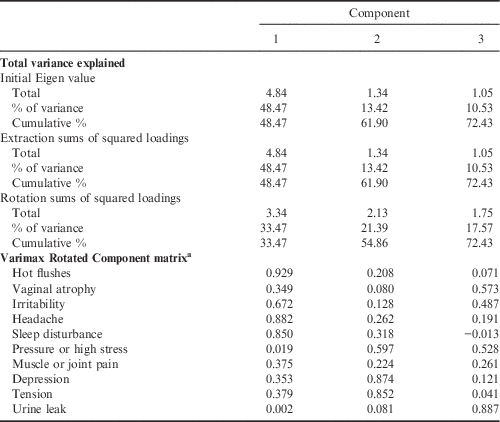
The significant first-order partial inter-correlations among menopausal symptoms (r between 0.15 and 0.89) warranted further analysis. Factor analysis reduces large numbers of correlating variables into a few core factors. To apply factor analysis, it is mandatory to test: 1) the adequacy of sample size using Kaiser–Meyer–Olkin (KMO) statistics; and 2) for inter-relationships between variables using Bartlett’s test of sphericity. Kaiser (Reference Kaiser1974) stated that a KMO test value greater than 0.5 indicates sampling adequacy for factor analysis. Values of 0.5–0.7 are considered mediocre, 0.7–0.8 good, 0.8–0.9 great and 0.9+ superb (Hutcheson & Sofronion, Reference Hutcheson and Sofroniou1999). Here, the KMO test value was 0.75, indicating that sample adequacy was very good. Bartelett’s test value was also statistically significant, thus rejecting the null hypothesis of no inter-relationship between variables, and affirming the existence of relationships between variables. Further results of the Varimax Rotation Factor analysis are shown in Table 4. Of the ten variables, only three principal components could be extracted that had Eigen values ≥1. The first factor explained about 48.5% of the variation and hence had the highest Eigen value. The Eigen values are the variances of the factors. The three components accounted for 72.47% of the variance. The rotation sums of the squared loadings are the distributions of the variances after the Varimax Rotation with Kaiser Normalization. The first component significantly explained the underlying variation for hot flushes, irritability, headache and sleep disturbance. The second component explained the variation for depression, tension and stress, while the third component explained the variation for urine leak, vaginal atrophy and partly stress. Muscle and joint pain seem to be affected by all three components; the highest component loading was seen for the first component. Menopausal symptoms were found to be independent risk factors for an overactive bladder, as they were significantly higher in women with, than those without, an overactive bladder (Zhu et al., Reference Zhu, Cheng, Sun, Lv, Mei and Chen2015).
Total variances explained and the Varimax Rotation Factor analysis of menopause symptoms
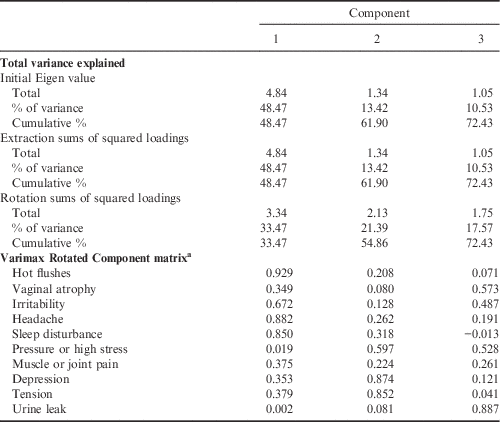
a With Kaiser normalization. Extraction method: principal component analysis; rotation converged in six iterations.
To conclude, the mean natural reproductive span of these Shimla women was lower than that of women in European countries. Age at menopause was significantly correlated with age at menarche and maternal age at birth of first and last child, but not with menopausal symptom rating scores. The majority of the women had either no or very mild menopausal symptoms. Three principal components were identified to explain the variation in menopausal symptoms.