


Introduction
The forward motion of a temperate glacier can be divided into internal deformation of ice and movement at the base, of which the latter may be a combination of sliding along the ice—bed interface and the deformation of a subglacial sediment layer. Knowledge of the relative contributions of these different mechanisms of glacier flow and their spatial and temporal variability is an essential prerequisite for understanding the dynamics of glaciers.
Some studies of glacier motion have measured spatial and temporal variations in surface motion and interpreted velocity variations in terms of changes in basal motion (e.g. Reference HodgeHodge, 1974; Reference Iken, Rothlisberger, Flotron and HaeberliIken and others, 1983; Reference KambKamb and others, 1985, 1994; Reference Iken and BindschadlerIken and Bindschadler, 1986; Reference MeierMeier and others, 1994; Reference JanssonJansson, 1995). Other studies have estimated the basal-slid- ing component by observations in tunnels excavated into glaciers (e.g. Reference Kamb and LaChapelleKamb and LaChapelle, 1964) and in natural subglacial cavities (e.g. Reference TheakstoneTheakstone, 1967, Reference Theakstone1979; Reference Vivian and BocquetVivian and Bocquet, 1973), by borehole photography (e.g. Reference Harrison and KambHarrison and Kamb, 1973; Reference Engelhardt, Harrison and KambEngelhardt and others, 1978) and borehole video (e.g. Reference PohjolaPohjola, 1993) or by direct emplacement of instruments at the bottom of boreholes (e.g. Reference Engelhardt, Humphrey and KambEngelhardt and others, 1990; Reference Blake, Fischer and ClarkeBlake and others, 1994; Reference Fischer and ClarkeFischer and Clarke, 1997a, Reference Fischer and Clarkeb; Reference Engelhardt and KambEngelhardt and Kamb, 1998).
The relative contributions of ice deformation and basal motion to the overall surface velocity can be identified using an approach based on inclinometry measurements of variations in tilt along boreholes. These measurements of the deformation of ice, when linked to those of surface velocities, provide the means to estimate the basal-motion component. Ice-deformation measurements of this type have been reported by Reference Gerrard, Perutz and RochGerrard and others (1952), Reference SharpSharp (1953), Reference Paterson and SavagePaterson and Savage (1963), Reference Savage and PatersonSavage and Paterson (1963), Reference Shreve and SharpShreve and Sharp (1970), Reference RaymondRaymond (1971), Reference Hooke and HansonHooke and Hanson (1986), Reference Hooke, Holmlund and IversonHooke and others (1987, Reference Hooke, Pohjola, Jansson and Kohler1992), Reference Copland, Harbor, Minner and SharpCopland and others (1997), Reference Harbor, Sharp, Copland, Hubbard, Nienow and MairHarbor and others (1997) and Reference Harper, Humphrey and PfefferHarper and others (1998). In principle, the method involves measuring the temporal change of trajectories of glacier boreholes (vertical profiles from the glacier surface to the glacier bed) using an inclinometer. However, because ice deformation over time is determined by comparing trajectories of the same borehole profiled at two different times, typically separated by a period of weeks to a year, temporal variations in the rates of internal ice deformation and basal motion might occur unnoticed.
In an effort to detect changes in the rate of ice deformation and, at the same time, estimate the basal-velocity component, we instrumented a borehole drilled through Unteraargletscher, a temperate valley glacier in the Bernese Alps, Switzerland, with a string of tilt meters. In this paper, we present a two-year-long continuous record of temporal changes in tilt as a function of depth within the glacier. These data are used to estimate the contribution ofthe basal motion to the forward motion of the glacier at the borehole site. Furthermore, we discuss anomalous tilt behaviour recorded with two of the tilt meters.
Methods
The tilt meters used consist of dual-axis electrolytic tilt cells with a measurement range of ±15° (HL-Planartechnik GmbH; HL-Planar NS15/V2). At a supply voltage of 12 V, tilt readings are provided in the range of ± 1.5 V. Angular resolution of the tilt measurements is estimated to be within 0.01 °. Each tilt cell is encased in a sealed, 0.5 m long steel tube having an outside diameter of 46 mm. A special extendable cable with a breaking strength above 2000 N (Cortland Cable Company, Inc.; #24 AWG copper wires cabled around a centre-core strength member with a braided nylon outer jacket) is attached to a water-tight connector which plugs into a socket mounted on top of the steel tube.
Figure 1 defines the tilt θ and the azimuth ϕ of a tilt meter with respect to a geographical system of co-ordinates (x, y, z). Because the tilt meters are not equipped with a magnetic compass, there is no information on the absolute orientation (?) of the sensor. However, using a laboratory calibration similar to the one described by Reference Blake, Clarke and GérinBlake and others (1992), we can determine the total tilt angle (θ) of the sensor from the tilt readings along the two mutually orthogonal axes x ' and y ' of the dualaxis tilt cell. We note that a rotation of the tilt meter about its long axis (z') by some angle 7 leads to changes in the individual tilt readings, but not in the tilt angle θ.
Orientation of a tilt meter with respect to a geographical coordinate system. Tilt is measured by the angle θ and azimuth by the angle ϕ. Angle γ describes the rotation of the tilt meter about its long axis.

Field Observations
In May 1996, borehole C96, drilled with hot water through Unteraargletscher near the central flowline approximately 3.5 km up-flow from the terminus (Fig. 2), was instrumented with a string of five tilt meters. At this site, the glacier has a thickness of about 300 m (Reference Funk, Gudmundsson and HermannFunk and others, 1995) and the surface slope is ~4° in the direction of glacier flow. The five tilt meters were distributed unevenly over the length of the borehole, such that they were spaced closer together near the glacier bed where most of the ice deformation was expected to occur (Fig. 3). Corresponding to their depth below the surface, the tilt meters were labelled C96-90, C96-175, C96-195, C96-235 and C96-260. Unfortunately, because of difficulties encountered during drilling, the borehole did not extend to the base of the glacier and the lowermost tilt meter, C96-260, was about 40 m above the bed. While the two upper tilt meters C96-90 and C96-175 were suspended on separate cables, the individual cables of the three lower ones, C96-195, C96-235 and C96-260, were joined at a depth of 195 m to form a single cable which led to the surface of the glacier (Fig. 3).
Map of Unteraargletscher showing the location of the tilt-meter measurements in borehole C96.

Location and wiring of the five tilt meters in borehole C96. The thickness of the glacier from the surface down is about 300 m. Tilt meters are labelled according to their depth below the surface.

Figure 4 shows roughly two years of data obtained from the five tilt meters installed in borehole C96 (solid lines; the dashed lines show modelled tilt variations which are described below). During these measurements, we collected data at six-hour intervals. In addition, we repeatedly surveyed the position of the borehole top at irregular intervals ranging from several times per day during the summer to once every two to three months during the winter. The measurements indicated a mean annual surface velocity of ~25.3 m a—1 . The measured tilt curves (solid lines in Fig. 4) display generally slow, continuous variations in tilt angle with time. However, we also noted large spurious spikes superimposed onto the general trend. Because these spikes were registered simultaneously by all tilt meters, we attribute them to electronic noise, although the cause of this noise remains unclear.
Tilt as a function of time (solid lines) recorded in borehole C96 at (a) 90 m, (b) 175 m, (c) 195 m, (d) 235mand (e) 260 m below the surface. The spurious spikes are attributed to electronic noise. Dashed lines show modeled tilt variations.

The uppermost tilt meter (Fig. 4a; C96-90) recorded a strong decrease in tilt between May and early August 1996, followed by a sudden increase in tilt around mid-August. Presumably, the borehole was still slowly creep-closing around the tilt meter during this initial time period. From September 1996 until March 1997, tilt increased slightly at a steady rate. After March 1997, strong fluctuations in tilt were recorded which may be related to surface meltwater that penetrated the borehole at the beginning of the melt season.
The data from tilt meter C96-175 (Fig. 4b) indicate a fairly steady tilt rate until October 1996. Due to a mechanical failure, no further data were obtained from this sensor after April 1997.
The record from tilt meter C96-195 (Fig. 4c) shows a rather confusing picture of tilt variations as a function of time. A generally steady increase in tilt appears to be superimposed by large tilt variations. Typically, periods of strong increases in tilt, weeks to months long, are followed by much shorter periods of decreasing tilt. We suspect these short-term variations in tilt reflect motion of the tilt meter relative to the surrounding ice. Possibly, the borehole never fully closed around this sensor.
The data from tilt meter C96-235 (Fig. 4d) show steady continuous changes in tilt during the entire measurement period. Similar to the record from tilt meter C96-175, the first few months after installation are characterized by a decreasing tilt which, after reaching a minimum, is followed by an increase in tilt angle at a steady rate. The initial decrease in tilt is probably the result of the tilt meter originally having been tilted somewhat in the up-glacier direction.
The lowermost tilt meter (Fig. 4e; C96-260) recorded an overall increase in tilt angle. However, the data also indicate a period of anomalous temporal changes in tilt which coincides with the 1997 summer melt season. After initially increasing with time, tilt angles were observed to decrease during May and June 1997. Subsequently, tilt angles started to increase, however with considerably higher rates than before. Eventually in early October 1997, the rate of tilt variations returned to a value identical to that observed during the previous winter.
Estimation of Basal Motion
In the following analysis, we use tilt data to estimate the contribution of basal motion to the forward motion of the glacier at our measurement site. However, with only five tilt meters, it is problematic to determine the flow-velocity profile through the glacier by direct integration of the measured tilt rates over the ice thickness. An approach better suited for the available dataset is to compute synthetic tilt curves using a parameterization of the flow field and then to determine the parameter values by comparing the synthetic tilt data with the field measurement. Because we are interested in calculating a mean annual ice-deformational velocity, a simplified model capable of describing the general flow pattern is adequate for this purpose.
Velocity model
For a coordinate system with the x axis along the ice—bed interface directed in the glacier-flow direction and the z axis normal to the bed and pointed positive upward through the ice, we describe the flow field by the following horizontal and vertical velocity components:

and

Here, h is the ice thickness, and  denote the horizontal and the vertical components of the basal sliding velocity vector, respectively. We have lumped quantities such as the Glen law viscosity parameter, the surface slope of the glacier, the density of ice and the acceleration due to gravity into parameter C
1.Together with C
2 and the Glen law exponent n, these parameters are the tuning variables that enter the model. The first term of Equation (1) describes the flow of a slab of constant thickness down an uniformly inclined plane. The second term of Equation (1) and the first term of Equation (2) account for horizontal- and vertical- velocity gradients, respectively, and can be thought of as representing a linearization of the flow field around the position of the borehole. The flow field defined by Equations (1) and (2) is divergence-free, and the surface is not subjected to any stress. Equation (2) implies constant vertical strain rates with depth through the glacier. This assumption is supported by direct measurements of vertical strain rates made in spring 1997 at a site about 700 m down-glacier from borehole C96 (Reference GudmundssonGudmundsson, 1999a).
Although C
1, C
2 and n are essentially freely tunable model parameters, their values can be constrained without resorting to the tilt-meter data. The Glen law exponent n is generally thought to have a value of about 3. Measurements of the vertical velocity at the surface give u
z ≈ 2 m a—1 which, using Equation (2) and assuming no vertical motion at the bed, yields an estimate for C
2 of the same value. Alternatively, applying Equation (1) to measured longitudinal gradients in surface velocities leads to a value of C
2 from 3–4 m a —1. According to Equation (1) the horizontal velocity at the surface is equal to 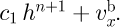 . The value of C
1 can only be determined if the relative contributions of internal ice deformation and basal motion to the surface velocity is known, which is the object of this study, but an order-of-magnitude estimate yields C
1 ≈ 10—9 m—3 a—1.
Synthetic tilt curves
The tilt rate of a sensor is affected by both the shear strain rate  and the rates of horizontal and vertical compression/extension
 and
 within the ice. Furthermore, as the tilt meter moves with the ice, spatial gradients in the flow field may also lead to apparent temporal changes in tilt.
For each tilt meter, we compute synthetic tilt curves by following the position of the centre and the top and bottom of the sensor with time through a forward integration of the velocity field defined by Equations (1) and (2). The centre of the tilt meter is assumed to follow a particle path, while the velocity gradient along its length introduces a rigid body rotation about this centre. The initial position and orientation of each tilt meter is given by the initial coordinates of the centre, together with the relative coordinates of the top and bottom of the sensor at time t = t 0. We denote the position of the centre by r(r0, t) = (x c (t), y c (t), z c (t)), where r° is the initial position of the centre at t = t 0. The coordinates of the top of the tilt meter with respect to r(r0, t) are denoted by Δr = (Δx, Δy, Δz). For a given initial position and tilt, the particle path leading from r0 is calculated through forward integration as

The positions of the top and bottom of the tilt meter are calculated at every time-step by determining the particle paths leading from r(r0, t) ± Δr(r0, t) during the time interval At. This calculation yields new intermediate relative positions Δr '(r0, t + Δt) which must, in order to preserve the length of the tilt meter, be scaled to give the new positions of the top and bottom of the sensor with respect to its centre. The intermediate relative positions Δr, (r°, t + Δt) = (Δx', Δy', Δz') follow from


where the velocity field has been linearized around the centre position r(r0, Δt). The new relative coordinates of the top and bottom are then given by

where l is the length of the tilt meter. The new tilt angle is now calculated from the new relative positions of the top and bottom of the sensor with respect to its centre. From Equations (4)—(6), we see that both shearing and stretching/compression of the ice contribute to tilt changes. Note, that the length l has, despite its appearance in Equation (7), essentially no effect on the shape of the synthetic tilt curves.
Model tuning and results
Table 1 summarizes the optimal values of model parameters that were determined through a comparison of synthetic and measured tilt curves. Prior to this comparison, spurious spikes and periods of anomalous tilt variations were removed from the dataset. The root-mean-square (rms) error between the resulting curves and the synthetic curves was then calculated and used as a measure of the goodness-of-fit.
Model parameter values.

Inputs to the model are the parameters C
1 and C
2, the Glen law exponent n, the mean surface slope of the glacier α, the ice thickness h, the surface velocity  . and the slip ratio (defined as the ratio of basal motion to forward motion at the surface due to internal ice deformation). In addition, the depth below the ice surface and the initial tilt and azimuth angles of each individual tilt meter must be prescribed. For a plausible set of model parameters, synthetic tilt curves were calculated. Subsequently, the model parameters were adjusted on a trial-and-error basis to yield the best fit in a rms sense with the measured tilt data. For a given (measured) mean surface velocity . we determined the value of C
1 as a function of the slip ratio. The parameter C
2 turned out to have a negligible effect on the synthetic curves, which left the ice thickness (h), the mean surface slope (α), and the Glen law exponent (n) as the only remaining variables. A reference set of values for these remaining parameters was defined as h = 300 m, α = 4° and n = 3. The sensitivity of the optimal estimate of the slip ratio to variations in h, α and n was estimated by varying each of these parameters by 10% around its respective reference value. The resulting set of rms error curves is shown in Figure 5.
Normalized misfit between measured and synthetic tilt curves as a function of slip ratio. The solid curve is calculated for a reference set of parameters (h — 300 m, α — 4° and n — 3). The dotted curves (26 in total) are calculated for ±10% variations in these reference values. The confidence range for the slip ratio is estimated to be between 0.9 and 1.5.

The best fit between measured and synthetic tilt curves is obtained for a slip ratio of 1.2 (Fig. 5). The sensitivity of this estimate to measurement errors in the tilt data was assessed both by selecting different subsets of the measured data for the fitting and by fitting within a prescribed tolerance. From these numerical experiments, the range of confidence for the optimal value of the slip ratio is estimated to be between 0.9 and 1.5.
Tilt Anomalies
While all five tilt meters recorded overall increases in tilt angle during the two-year period, the data of sensors C96- 195 and C96-260 are characterized by sudden and drastic variations in tilt (Fig. 4). The general steady increase in tilt recorded by sensor C96-195 (Fig. 4c) appears to be superimposed by quasi-repetitive anomalous tilt variations. These anomalies follow a fairly consistent pattern, whereby periods lasting several weeks to a few months of strongly increasing tilts are followed by sudden decreases in tilt occuring in a matter of a few days. Furthermore, during a given period of higher-than-average tilt-angle increases, the rate of tilt change is typically largest in the beginning and becomes progressively smaller towards the end of the period. Because there is no apparent correlation to temporal variations in the flow of the glacier, we suggest this tilt anomaly might result from the wiring configuration of the three lower tilt meters C96-195, C96-235 and C96-260 (Fig. 3). As the ice deforms, the instrument cables are subjected to pulling and streching, an effect which is likely to be enhanced for the tilt meters installed deep in the borehole closer to the bed where most ice deformation occurs. Because the individual cables of these three lower sensors are joined just above tilt meter C96-195 (Fig. 3), the pulling and stretching of the cables of tilt meters C96-235 and C96-260 could release the tension on tilt meter C96-195 and result in sporadic motion of the sensor with respect to the surrounding ice.
The most conspicuous tilt anomaly in the whole dataset is the one recorded with tilt meter C96-260, positioned about 40 m above the bed (Fig. 4e). It is difficult to assess the degree to which this anomaly reflects temporal variations in ice deformation at this depth, or merely relative motion of the sensor with respect to the surrounding ice. Because only one such period of anomalous tilt variation was recorded and because this period coincides with the 1997 summer melt season, we are motivated to consider the implications of this tilt anomaly for the flow field within the glacier. The strong decrease in tilt angle by ~5° observed during May and june 1997 (Fig. 4e) could correspond to an up-glacier rotation of the sensor and thus could be an indication of extrusion flow, i.e. an increase in horizontal velocity with depth. The concept of extrusion flow has been a subject of debate in the glaciological literature. Early claims of extrusion flow (e.g. Reference DemorestDemorest, 1941, Reference Demorest1942) were shown by Reference NyeNye (1952) to be inconsistent with straightforward force-balance arguments. These early claims were related to the possibility of a widespread extrusion flow, i.e. an increase in velocity with depth over a significant part or even the whole length of a glacier. On the other hand, localized extrusion flow resulting from flow perturbations set up by bedrock undulations has been shown to be a theoretically valid concept (Reference GudmundssonGudmundsson, 1997a, Reference Gudmundssonb). Furthermore, repeated inclinometry measurements in boreholes at Storglaciären (Reference Hooke, Holmlund and IversonHooke and others, 1987, Reference Hooke, Pohjola, Jansson and Kohler1992) and Haut Glacier d’Arolla (Reference Copland, Harbor, Minner and SharpCopland and others, 1997; Reference Harbor, Sharp, Copland, Hubbard, Nienow and MairHarbor and others, 1997) have shown that an increase in velocity with depth appears to be related to a reduction in basal drag during the melt season. If indeed the data from tilt meter C96-260 (Fig. 4e) indicate extrusion flow, this may be related to the influence of an undulating glacier bed. However, the fact that the strong decrease in tilt angle coincides with the beginning of the melt season and that the rate of tilt variation eventually returns to a value which is identical to that of the previous winter, suggests there is a connection between the tilt anomaly and temporal changes in basal conditions.
Concluding Remarks
In this paper, we have shown how continuous variations in tilt, recorded with a string of tilt meters installed in a borehole, can be used to estimate the relative contributions of internal ice deformation and basal motion to the total forward motion of the glacier. We have based our estimation on a comparison of the measurements with synthetic tilt curves, computed using a parameterization of a simplified flow field. This comparison suggests a slip ratio of about 1.2 at our measurement site, corresponding to a significantly higher proportion of basal motion than expected from seasonal variations in surface velocity. Repeated surveying of a flow marker on top of borehole C96 indicates average surface velocites of ~27 m a—1 during the summer and ~23 m a—1 during the 1997–98 winter. Assuming largely reduced or even totally absent basal motion during the winter, these measurements yield a lower estimate for the slip ratio of about 0.17. Similarly, based on year-round surface velocity measurements at the confluence of Finsteraar- and Lauteraargletscher (Fig. 2) about 2 km up-glacier from borehole C96, Reference Gudmundsson, Iken and FunkGudmundsson and others (1997) inferred that winter velocities are about 75% of summer values which translates into a slip ratio of ~0.33. Our result therefore suggests that a significant amount of basal motion takes place during the winter and stands in sharp contrast to the previous assumption that movement at the base of Unteraargletscher is primarily limited to the summer melt season (Reference GudmundssonGudmundsson, 1999b).
The calculation of synthetic tilt curves is based on the assumption that ice deforms as a perfect Glen law viscous medium. If the flow law does not hold, and in particular if the Glen law viscosity parameter and the Glen law exponent n vary near the bed, our estimate of the slip ratio may be in error. Possibly, the biggest limitation of our study is the fact that the lowermost tilt meter is located about 40 m above the bed. Hence, no deformation measurements are available for these bottom 40 m of ice, which are, according to Equation (1), responsible for almost 20% of the total forward motion of the glacier.
At the time of deployment, we did not anticipate that the tilt meters would function and yield useful data over a two- year period. This long period of successful data collection resulted in substantial stretching of the instrument cables because of ice deformation. Although we accounted for this stretching by using special extendable cables, the possibility of mutual interference between different tilt meters due to the wiring configuration cannot be excluded. As discussed above, a viable explanation for the observed tilt anomaly is that one sensor pulls on the instrument cable which is also connected to another sensor. A strategy to alleviate this problem is to suspend each tilt meter in a different borehole or, possibly even better, to have the tilt meters rest at the bottom of boreholes that are drilled to different depths with sufficient slack cable to accommodate the deformation of the ice.
Acknowledgements
We appreciate the contributions of J. Luthiger to the design and construction of the tilt meters and the energetic assistance of B. Nedala in the field. Comments made by V. A. Pohjola and J. Harbor led to considerable improvements of this manuscript. This research was partially funded by the Swiss Federal Institute of Technology (ETH grant 0-20-982-95) and the Swiss National Science Foundation (grant 2100-047095.96/1).



