It is well known that learning to perceive and produce phonemes in a second language (L2) can be difficult. This has led to a considerable number of empirical and theoretical studies investigating the acquisition of novel phonetic categories by nonnative speakers and ways to promote the development of speech perception and production. However, research in L2 speech acquisition has primarily targeted the auditory modality of input and often disregarded visual elements such as lip movements. The objective of this study was to provide a better understanding of the role of facial cues in L2 acquisition by examining whether audiovisual (AV) training led to higher improvement in the perception and production of French nasal vowels than did auditory-only (A-only) training. In the following sections, I review research on multimodal speech perception and the contribution of facial cues on language processing. I then summarize previous audiovisual (L2) speech perception studies. Finally, I discuss the relationship between speech perception and speech production, and the effects of (AV) perceptual training on speech production.
MULTIMODAL SPEECH PERCEPTION
Theorists propose that speech perception is a multimodal process, involving the integration of auditory information (i.e., hearing) and visual cues (i.e., lipreading; Rosenblum, Reference Rosenblum, Pisoni and Remez2005). In face-to-face conversation, speech perception is influenced by the actual sound of speech, as well as the facial and lip movements of speakers (Sumby & Pollack, Reference Sumby and Pollack1954). The importance of the visual modality is supported by studies showing that the motion of vocal tract articulators correlates with facial movements (e.g., Jiang, Alwan, Keating, Auer, & Bernstein, Reference Jiang, Alwan, Keating, Auer and Bernstein2002; Yehia, Rubin, & Vatikiotis-Bateson, Reference Yehia, Rubin and Vatikiotis-Bateson1998). In a study using motion markers, Jiang et al. (1998) proposed that “about 80% of the variance found in vocal-tract movements can be estimated from the face” (p. 23). Visual cues have been shown to be particularly useful for enhancing the speech perception of hearing-impaired individuals (e.g., Owens & Blazek, Reference Owens and Blazek1985), and facilitate comprehension for listeners with good hearing ability in environments degraded by background noise (e.g., MacLeod & Summerfield, Reference MacLeod and Summerfield1990; Rosenblum, Johnson, & Saldaña, Reference Rosenblum, Johnson and Saldaña1996; Sumby & Pollack, Reference Sumby and Pollack1954), when messages are conceptually difficult to understand (e.g., Arnold & Hill, Reference Arnold and Hill2001; Reisberg, McLean, & Goldfield, Reference Reisberg, McLean, Goldfield, Dodd and Campbell1987), and when listening to accented speech (Reisberg et al., Reference Reisberg, McLean, Goldfield, Dodd and Campbell1987). Reisberg et al. (Reference Reisberg, McLean, Goldfield, Dodd and Campbell1987) demonstrated that English native speakers learning French were better at shadowing French sentences presented in an AV mode than they were at those presented only auditorily. Visual cues have also been shown to enhance the comprehension of lyrics when listeners watched singers’ lips (Jesse & Massaro, Reference Jesse and Massaro2010) and to influence the language development of infants, because visually impaired children with normal hearing acquire visually salient but auditorily difficult phonetic distinctions (e.g., /m/ vs. /n/) later than sighted children do (Mills, Reference Mills and Mills1983, Reference Mills, Dodd and Campbell1987). In addition, although congenitally blind people produce accurate sounds, studies have shown that sighted speakers produce vowels that are further apart on the vowel space (Ménard, Dupont, Baum, & Aubin, Reference Ménard, Dupont, Baum and Aubin2009). In summary, seeing information about articulation can give people an advantage in perception and production, and at the right signal to noise ratio visual information can make the difference between comprehension and incomprehension for listeners.
In addition, that visual cues have been shown to be beneficial even when speech was clearly presented (Jesse & Massaro, Reference Jesse and Massaro2010; McGrath & Summerfield, Reference McGrath and Summerfield1985) seems to provide evidence that multimodal perception is the primary mode of speech perception, whereas auditory-only speech perception is an impoverished version of the information (Rosenblum, Reference Rosenblum, Pisoni and Remez2005). The argument for a multimodal speech primacy is demonstrated by the “McGurk effect” (McGurk & MacDonald, Reference McGurk and MacDonald1976) and is supported by data from neural imaging experiments. For instance, a study showed that the mere fact of observing lip movements, without having access to any speech sounds, activates the auditory cortex, thus reinforcing the idea that “seen speech” influences “heard speech” (Calvert et al., Reference Calvert, Bullmore, Brammer, Campbell, Williams and McGuire1997).
AUDIOVISUAL SPEECH PERCEPTION STUDIES
The relationship between speech perception and visual information has been attested in studies investigating the effects of noise (e.g., Alm, Behne, Wang, & Eg, Reference Alm, Behne, Wang and Eg2009; Binnie, Montgomery, & Jackson, Reference Binnie, Montgomery and Jackson1974; Sommers, Spehar, & Tye-Murray, Reference Sommers, Spehar and Tye-Murray2005), and the McGurk effect, both with English and with other languages (e.g., Gelder, Bertelson, Vroomen, & Chen, Reference de Gelder, Bertelson, Vroomen and Chen1995; Grassegger, Reference Grassegger1995; Hardison, Reference Hardison1996). Cross-linguistic studies have, however, revealed language-specific patterns. The McGurk effect seems to have a weaker effect with Chinese and Japanese perceivers, probably because visual cues are less informative for a tonal language like Chinese, and Japanese cultural habits discourage staring at people's faces (Sekiyama, Reference Sekiyama1997; Sekiyama & Tohkura, Reference Sekiyama and Tohkura1991). The visual cue inventory in a perceiver's first or dominant language has also been shown to influence AV speech perception. For instance, contrary to bilinguals with Catalan as their dominant language, Spanish–Catalan bilinguals with Spanish as their dominant language could not distinguish the Catalan vowel contrast [ɛ–e] in the A-only condition, but when visual information was added, both groups could successfully perceive the contrast (Navarra & Soto-Faraco, Reference Navarra and Soto-Faraco2007).
Whether L2 learners make use of and benefit from visual cues has important implications for L2 acquisition and pedagogy. To date, most studies investigating AV L2 speech perception have focused on the contrast between problematic L2 consonants. A tremendous amount of research has been conducted on English sounds, such as the /r/ and /l/ contrast (e.g., Goto, Reference Goto1971; Hardison, Reference Hardison1996, Reference Hardison2003; Hazan et al., Reference Hazan, Sennema, Faulkner, Ortega-Llebaria, Iba and Chung2006; Hazan, Sennema, Iba, & Faulkner, Reference Hazan, Sennema, Iba and Faulkner2005; Lively, Logan, & Pisoni, Reference Lively, Logan and Pisoni1993; Massaro & Light, Reference Massaro and Light2003; Walden, Prosek, Montgomery, Scherr, & Jones, Reference Walden, Prosek, Montgomery, Scherr and Jones1977), the fricatives (e.g., Wang, Behne, & Jiang, Reference Wang, Behne and Jiang2008, Reference Wang, Behne and Jiang2009; Werker, Frost, & McGurk, Reference Werker, Frost and McGurk1992), the labial/labiodental contrast (Hazan et al., Reference Hazan, Sennema, Iba and Faulkner2005, Reference Hazan, Sennema, Faulkner, Ortega-Llebaria, Iba and Chung2006), and the syllable-final nasals (Kluge, Reis, Nobre-Oliveira, & Bettoni-Techio, Reference Kluge, Reis, Nobre-Oliveira, Bettoni-Techio, Watkins, Rauber and Baptista2009). Findings reveal interference between first language (L1) and L2 phoneme inventories and highlight the influence of the L1 on AV speech perception in an L2. In one of the first studies investigating the effects of AV information on L2 speech perception, Werker et al. (Reference Werker, Frost and McGurk1992) observed that because French does not have interdental fricatives, French beginner and intermediate learners of English could not use the visible information effectively to accurately identify the interdental fricative. In another study, Mandarin speakers were found to outperform Korean speakers in the perception of the visual cues for the English labiodental fricatives because Mandarin Chinese contains labiodental fricatives while Korean does not (Wang et al., Reference Wang, Behne and Jiang2009). Similarly, presentation of both audio and visual information failed to enhance the perception of the /v/–/b/ and /ð/–/d/ contrasts by Spanish L1 learners of English probably because they used the visual cues as allophonic features (Ortega-Llebaria, Faulkner, & Hazan, Reference Ortega-Llebaria, Faulkner and Hazan2001). In contrast, Spanish speakers showed greater sensitivity to visual cues than did Japanese speakers when tested on their perception of a labial/labiodental consonant contrast in English because the labiodental [v] does exist in Spanish as an allophone of /f/ (Hazan et al., Reference Hazan, Sennema, Faulkner, Ortega-Llebaria, Iba and Chung2006).
Although vowels might appear less visually salient than consonants, strong correlations between the height of the tongue in the mouth and the vertical separation of the lips help distinguish between vowels (Summerfield, Reference Summerfield, Mattingly and Studdert-Kennedy1991). The visibility of the teeth and the tongue, the extent of lip rounding, and the degree of lip protrusion are also helpful cues (McGrath, Summerfield, & Brooke, Reference McGrath, Summerfield and Brooke1984; Summerfield, MacLeod, McGrath, & Brooke, Reference Summerfield, MacLeod, McGrath, Brooke, Young and Ellis1989). Research on AV speech perception has looked at the intelligibility of native vowels (Benoît, Mohamadi, & Kandel, Reference Benoît, Mohamadi and Kandel1994; Lisker & Rossi, Reference Lisker and Rossi1992; Öhrström & Traunmüller, Reference Öhrström and Traunmüller2004; Robert-Ribes, Schwartz, Lallouache, & Escudier, Reference Robert-Ribes, Schwartz, Lallouache and Escudier1998; Traunmüller & Öhrström, Reference Traunmüller and Öhrström2007; Valkenier, Duyne, Andringa, & Başkent, Reference Valkenier, Duyne, Andringa and Başkent2012); however, most of the L2 studies have investigated consonants. A notable exception investigating the perception of Japanese vowel duration found that AV training was more efficient than A-only training (Hirata & Kelly, Reference Hirata and Kelly2010), while another study on the perception of English vowels by Spanish English as a foreign language (EFL) learners found no significant difference between the two types of training (Pereira, Reference Pereira2013). In sum, a lot remains unknown regarding the AV perception of vowels by nonnative speakers and the effects of AV training.
RELATIONSHIP BETWEEN PERCEPTUAL TRAINING AND PRODUCTION
A related question is the extent to which gains made in perception during perceptual training transfer to improvement in production, and whether the availability of bimodal information in audiovisual training leads to greater benefit than A-only training. Understanding the relationship between speech perception and speech production has been a long-standing concern for speech theorists and L2 researchers. A widely supported hypothesis advanced in the speech learning model is that accurate perception of L2 phones precedes accurate production (Flege, Reference Flege1987, Reference Flege and Strange1995), and therefore difficulty in distinguishing sounds causes difficulty in production (Bohn & Flege, Reference Bohn and Flege1992). According to Flege (Reference Flege1987), L2 production is a reflection of the phonetic categories from an individual's perceptual experiences, and L2 learners use articulatory gestures established during the acquisition of their L1. In contrast, the motor theory (Liberman & Mattingly, Reference Liberman and Mattingly1985) and the perceptual assimilation model (Best, Reference Best and Strange1995) agree with this interdependence of perception and production, but argue that improvements in speech perception should be simultaneously accompanied by improvements in production, based on the assumption that L2 sounds are perceived directly in relation to the articulatory gestures of the speaker. What is ultimately of interest to L2 acquisition researchers is to study the extent to which perceptual training can improve speech production. The results of auditory training studies have revealed that knowledge gained during perceptual learning of L2 sounds transferred to the production domain (e.g., Bradlow, Akahane-Yamada, Pisoni, & Tohkura, Reference Bradlow, Akahane-Yamada, Pisoni and Tohkura1999; Bradlow, Pisoni, Akahane-Yamada, & Tohkura, Reference Bradlow, Pisoni, Akahane-Yamada and Tohkura1997; Lambacher, Martens, Kakehi, Marasinghe, & Molholt, Reference Lambacher, Martens, Kakehi, Marasinghe and Molholt2005; Lopez-Soto & Kewley-Port, Reference Lopez-Soto and Kewley-Port2009). In addition, a smaller number of studies have also looked at whether L2 learners can be trained to use visible information to accurately identify L2 phonemes and whether AV training leads to better improvement than A-only training does. A 3-week training study by Hardison (Reference Hardison2003) investigated the perception and production of the American English /r–l/ contrast by Japanese and Korean L2 learners. Three groups (AV training, A-only training, and no training) completed an identification task with the minimal pairs /r–l/ presented once in each modality: AV, A, and V. Participants’ productions at pretest and posttest were also assessed to evaluate the effect of perceptual training on production. The results indicated that the AV training group improved more than the A-only training group did and that perception was enhanced by visual information in contexts where the L1 phonology predicted difficulty. In addition, improvement in production was significant, suggesting that improvement in perception transfers to improvement in production. Hazan et al. (Reference Hazan, Sennema, Iba and Faulkner2005) reached similar conclusions while investigating the perception and production of /p/, /b/, and /v/ by Japanese EFL learners, but failed to note the superiority of AV training on the less visually salient /r/–/l/ contrast at the perception posttest. In terms of production, however, greater improvement was demonstrated by the AV group, suggesting that exposure to visual cues without any training in production can lead to improvement in pronunciation.
The goal of the current study was to fill a research gap with regard to the effect of audiovisual training on the perception of L2 vowels, and to examine the relationship between audiovisual perceptual training and production. More specifically, this study explores whether American learners of French are able to use the visual cues available to them to distinguish French nasal vowels. The three French nasal vowels are particularly suited for an investigation of the effect of AV cues on the perception and production of L2 vowels for several reasons. First and foremost, their differences are visually salient, as they are placed on a continuum from hyper-rounded [
 ], rounded [
 ], to unrounded [
 ] (Zerling, Reference Zerling1989) and a previous study has shown that native speakers can visually distinguish these three vowels (Inceoglu, Reference Inceoglu2011). Second, more rounded vowels exist in French than in English, and the rounding in French is more marked and is accompanied by a strong protrusion of the lips. Third, the distinction among the three nasal vowels are often problematic for L2 learners, and any positive effects from training could have relevant pedagogical implications.Footnote
1
The research questions motivating this study were as follows: does AV perceptual training lead to greater improvement in L2 perception of French nasal vowels than A-only training does? Does AV perceptual training lead to greater improvement in L2 production of French nasal vowels than A-only training does?
METHOD
Participants
The participants in this study were 60 American English learners of French (43 females, 17 males) ranging in age from 18 to 24 with an average age of 20 years (SD = 1.44). Forty participants were randomly assigned to one experimental group: AV or A-only perceptual training, and 20 served as controls (i.e., received no training). The participants were enrolled in intermediate-level French courses at a large Midwestern university and were similar in terms of stay-abroad influence and amount of audiovisual input in French. None of the participants had training in phonetics nor in lipreading, and all reported good vision and no hearing disorders. Participants in the experimental group were paid $60 for their time, and the control group received $20. Two native speakers of French served as raters. They were trained in teaching French as a foreign language and were familiar with accented speech. For the analysis, the data of one participant from the control group was removed because this person did not complete the tasks correctly.
Stimuli
Perception stimuli
Stimuli consisted of 108 monosyllabic consonant–vowel–consonant words where the vowel was one of the three (French) Parisian nasal vowel [
–
–
] and the consonants one of the following: [p–t–k–b–d–g–s–z–f–v–ʒ–ʃ], for example, [p
t]. There was a total of 36 tokens per vowel, with initial and final consonants equally distributed between manner (occlusive and fricative) and place (bilabial, labiodental, dental, alveolar, palatal, and velar) of articulation, thus resulting in six tokens per manner/place of articulation. None of the tokens was presented during both testing and training. In addition, previous perception studies have used either nonsense words (Iverson et al., Reference Iverson, Pinet and Evans2011; Levy & Strange, Reference Levy and Strange2008) or real words (Hardison, Reference Hardison2003); however, with the design of the study, using only nonsense words or only real words was impossible because, for most of the triads, one stimulus/vowel would have to be excluded. Because the purpose of the experiment was to identify sounds, the task for the listeners was to focus only on the specific sounds under test, and learners’ potential background vocabulary knowledge was unlikely to influence their identification of the perceived vowels. In addition, previous studies have demonstrated that no correlation exists between word familiarity and identification scores in speech perception experiments (e.g., Flege, Takagi, & Mann, Reference Flege, Takagi and Mann1995). Therefore, for the current study, a mix of real words and nonsense words was used.
Perceptual training stimuli
Training stimuli originally consisted of 180 consonant–vowel–consonant stimuli similar to those presented during testing, but 2 tokens had to be removed because of poor audio quality, thus reducing the total number of tokens to 178. There was a total of 59 tokens for both [
] and [
], and 60 tokens for [
]. Similar to the pre-/posttest stimuli, the initial and final consonants of the training stimuli were equally distributed between manner and place of articulation.
Recording
A female native speaker of French was videorecorded in a quiet research room and was instructed to read a list of stimuli containing nasal vowels in the most natural fashion with the aim of avoiding hyperarticulation. Each list ended with the repetition of the last utterance to control for list-final intonation. The camera captured a full-sized image of the speaker's head, and her lower jaw drop was fully visible. The recording of each stimuli was saved as one file to permit editing (i.e., remove audio or video channel) and random ordering for the three testing modalities (AV, A-only, and V) and for the two types of training modalities (AV or A-only). Three monolingual native speakers of (Parisian) French assessed the intelligibility of the stimuli by identifying which nasal vowel, <on>, <un>, or <an>, was produced.Footnote 2 The accuracy score was 100%.
Procedure
On the first day of the study, all participants met individually with the researcher, read the consent form, and filled out a language background questionnaire. Scheduling for the upcoming training sessions and the posttest was then arranged.
Production testing
The production pretest and posttest were administered in a sound-attenuated research room and were carried out before the perception tests. Each of the 108 stimuli was presented via headphones equipped with a microphone and was followed by a sentence in French prompting participants to repeat the word. No orthographic support was presented. The reason for having a delay between the stimulus and its repetition, combined with the intervening speech material (i.e., the prompts), was to prevent direct imitation from sensory memory. The task started with a practice task, was videorecorded with the webcam at the top of the computer, and lasted 9 min with a break in the middle.
Perception testing
Participants were presented with 108 stimuli in each of the three modalities: AV, A-only, and V, yielding a total of 324 responses per participant. The number of stimuli was not higher to ensure that participants would not get tired and to keep the duration of the whole pretest session under 1 hr. The V modality was included for testing to shed some light on whether visual cues also play a significant role in vowel perception and recognition when audio stimuli are absent. The order of presentation of the stimuli varied for each modality and was counterbalanced across participants. Two orders were used for the presentation of the three modalities: (AV, A-only, V) or (A-only, AV, V), and the two orders were also counterbalanced across participants. Participants sat in front of an iMac computer equipped with a 21.5-in. screen, running at 1920 × 1080, and the aural stimuli (in the A-only and AV modalities) were presented via high-quality headphones. For each modality of presentation, the experiments started with four practice stimuli to ensure that the participants were familiar with the task, that the volume was adequate, and that they were responding within 4 s. The stimulus, AV, A-only, or V, was played before the three options appeared on the screen so as not to restrict participants’ initial recognition of the stimulus and limit priming effects from the other options. In order to reduce the risk of confusion, [
] options always appeared on the left, [
] options in the middle, and [
] options on the right. For example, participants heard [p
t] and were asked whether the vowel presented sounded like <on>, <an>, or <un>. Participants had 4 s to click on one of the three options before the next stimulus was presented. They were encouraged to guess for stimuli that they were unsure of, and stimuli that were not identified were classified as incorrect. No feedback was given. The perception pretest lasted about 30 min, with short breaks between the three modalities of presentation.
Training
Participants were assigned to one experimental group: AV training, A-only training, or no training. The participants in the two training groups completed six training sessions of perceptual training within a period of 18 days (mean = 15 days) with no more than one training session per day. Participants in both groups were presented with the same stimuli and followed the same procedure, with the only difference being that the A-only group did not see the speaker's face. All the training sessions followed the same procedures as for the pretest, except that participants received feedback. If the answer they clicked on was correct, the message “Bravo!” appeared in green, whereas if the answer was incorrect, the message “Incorrect” appeared in red, followed by the correct option. Participants in the AV training group were instructed that they had to watch the screen and should not close their eyes to concentrate. Because the entire experiment, including the response task, was conducted on the computer, the chance for participants in the AV training group to not look at the visual stimuli was highly reduced, and the researcher insured that participants were focusing on the screen. Training sessions consisted of 178 stimuli and lasted about 30 min, with short breaks after each block of 30 stimuli.
Identification of vowel production by native listeners
Two native speakers of Parisian French familiar with accented speech but with no formal background in phonetics performed a forced-choice identification task to assess the participants’ pretest and posttest productions. This evaluation method has been used in previous studies investigating the effects of (AV) perceptual training on production (Bradlow et al., Reference Bradlow, Pisoni, Akahane-Yamada and Tohkura1997; Hazan et al., Reference Hazan, Sennema, Iba and Faulkner2005; Lambacher et al., Reference Lambacher, Martens, Kakehi, Marasinghe and Molholt2005) and was deemed to well represent native speakers’ comprehension of nonnative speech, as well as being reflective of both acoustic and articulatory dimensions (Baker & Trofimovich, Reference Baker and Trofimovich2006) despite being less of a fine-grained measure than acoustic analyses. Because forced-identification tasks tend to involve fewer risks of subjectivity than quality rating tasksFootnote 3 and because the task was to identify three vowels (as opposed to a larger set of phonemes) by a group of learners with a homogenous background (i.e., same L1 and proficiency level), the use of two native listeners was deemed sufficient.Footnote 4
The listeners were asked to focus on the realizations of the nasal vowel rather than on the pronunciation of the consonants or the word itself. Tokens were presented in a three-alternative forced-choice identification task using the TP software designed for speech perception experiments (Rauber, Rato, Kluge, & Santos, Reference Rauber, Rato, Kluge and Santos2012). On each trial, listeners heard the token produced by a learner and indicated their choice of the word by clicking on one of the three options presented on the screen: “on,” “an,” and “un.” The task was not timed, and listeners had the option to click a replay button to listen to a segment a second time. The order of the stimuli produced by the L2 speakers was randomized within blocks of 100 stimuli containing both pretest and posttest production tokens, and the presentation order of the different blocks was counterbalanced across listeners. A total of 12,960 production tokens were identified with an agreement of 0.844 (Cronbach α), which is considered highly acceptable. To ensure that all the production tokens used for the analysis were agreed upon by at least two native listeners, the researcher (also a French native speaker) independently listened to and identified the 1,540 tokens that the two original native listeners disagreed upon.
Analysis
All the statistical analyses were run using the SPSS software (Version 19). The results of a Kolmogorov–Smirnov test indicated that the data were normally distributed, except for the perception pretest in the A-only testing modality; these results thus have to be interpreted with caution. A Mauchly sphericity test was used to verify whether the assumption of sphericity was violated, and when violated, Greenhouse–Geisser adjusted scores were reported. Effect sizes are reported as partial eta-squared (ηp 2). When ηp 2 was around 0.01, it was interpreted as a small effect size, 0.06 as a medium effect size, and 0.14 and above as a large effect size (Cohen, Reference Cohen1988). The Cohen d was also calculated to measure the magnitude of the effect between two contrast groups of means and was reported as small (d < 0.70), medium (0.70 ≤ d < 1.00), or large (1.00 ≤ d) following Plonsky and Oswald's recommendations (Reference Plonsky and Oswald2014). To avoid a Type I error due to the large number of tests conducted on the perception pretest and posttest, the significance level was divided by nine (the number of analyses of variance [ANOVAs] run; Field, Reference Field2009) and the significance was adjusted to an α level of 0.005. Similarly, an α level of 0.01 was used for the production data. Finally, α = 0.05 was used to test the significance of the ANOVAs on the perception training data.
RESULTS
Comparability of the groups at pretest
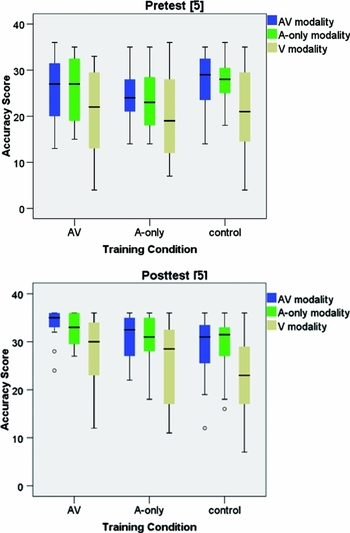
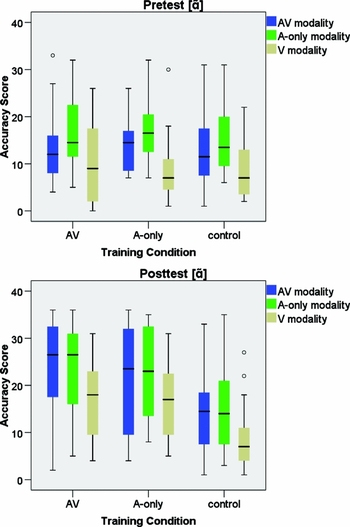
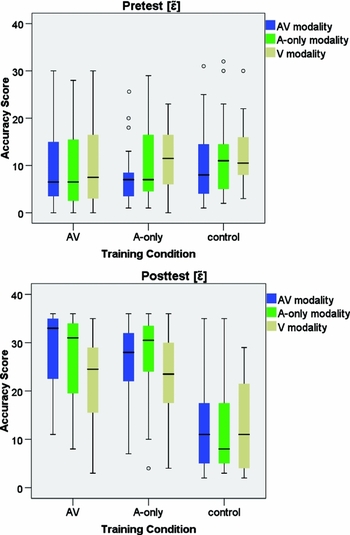
The perception pretest and posttest scores for each modality of presentation and vowel are displayed in Figures 1 to 3. To test whether the three groups were comparable at pretest, a series of repeated-measures ANOVAs was performed for each modality of presentation, with vowel as within-subjects variable and group as a between-subjects variable. The tests revealed no significant differences between the groups at pretest in the A-only modality F (4, 112) = 1.76, p = .142, ηp
2 = 0.06, AV modality F (4, 112) = 0.867, p = .486, ηp
2 = 0.03, and V modality F (3.35, 93.80) = 0.304, p = .875, ηp
2 = 0.01. There was, however, an effect of vowel in all the modalities of presentation: A-only: F (2, 112) = 151.63, p = .000, ηp
2 = 0.73, AV: F (2, 112) = 145.98, p = .000, ηp
2 = 0.72, and V: F (1.67, 98.80) = 65.30, p = .000, ηp
2 = 0.53. The effect sizes of the group effect were small in the AV and V modalities and medium in the A-only modality, while the effect sizes of the vowel effect were large in all modalities. Pairwise comparisons showed significant differences between all the vowels in the three modalities (p = .000). The results of the pretest revealed two different hierarchies of identification of the vowels. In the AV and A-only modalities, L2 learners were better at correctly identifying the vowel [
], followed by [
], and finally [
]. However, in the V modality, [
] was still the most discernible vowel but [
] was found more intelligible than [
].
Boxplots representing the quartile ranges of the accurate perception of [
] at pretest and posttest for each modality of presentation (AV, A-only, V) and training condition (AV, A-only, control). The score is out of 36 and the circles mark outliers.

Boxplots representing the quartile ranges of the accurate perception of [
] at pretest and posttest for each modality of presentation (AV, A-only, V) and training condition (AV, A-only, control). The score is out of 36 and the circles mark outliers.

Boxplots representing the quartile ranges of the accurate perception of [
] at pretest and posttest for each modality of presentation (AV, A-only, V) and training condition (AV, A-only, control). The score is out of 36 and the circles mark outliers.

Analysis of the effectiveness of the training within groups
To assess the effectiveness of training condition, separate repeated-measures ANOVAs were conducted on the pretest and posttest identification scores for the three experimental groups. The variables were time (pre- and posttests), modality (A-only, AV, and V) and vowel (
,
, and
). The results of the control group showed no main effect of time, F (1, 18) = 1.90, p = .184, ηp
2 = 0.09, Time × Modality, F (2, 36) = 0.71, p = .496, ηp
2 = 0.04, and Time × Vowel, F (2, 36) = 0.636, p = .535, ηp
2 = 0.03, indicating that any change in performance for the training groups was due to the training they received. The effect sizes indicate a medium effect for time and small effects for the interaction time and modality, and time and vowel.
For the AV training group, there was a significant main effect of time, F (1, 19) = 55.56, p = .000, ηp
2 = 0.74; modality, F (2, 38) = 18.38, p = .000, ηp
2 = 0.49; and vowel, F (1.43, 27.21) = 40.75, p = .000, ηp
2 = 0.68, all with large effect sizes. The nonsignificant interaction of Time × Modality, F (2, 38) = 2.84, p = .07, ηp
2 = 0.13, indicates that perception gains over time were comparable for the three modalities and that the effect size was medium. Comparisons of posttest performances showed an improvement of 28.94% in the A-only modality, 31.12% in the AV modality, and 22.93% in the V modality. The interactions Time × Vowel, F (1.73, 32.95) = 12.42, p = .000, ηp
2 = 0.39, and Time × Modality × Vowel, F (4, 76) = 5.04, p = .001, ηp
2 = 0.21, were significant, with effect sizes indicating large effects, and post hoc pairwise comparisons showed that [
] improved significantly more (p = .000) than the two other vowels.
For the A-only training group, there was a significant main effect of Time, F (1, 19) = 63.42, p = .000, ηp
2 = 0.76, modality, F (1.27, 24.26) = 23.07, p = .000, ηp
2 = 0.54, and vowel, F (2, 38) = 51.90, p = .000, ηp
2 = 0.73, all with large effect sizes. The nonsignificant interaction of Time × Modality, F (2, 38) = 48.51, p = .08, ηp
2 = 0.12, indicates that, similarly to the AV group, perception did not improve in one modality more than in the other modalities. The effect size was medium. Comparisons of posttest performances showed an increase of 26.18% in the A-only modality, 27.90% in the AV modality, and 21.80% in the V modality, indicating that participants improved in bimodal speech perception even though the training was auditory only. The interactions Time × Vowel, F (1.15, 28.71) = 17.72, p = .000, ηp
2 = 0.48, and Time × Modality × Vowel, F (4, 76) = 5.37, p = .001, ηp
2 = 0.22, were also significant, with effect sizes indicating large effects, and like the AV training group, the perception of [
] improved significantly more than the two other vowels.
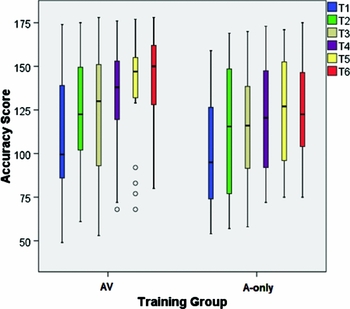
Comparison of training type
Figure 4 shows accuracy scores for the six sessions of training. A repeated-measures ANOVA with time (1 to 6) as within-subjects variable and training group as between-subjects variable was run in order to compare improvement from week to week. The results show that the Time × Training Group interaction was not significant, F (3.20, 121.75) = 1.22, p = .306, and that the effect size was small (ηp 2 = 0.03), but that time was a significant factor, F (3.20, 121.75) = 49.35, p = .000, and the effect size was large (ηp 2 = 0.565). Pairwise comparisons revealed significant score differences between each session (p < .005), except between Sessions 2 and 3 (p = .542), Sessions 4 and 5 (p = .440), and Sessions 5 and 6 (p = 1.000). Thus, the data show that both groups improved in similar ways and kept on progressing despite a few plateaus.
Boxplots representing the quartile ranges of the accurate perception scores for the six training sessions and for both training condition (AV and A-only). The score is out of 178 and the circles mark outliers.

A series of repeated-measures ANOVAs with time (pre- and posttests) and vowel (
,
,
) as within-subjects factors and training group type as between-subjects factor were run to compare the effect of training condition on posttest performances for the three modalities separately. Time was a statistically significant factor in the three modalities, F
A-only (1, 38) = 113.46, p = .000, ηp
2 = 0.74; F
AV (1, 38) = 113.14, p = .000, ηp
2 = 0.75; FV
(1, 38) = 59.14, p = .000, ηp
2 = 0.61, with large effect sizes in all modalities, but the interaction Time × Group was not statistically significant, F
A-only (1, 38) = 0.02, p = .872, ηp
2 = 0.001; F
AV (1, 38) = 0.33, p = .56, ηp
2 = 0.009; and F
V (1, 38) = 0.05, p = .81, ηp
2 = 0.001, although the effect sizes involved were small, indicating that neither of the training types provided greater improvement in perceptual accuracy, but both groups improved.
Vowel was found to be a significant main effect for the three modalities, F A-only (2, 76) = 67.09, p = .000, ηp 2 = 0.64; F AV (1.60, 61.10) = 91.68, p = .000, ηp 2 = 0.71; and F V (1.60, 60.94) = 45.28, p = .000, ηp 2 = 0.54, and the interaction Vowel × Time was also significant, F A-only (1.17, 64.95) = 39.43, p = .000, ηp 2 = 0.51; F AV (2, 76) = 23.73, p = .000, ηp 2 = 0.38; and FV (2, 76) = 8.78, p = .000, ηp 2 = 0.18, indicating that perception of vowels improved from pretest to posttest to differing degrees. These results were associated with large effect sizes. However, no significant effects were found for the interactions Vowel × Group, F A-onl y (2, 76) = 1.32, p = .271, ηp 2 = 0.03; F AV (2, 76) = 0.09, p = .913, ηp 2 = 0.002; and F V (2, 76) = 0.63, p = .533, ηp 2 = 0.02, and Time × Vowel × Group, F A-only (2, 76) = 0.11, p = .89, ηp 2 = 0.003; F AV (2, 76) = 0.53, p = .590, ηp 2 = 0.01; and F V (2, 76) = 0.84, p = .436, ηp 2 = 0.02, and the effect sizes were small, suggesting that accurate perception varied across vowels and improved over time, but the improvement from pretest to posttest was not different between the two groups. Receiving training with audiovisual information did not lead to better perception accuracy at the posttest than receiving audio-only training, even when participants were tested in the AV modality.
Effect of perceptual training on production
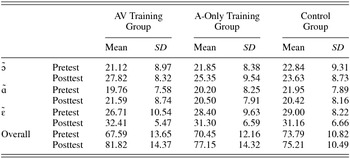
The raters’ pretest and posttest scores were totaled for each participant and mean ratings for each experimental group are displayed in Table 1. A one-way ANOVA with group (AV training, A-only training, control) as between-subjects variable and pretest scores as dependent variable revealed that the three groups were not equal at the pretest, F (2, 6040) = 7.20, p = .001. Bonferroni multiple comparisons indicated that the AV and A-only groups (M = 0.65, SD = 0.48) were comparable at pretest (p = .239) with small effects (d = 0.04), but that the control group (M = 0.068, SD = 0.46) outperformed the AV training group (M = 0.63, SD = 0.48; p = .000) with small effects (d = 0.11).
Mean scores and standard deviation of accurate production at pretest and posttest according to training type and vowel

Note: The results for each vowel are scored out of 36 and the overall results are scored out of 108.
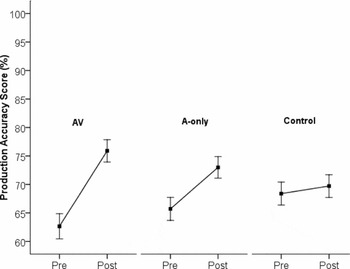
A series of repeated-measures ANOVAs was carried out for each group to test whether training affected pronunciation accuracy. The results revealed an effect of time for the two training groups, F AV (1, 16) = 56.18, p = .000, ηp 2 = .79; F A-only (1, 19) = 5.69, p = .028, ηp 2 = 0.23, with large effect sizes, but not for the control group, F control (1, 18) = 0.632, p = .437, ηp 2 = 0.03, although the effect size was small, indicating that perceptual training led to improvement in production. A visual representation of the improvement is plotted in Figure 5. An effect of vowel was found for the three groups, F AV (2, 32) = 6.12, p = .006, ηp 2 = 0.28; F A-only (2, 38) = 6.99, p = .003, ηp 2 = 0.27, F control (2, 36) = 5.63, p = .007, ηp 2 = 0.24, with large effect sizes, but there was no significant interaction between vowel and time, F AV (2, 32) = 1.54, p = .229, ηp 2 = 0.08; F A-only (2, 38) = 1.32, p = .278, ηp 2 = .06, and F control (2, 36) = 1.86, p = .170, ηp 2 = 0.09, all with medium effect sizes. This indicated that pronunciation accuracy differed across vowels both at pretest and posttest.
The 95% confidence intervals and mean percentage of the learners’ pre-/posttest production scores.

Change scores were computed in order to further tell whether one type of training was better than the other in improving pronunciation. A one-way ANOVA with group as a between-subjects factor and score change as an independent variable showed that there was a significant effect of group, F (2, 5991) = 24.16, p = .000, and a Scheffé post hoc test revealed significant differences across the three groups. The change in improvement was greater for the AV group than for the A-only group (p = .002, with small effect size d = 0.11) and for the control group (p < .001, with small effect size d = 0.22), and the A-only group outperformed the control group (p = .002, with small effect sizes d = 0.11).
In order to see whether the production of some vowels improved more than others did and whether improvement varied across training modalities, a series of one-way ANOVAs followed by Scheffé post hoc tests were run for each vowel separately, with group as a between-subjects factor and score change as a dependent variable. The results revealed that there was a significant effect of group for [
], F (2, 1996) = 15.63, p = .000, with the AV group (M = 0.19, SD = 0.55) improving more than the A-only group (M = 0.10, SD = 0.53), p = .014, d = 0.16, and the control group (M = 0.02, SD = 0.49), p = .000, d = 0.31. The A-only group also outperformed the control group, p = .21, d = 0.15, and all the effect sizes involved were large. The results for [
] showed that there was again a significant effect of group, F (2, 1997) = 3.69, p = .025. The difference in improvement change was not statistically different between the AV group (M = 0.05, SD = 0.64), and the A-only group (M = 0.01, SD = 0.60), p = .59, and between the A-only and the control group (M = –0.04, SD = 0.63), p = .22. However, the AV group's change was significantly greater than the control group's change p = .028, with large effect sizes, d = 0.14. Note that the production performance of the control group actually decreased from pretest to posttest, although the difference was not statistically significant (p = .08). Finally, the results for [
] revealed that there was a significant effect of group, F (2, 1996) = 8.99, p = .000, with the AV group (M = 0.16, SD = 0.44) improving significantly more than the A-only group (M = 0.10, SD = 0.41; p = .046) with a medium effect size (d = 0.13) and outperforming the control group (M = 0.06, SD = 0.41; p = .000) with a large effect size (d = 0.23). The change in improvement was, however, not significant between the A-only group and the control group (p = .18).
DISCUSSION
This study compared the effects of two types of training on the perceptual learning of L2 French nasal vowels and explored whether training that incorporates both visual and audio information led to more improvement than training with audio information only. Overall, the results show that the perceptual identification performance of both training groups increased significantly from pretest to posttest, whereas the perception accuracy of the control group remained unchanged, demonstrating that any change occurring with the trainees was due to the training they received. The results are consistent with previous research showing that it is possible to successfully train L2 learners to modify their perception of audio and visual L2 speech contrasts (e.g., Bradlow et al., Reference Bradlow, Akahane-Yamada, Pisoni and Tohkura1999; Hardison, Reference Hardison2003, Reference Hardison2005; Hazan et al., Reference Hazan, Sennema, Iba and Faulkner2005; Lively et al., Reference Lively, Logan and Pisoni1993).
The results of the perception pretest and posttest also showed that there was an effect of vowel. At the pretest, the hierarchy of accurate perception in the AV and A-only modalities was [
] > [
] > [
], with significant differences between the scores of each vowel. In the V modality, the hyperrounded [
] remained the best perceived vowel, but the unrounded [
] was better perceived than the rounded [
]. A possible explanation accounting for the low accuracy score for [
] is that this vowel occupies the intermediate position on the continuum of labiality developed by Zerling (Reference Zerling1989). It is neither unrounded nor hyper-rounded, and it therefore lacks visual saliency in comparison to the two other nasal vowels.
Despite improvement made by the two training groups in the current study, it is important to note that, contrary to numerous previous studies in AV speech perception, training two modalities (i.e., audio and video) simultaneously was not superior in improving perceptual accuracy to training only one. In particular, learners trained audiovisually did not improve their perception of the vowels in the V modality significantly more than those trained auditorily. Although there was a tendency for the AV training group to receive higher accuracy scores than the A-only training group during the six sessions of training, the differences in scores were not statistically significant. In addition, the two groups improved at a similar rate and in similar fashions, slowing their improvement during Sessions 3, 5, and 6. The possibility that a longer training program (i.e., involving either longer duration per session or additional sessions) would have led to significant differences between the two training groups seems unlikely. In addition, even if we consider that the stop in improvement was just a temporary plateau (because the groups still improved numerically), there is no indication that suggests that the AV training group would have started to improve more than the A-only training group after the sixth training session.
The lack of AV effects in previous studies has sometimes been explained due to the lack of visual saliency between the contrasts under investigation and the mapping of L2 phonemes to L1 categories. For instance, contrary to Hardison (Reference Hardison2003), Hazan et al. (Reference Hazan, Sennema, Iba and Faulkner2005) did not find significant differences between the AV and A-only training groups when tested on the English /r/–/l/ contrast. Similarly, Spanish participants receiving AV training did not perform better than A-only trainees when asked to identify the English /v/–/b/ and /ð/–/d/ contrasts (Ortega-Llebaria et al., Reference Ortega-Llebaria, Faulkner and Hazan2001). Although the reason is still unclear why AV training was not superior to A-only training, the authors proposed that their Spanish participants “may have learnt to disregard certain visual cues to place/manner in their L1” (p. 152). In this scenario, the distinction between the pairs of visemes would therefore not be meaningful, resulting in participants perceiving the two contrastive visemes as one single viseme. In the current study, the situation is novel and not directly comparable because it involves the distinction between, not two consonants, but three vowels. The differences between the three nasal vowels are not only auditorily salient but also visually salient, at least for native speakers, and are shown to belong to three distinct viseme categories (Benoît, Lallouache, Mohamadi, Tseva, & Abry, Reference Benoît, Lallouache, Mohamadi, Tseva and Abry1991; Zerling, Reference Zerling1990). Nevertheless, it is probable that the L2 perceivers were not able to extract relevant visual information because American English does not differentiate between any vowels based solely on rounding.
Another possible explanation for the lack of significant differences between the two types of training in the current study is that attending to two types of information (audio and visual) might have caused an overload of the cognitive processes involved. Contrary to previous training studies investigating two (consonantal) contrasts, exposing L2 learners to three (vocalic) contrasts might have further increased the cognitive load of the task and diminished reliance on one type of information, particularly in this case the visual information. Participants in the AV training group might have found the audio information more helpful for contrasting the three vowels than the visual information, which would explain why their performances were similar to those of the A-only training group.
Studies in L2 acquisition report strong evidence of individual variability due to factors such as personality, aptitude, motivation, learning styles, and learning strategies (Dörnyei & Skehan, Reference Dörnyei, Skehan, Doughty and Long2003). In addition to these personal characteristics, there is also great variability in learners’ lipreading skills (Demorest, Bernstein, & DeHaven, Reference Demorest, Bernstein and DeHaven1996; Summerfield, Reference Summerfield1992) and how individuals integrate visual and auditory information (Grant & Seitz, Reference Grant and Seitz1998). As previously noted by Lisker and Rossi (Reference Lisker and Rossi1992), individual differences in lipreading greatly influence AV speech perception as preferences for an attentional focus on visual or audio information differ across individuals. In their study, the authors noticed that some participants focused mostly on the auditory signal, while others relied heavily on lipreading. Other studies have also highlighted the variability in lipreading behaviors by showing that men relied less on lipreading than do women (Daly, Bench, & Chappell, Reference Daly, Bench and Chappell1996; Johnson, Hicks, Goldberg, & Myslobodsky, Reference Johnson, Hicks, Goldberg and Myslobodsky1988), although this pattern was not observed in the current study.
Another individual factor to take into account is the difference in experience with the L2. In a study investigating the influence of visual cues on the perception of the English /r/–/l/ contrast by Japanese learners in the United States (English as L2), Hardison (Reference Hardison2003) found that AV training was more effective than A-only training. In contrast, in a similar study with Japanese learners of English in Japan (EFL), Hazan et al. (Reference Hazan, Sennema, Iba and Faulkner2005) did not find significant differences between the two types of training. Similarly to Hazan et al. (Reference Hazan, Sennema, Iba and Faulkner2005), the current study took place in a foreign language setting and a possible explanation is that the degree of exposure to the L2 might have an effect on the availability of visual cues, the richness of visual cues due to a wide range of native talkers, and the learning of these cues.
Production experiment
Previous auditory training studies have shown that gain made during perceptual training can be transferred to gain in production (e.g., Bradlow et al., Reference Bradlow, Akahane-Yamada, Pisoni and Tohkura1999, Reference Bradlow, Pisoni, Akahane-Yamada and Tohkura1997; Lambacher et al., Reference Lambacher, Martens, Kakehi, Marasinghe and Molholt2005; Lopez-Soto & Kewley-Port, Reference Lopez-Soto and Kewley-Port2009; Wang, Jongman, & Sereno, Reference Wang, Jongman and Sereno2003) and that AV perceptual training leads to greater improvement in production than A-only training does (Hardison, Reference Hardison2003; Hazan et al., Reference Hazan, Sennema, Iba and Faulkner2005). The findings of this study show support for the superiority of AV training and suggests that participants in the AV training group might have benefited and learned from the provision of visual information even if they did not exploit this information during the perception posttest. The results of the identification task also revealed that at the pretest the L2 learners’ production of [
] was better identified by the native raters than that of [
], while [
] received the lowest accuracy rating. The pattern remained the same at the posttest, with [
] showing the greatest improvement (reaching about 90% accuracy for both training groups) and [
] showing little improvement (increasing from about 55% to 59%). The results of accurate production based on the quality rating task showed similar patterns: [
] was the best rated vowel, followed by [
] and [
].
The current findings suggest that there is some link between L2 speech perception and production and, therefore, provide evidence that speech perception and production are interdependent. In addition, as shown in the current study, the improvement in pronunciation for the AV training group was greater than the improvement of the A-only training group, although the performance of the two groups did not differ at the perception posttest. This suggests that the development of the AV trainees’ production abilities did not occur linearly with the development of their perception abilities. The relationship between perception and production is still not clear, and while some studies suggest that the development of L2 speech perception precedes the development of L2 production (Escudero, Reference Escudero2005; Flege, Reference Flege, Heubner and Ferguson1991; Kleber, Harrington, & Reubold, Reference Kleber, Harrington and Reubold2011; Rochet, Reference Rochet and Strange1995), others provide evidence that speech production can precede speech perception (Bohn & Flege, Reference Bohn, Flege, James and Leather1997; Borden, Gerber, & Milsark, Reference Borden, Gerber and Milsark1983; Gass, Reference Gass1984; Goto, Reference Goto1971; Sheldon & Strange, Reference Sheldon and Strange1982; Smith, Reference Smith, Bonch-Bruevich, Crawford, Hellermann, Higgins and Nguyen2001; Yamada, Strange, Magnuson, Pruitt, & Clarke, Reference Yamada, Strange, Magnuson, Pruitt and Clarke III1994; Zampini & Green, Reference Zampini, Green and Nicol2001). In a study investigating voicing by Spanish English as L2 learners, Zampini and Green (Reference Zampini, Green and Nicol2001) found that learners showed a short voice onset time in production before they were able to perceive it. Similar findings were noted with Japanese learners of English producing the English /r–l/ contrast before perceiving it accurately (Sheldon & Strange, Reference Sheldon and Strange1982; Smith, Reference Smith, Bonch-Bruevich, Crawford, Hellermann, Higgins and Nguyen2001). A study on the perception and production of vowels by Korean L2 learners found that perception did precede production for most of the learners, but highlighted some individual differences that are worth mentioning here (Baker & Trofimovich, Reference Baker and Trofimovich2006). The authors reported that the perception/production relationship seemed to depend on the length of residence of the L2 learners, and noted that “perception and production may be aligned at initial and more advanced stages of L2 learning. However, in the intermediate stages of L2 learning (where presumably most of the learning occurs), perception and production skills are misaligned” (p. 246). This is particularly relevant to the current study because the participants were intermediate learners of French. Their proficiency and their exposure to the L2 might therefore account for the misalignment between their perception and production skills. Finally, a complementary possibility is that the perception task invited explicit reasoning more than the production task did, and that conscious knowledge may sometimes have interfered with performance during the perception task.
Conclusion
The purpose of this study was to compare the effects of two types of perceptual training on the perception and production of L2 French nasal vowels. This study has contributed to research in AV speech perception by providing empirical data showing that training that involved both audio and visual information did not lead to greater improvement in perception than did auditory-only training, but did lead to greater improvement in production. This suggests that the AV trainees used the visual information provided during training and transferred this information to improve their production abilities and provides implications for language learning. Nevertheless, the current results are limited to the three French nasal vowels and to a visual contrast based on lip rounding/spreading. Future studies should expand the investigation of multimodal training by looking at a greater range of vowel contrasts, a greater range of L1s and L2s, and a greater range of L2 proficiency.
ACKNOWLEDGMENTS
This study was funded by a Language Learning Dissertation Grant and a Graduate School Dissertation Completion Fellowship from Michigan State University. Parts of this article were presented at SLRF 2013, New Sounds 2013, and PSLLT 2014. I extend my gratitude to the students who participated in this study. I am also grateful to Debra Hardison, Aline Godfroid, Shawn Loewen, Anne Violin-Wigent, and one anonymous Applied Psycholinguistics reviewer for their constructive comments on earlier versions of this paper. Any errors, however, are my own.