Implications
The design of the reference population is fundamental to maximizing the benefits of genomic selection (GS). Currently, most of the genotyped animals are sires; however, the number of sires available in some populations might not be enough to make an appropriate genomic evaluation. This study presents an optimal genotyping design that includes females in the reference population, suggesting that two-tailed strategies are preferable to increase the reliability of GS in small cattle populations.
Introduction
Genomic selection (GS) is the most promising tool that has emerged for increasing the genetic gain rate in livestock (Weigel et al., Reference Weigel, Van Tassell, O′Connel, VanRaden and Wiggans2010). Genetic evaluations that use genomic information aim to increase the accuracy of breeding value predictions. Genomic evaluations have focused mainly on sire estimated breeding value (EBV) predictions that use daughter yield deviations (DYDs) as the response variable in reference populations because sires have a larger impact on breeding programs than cows, and their DYDs are more accurate than cow phenotypes (Calus, Reference Calus2009).
In genomically assisted evaluations, a reference population is needed to estimate marker effects that account for linkage disequilibrium (LD) between markers and quantitative trait loci (QTL). The characteristics of the training population, for example, its size or the selection of animal genotyped, are important for increasing the accuracy of genomic predictions (Hayes et al., Reference Hayes, Bowman, Chamberlain and Goddard2009; VanRaden et al., Reference VanRaden, Van Tassell, Wiggans, Sontegard, Schnabel, Taylor and Schenkel2009a). There are challenges in reaching sufficiently high predictive accuracy, especially in small populations and particularly for low-heritability traits (VanRaden et al., Reference VanRaden, Wiggans, Van Tassell, Sontegard and Schenkel2009b). In most countries, only sires have been genotyped and included in the reference population (Loberg and Dürr, Reference Loberg and Dürr2009), because bulls drive the genetic structure of the population and provide high predictive accuracy because of the large amount of information from their daughters’ averages. In some countries, however, there are a limited number of sires that have been progeny tested, and this hampers the accuracy of the predictions in test populations (VanRaden et al., Reference VanRaden, Wiggans, Van Tassell, Sontegard and Schenkel2009b); thus, alternative strategies are required.
For instances, international collaborations for joining different populations have helped to increase population sizes (Wiggans et al., Reference Wiggans, Sonstegard, VanRaden, Matukumalli, Schnabel, Taylor, Chesnais, Schenkel and Van Tassell2008; Cromie et al., Reference Cromie, Berry, Wickham, Kearney, Pena, Van Kaam, Gengler, Szyda, Schnyder, Coffey, Moster, Hagiya, Weller, Abernethy and Spelman2010; Lund et al., Reference Lund, de Roos, de Vries, Druet, Ducrocq, Fritz, Guillaume, Guldbrandtsen, Liu, Reents, Schrooten, Seefried and Su2010).
GS can be enhanced using female genotypes because economically important traits are measured in the female population, and cows comprise the largest proportion of the Holstein population. In addition, increasing attention has been directed at recording functional traits, particularly health traits. Female reference populations for GS of those new phenotypes could be feasible (Ducrocq and Santus, Reference Ducrocq and Santus2011). Dominant and epistatic effects can be captured and exploited. The relationship between the genotype and phenotype of a cow is expected to be stronger than the relationship between a sire's genotype and his daughter phenotypes. Currently, in some genomic programs, the best females, which are candidates for bull dams, are being genotyped (Loberg and Dürr, Reference Loberg and Dürr2009). However, with large numbers of selection candidates in the female population, a preselection of genotyped animals is needed to optimize genotyping costs (Blonk et al., Reference Blonk, Komen and van Arendonk2010). Selective genotyping of the most informative individuals might increase genotyping efficiency (Spangler et al., Reference Spangler, Sapp, Bertrand, Mac Neil and Rekaya2008; Sen et al., Reference Sen, Johannes and Broman2009). However, there has been very limited research as to which animals are most informative in terms of single-nucleotide polymorphism (SNP) effects and genomic predictions when females are used in the reference population.
The aim of this study was to evaluate female-selective genotyping strategies using simulation and to increase the predictive accuracy of genomic breeding values (GBVs) in populations that have a limited number of sires with large number of progeny.
Material and methods
Simulations
Phenotypes and genotypes were simulated to mimic a dairy cattle population based on 996 progeny-tested sires and 40 000 dams. These recorded and genotyped animals were used to select different training populations in GS programs.
The simulation was performed with the QMSim software (Sargolzaei and Schenkel, Reference Sargolzaei and Schenkel2009) using the following parameters: 1000 historical generations were generated to produce a realistic level of LD similar to that obtained for the currently used 50-K SNP chip.
LD, the nonrandom association of alleles between two loci, was measured using the r 2 parameter (Hill and Robertson, Reference Hill and Robertson1968). LD can be estimated using other measurements, such as D, D′ or different measures based on the χ 2-statistic (Zhao et al., Reference Zhao, Nettleton, Soller and Dekkers2005); however, r 2 is the most common measure of LD for biallelic markers, and it is less sensitive to the effects of allelic frequency (Sargolzaei et al., Reference Sargolzaei, Schenkel, Jansen and Schaeffer2008).
The first historical population was composed of 1000 females and 400 males. During the 1000 historical generations, the population size decreased from 1400 to 400 individuals with the same sex ratio, which mimicked a bottleneck and a decrease in the effective number (Ne) to account for the evolution of the historical Holstein effective population size (Hayes et al., Reference Hayes, Visscher, Mcpartlan and Goddard2003; Sørensen et al., Reference Sørensen, Sørensen and Berg2005). Previous simulation studies have used a similar Ne (e.g. Meuwissen et al., Reference Meuwissen, Hayes and Goddard2001). Following the bottleneck, historical population size was extended for 40 added generations. Further, 20 000 females and 300 males from the last historical generation were used as founders. Similar strategies (shrinkage and expansion of the population) have been used in simulations of dairy cattle populations (De Roos et al., Reference De Roos, Hayes and Goddard2009; Habier et al., Reference Habier, Dekkers and Fernando2009).
From this founder population and based on BLUP (best linear unbiased prediction) EBVs, 15 overlapping generations of selection were simulated as contemporary born animals. The population was under random mating between selected animals, and the average sex ratio was 0.5. During the 15 periods of selection, 51 out of 300 tested sires were selected as proven bulls (17%), and 9000 out of 20 000 of the dams were culled (45%). Selection and culling criteria were based on EBVs. Individuals from the next offspring replaced culled animals. This overlapping active population was used to mimic a scaled representation of a dairy cattle population having higher selection intensity in males than in females. Individuals from progeny sets 10 through 15 were genotyped and used to create the training and validation sets. Genotyped animals had at least 10 generations of traditional selection and pedigree depth.
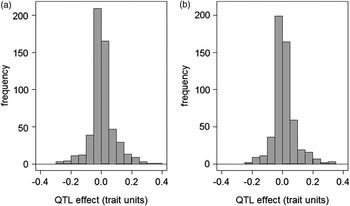
The simulated genome consisted of 30 chromosomes (100 cM each), and the recombination rate was adjusted to this distance. With the objective of obtaining a desired LD between adjacent SNPs, 9990 biallelic markers were equally spaced out over the genome. Additive genetic effects were determined by 90 QTL that were simulated and randomly distributed along the genome. QTL effects were generated based on a gamma distribution with a shape parameter equal to 0.4 (Hayes and Goddard, Reference Hayes and Goddard2001; Meuwissen et al., Reference Meuwissen, Hayes and Goddard2001). QTL allelic effects were first sampled from the gamma distribution in such a way as to be positive or negative with a probability of 0.5. As expected, most of the QTL had a small effect, but others had a large effect. The mutation rate was fixed at 2.5e−5, and the number of crossovers was sampled from a Poisson distribution with positions randomly distributed. The new variants and the selection process, as well as drift and Bulmer effects, modified the genetic variance. True breeding values (TBVs) were calculated by summing all QTL effects and were subsequently scaled to a realized genetic variance of 1. Distributions of the QTL effects of the traits are shown in Figure 1.
Distribution of simulated QTL effects: (a) 0.30 heritability trait scenario and (b) 0.10 heritability trait scenario.

The simulation study included two scenarios in terms of heritability (0.10 and 0.30). For each animal from sets 10 through 15, pedigrees, TBVs, phenotypes and genotypes were simulated, and breeding values were estimated. Analyses were performed on 10 replicates (five per trait), and the strategy and sizes of the training sets were designed to be sufficient for the aim of the study.
Selective genotyping strategies
Animals from progeny sets 11 through 14 represented a contemporary overlapping active population of 40 000 females. From them, 1000, 2000 and 5000 females were selected and genotyped as training sets on the basis of the following strategies:
-
1. At random (RND) – females were randomly selected from the available population (generations 11 through 14).
-
2. Two-tailed yield deviation values (TTYD) – an equal number of females were selected from the lowest α/2 and the highest (1−α/2) percentiles of the yield deviation distribution (for α = 0.025, 0.05, and 0.125).
-
3. Two-tailed EBVs (TTBV) – this subset represented a selection of females that had estimated breeding values in the lowest α/2 and highest (1−α/2) percentiles of the distribution (for α = 0.025, 0.05 and 0.125).
-
4. Highest yield deviation values (TopYD) – in this strategy, cows that had yield deviations in the 1−α percentile (for α = 0.025, 0.05 and 0.125) were selected.
-
5. Highest EBVs (TopBV) – cows that had estimated breeding values in the 1−α percentile (for α = 0.025, 0.05 and 0.125) were selected.
Genotyping strategies based on animals selected by their breeding values were included to evaluate the information provided by the pedigree and its effects on the accuracy of the genomic evaluation relative to the TBVs.
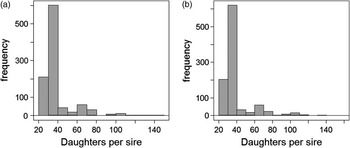
As a reference, all sires (996) from progeny sets 10 through 13 were genotyped (siresDYD). The distribution of family sizes showed values consistent with a dairy population of 40 000 contemporary cows (Figure 2).
Distribution of the number of daughters per sire in (a) 0.30 heritability trait scenario and (b) 0.10 heritability trait scenario.
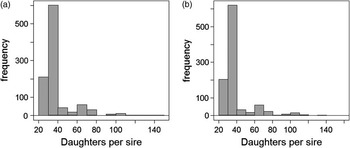
For each selection period, sires with higher EBVs were allowed to breed a new crop of progeny. Sires that had fewer than 40 daughters represented discarded progeny-tested bulls that were excluded after their first crop of daughters. In each period, 17% were proven bulls; González-Recio et al. (Reference González-Recio, Ugarte and Alenda2005) reported a similar value for successful progeny-tested bulls in a progeny test program in Spain.
DYD was used as a dependent variable in the analysis of the SiresDYD strategy. When training and testing data sets overlap, evaluations of realized accuracies for genomic predictions can result in overconfidence (Amer and Banos, Reference Amer and Banos2010); therefore, to avoid overlap between training and testing subsets, males of progeny sets 14 and 15 were excluded from the analysis. In addition, the records from cows from the last crop of daughters (15) were excluded from the estimates of DYD, as these animals were included in the validation set. To account for different accuracies in the DYD estimations, these values were weighted by their prediction error variances in terms of number of daughter equivalents (VanRaden and Wiggans, Reference VanRaden and Wiggans1991).
Genomic evaluation model
The Bayesian version of the LASSO method (de los Campos et al., Reference De los Campos, Naya, Gianola, Crossa, Legarra, Manfredi, Weigel and Cotes2009) was used to estimate SNP coefficients in the training populations. The response variable in the female strategies were the yield deviations, which are a result of a combination of a cow's genetic and residual values. Fixed effects were not simulated. The yield deviation was used as a dependent variable in the evaluation of all of the female-based selective genotyping strategies, including the strategies in which selection was based on breeding values. A single chain of Gibbs sampling was run using 10 000 iterations and a burn-in period of 2500. Convergence was checked visually.
Accuracy of genomic evaluations
Accuracy is a common measurement of predictive ability (Goddard and Hayes, Reference Goddard and Hayes2007; Luan et al., Reference Luan, Woolliams, Lien, Kent, Svendsen and Meuwissen2009) in genetic prediction studies. Accuracy was quantified using Pearson correlations between the predicted GBV and TBVs simulated for generation 15. Means and standard deviations after five replicates were calculated for each strategy and trait.
Bias and mean square error (MSE)
TBVs were known in the simulation. The average difference between the true and the predicted GBVs in the testing population provided a measure of the bias in the genomic predictions for each selective genotyping strategy. MSE of the estimator was calculated as prediction error. MSE was used as a risk function to quantify differences between the estimator and the true value.
In addition, regression coefficients of TBVs on estimated GBVs were estimated, and averages and standard deviations of intercepts, slopes and coefficients of determination were calculated for all considered strategies and sample sizes. Regression coefficients are usually considered as bias predictors when TBVs are not known.
Results
Simulated population
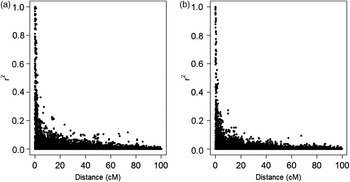
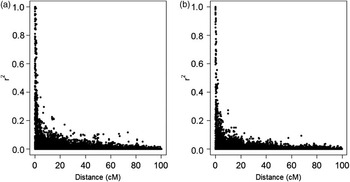
In both scenarios (heritability either 0.10 or 0.30), the average LD (r 2 between adjacent markers) in generations 11 through 15 (training and testing sets) was 0.31. High LD values were observed only at small distances between pairs of SNPs (Figure 3). All chromosomes were simulated using the same parameters, and therefore differences between them were not expected.
Distribution of r 2 between single-nucleotide polymorphism (SNP) pairs and physical distance: (a) chromosome 1 for the 0.10 heritability trait and (b) chromosome 7 for the 0.30 heritability trait.
In the medium- and low-heritability scenarios, the average inbreeding coefficients in the last generation were 0.03 and 0.05, respectively, and the average accuracies of the pedigree indexes were 0.35 (s.d. = 0.05) and 0.41 (s.d. = 0.04), respectively.
Accuracy of genomic evaluations
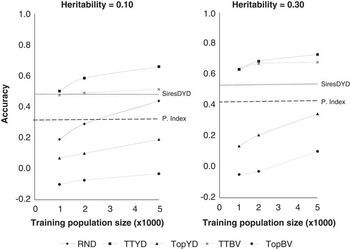
The accuracy of genomic evaluations depended on the selective genotyping strategy used for the training set (Figure 4).
Estimated accuracies for genomic breeding values for two different heritabilities (0.10 and 0.30) in testing sets when 1000, 2000 or 5000 females in the training set were genotyped. The following genotyping strategies were used: cows at random (RND), top yield deviation cows (TopYD), top breeding value cows (TopBV), two-tailed yield deviation cows (TTYD), two-tailed breeding value cows (TTBV), all sires (SiresDYD) and pedigree index without genomic selection.
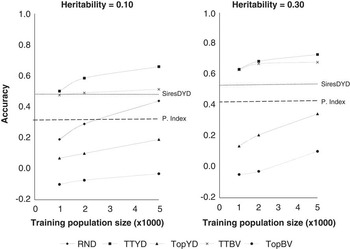
The predictive accuracy of the medium-heritability trait was greater than the accuracy of the low-heritability trait. As the size of the training populations increased, accuracies reached upper limits of ∼0.75 (h 2 = 0.30) and ∼0.70 (h 2 = 0.10). In the low- and medium-heritability traits, the accuracies of the SiresDYD strategy were 0.48 and 0.55, respectively, which indicated 37% and 34% increases, respectively, in accuracy relative to the accuracies of the pedigree indexes (0.35 and 0.41, respectively).
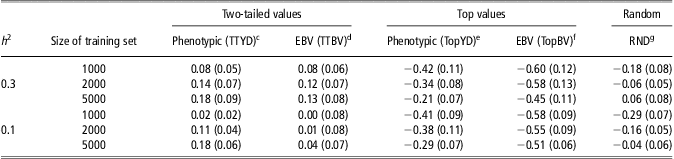
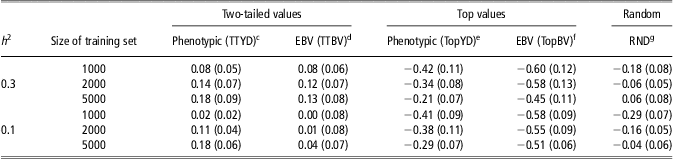
Only the TTYD and TTBV strategies produced predictive accuracies that were better than those of the SiresDYD strategy (Table 1). When 1000 cows were genotyped as training set, in the TTYD strategy, the accuracies for low- and medium-heritability traits were 0.50 and 0.63, respectively. In the TTBV strategy, the corresponding values were 0.48 and 0.63.
Average differences in the accuracy of predicted GBVs and standard deviations (in parenthesis) for each selective genotyping strategya v. the SiresDYDb strategy based on the heritability and use of different female training sets and population sizes from a contemporary population of 40 000 animals
GBV = genomic breeding values; TTYD = two-tailed yield deviation values; EBV = estimated breeding values; TTBV = two-tailed EBV; TopYD = highest yield deviation values; TopBV = highest EBV; RND = random.
aGenotyping strategies for the training set.
bResults are compared with a male genotyping strategy (SiresDYD), which genotypes all sires in the population as the training set (accuracies of the SiresDYD strategy were 0.48 and 0.55 for the 0.10 and 0.30 heritability traits, respectively).
cTTYD (females with yield deviation in the α/2 and 1−α/2 percentile)h.
dTTBV (females with EBVs in the α/2 and 1−α/2 percentile)h.
eTopYD (females with yield deviation in the 1−α percentile)h.
fTopBV (females with EBVs in the 1−α percentile)h.
gRND (females selected at random)h.
h(for α = 0.025, 0.05 and 0.125).
In both the low- and medium-heritability scenarios, the use of two-tailed strategies yield deviations data from generations 11 through 14, as criteria for the selection of animals in the training set produced the highest predictive accuracy regardless of the size of the training population. In all of the strategies, accuracy improved as the number of records in the training set increased. When the size of the training set increased from 1000 to 5000 genotyped cows, the RND strategy produced a greater increase in accuracy than the other strategies. Nevertheless, the accuracies of the RND strategy were always less than those produced by the two-tailed strategies. The accuracy of the RND strategy was greater than that of the SiresDYD strategy only when 5000 cows were genotyped as the training set in the medium-heritability scenario.
Strategies based on the best females (TopYD and TopBV) produced the lowest accuracies, and at small training population sizes the Top strategies produced negative values.
The heritability of the trait affected accuracy (Goddard and Hayes, Reference Goddard and Hayes2009). The populations in our study required more than 5000 cows (12.5% of the simulated population) in the training set to achieve accuracy higher than 0.66 in the low-heritability scenario.
Bias and MSE
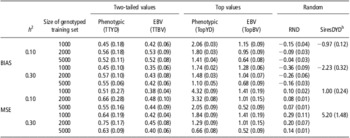
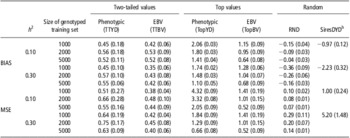
Pedigree index predictions were biased in 0.01 trait units, which was lower than the values from the genomic predictions. The female-based selective genotyping strategies exhibited biases that were between those of the SiresDYD and the pedigree index (Table 2). Strategies that selected top animals only, including SiresDYD, produced more biased estimates than the other strategies (e.g. the SiresDYD strategy produced −0.97 and −2.23 for the low- and medium-heritability traits, respectively). The TopYD strategy produced the most biased estimate for the 0.10 heritability trait, and it gave the second-most biased prediction (after SiresDYD) for the 0.30 heritability trait (bias = 1.74). In the Top and Random strategies, increases in the size of the training population reduced the bias. The RND strategy showed bias equal to 17% of that found in the SiresDYD strategy.
Biasa and MSE of genomic predictions in the testing set for different genotyping strategies, training set size and heritability
MSE = mean square error.
aBias measured as the difference between estimated and true breeding values (in genetic value units).
bGenotyped training set size = 996 animals for the siresDYD strategy.
The biases in the two-tailed strategies were ∼50% and 75% lower than those in the SiresDYD with the same training set size (Table 2). In the two-tailed strategies, an increase in the number of animals in the training set did not substantially reduce the bias. All but the RND and SiresDYD strategies overestimated the breeding values. To calculate DYD, the SiresDYD strategy used the records from the entire female population, whereas the Top strategies selected only the cows in the upper tail of the distribution, which might be why the SiresDYD showed a bias that was more similar to the RND strategy. Similar patterns were apparent in the MSE; the RND and two-tailed strategies produced the lowest MSE. The MSE of the RND strategy was similar to that of the pedigree index and lower than that of the SiresDYD strategy with the same training set size.
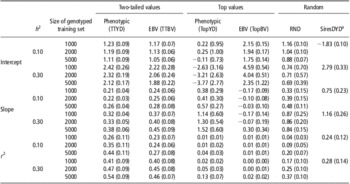
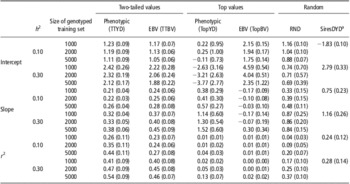
In addition to bias results, regression coefficients of TBV on estimated GBVs were calculated (Table 3). Because of large differences between replicates for the ‘Top’ strategies, due to low accuracy, mean values across replicates were not informative.
Averages and standard deviations of intercepts, slopes and coefficients of determination of genomic predictions in the testing set, for different genotyping strategy, training set size and heritability regressions
aGenotyped training set size = 996 animals for the siresDYD strategy.
All strategies showed values different from 0 for the intercept and from 1 for the slope regression as expected for unbiased predictions. In both cases, RND strategies were less deviated from the expected values than the TTBV and TTYD strategies. Finally, in the comparison between SiresDYD and two-tailed strategies, averaged intercept estimation was closer to that expected for TTBV and TTYD, whereas the slopes of SiresDYD strategies were notably closer to 1 than the slopes of the two-tailed strategies.
Discussion
Parameters of the simulated population
Quality control of the simulation before genomic evaluations was based on the LD between adjacent markers, the level of decay in LD with respect to the distance between SNPs, inbreeding values and the accuracy of traditional genetic evaluations. Simulated values were compared with Holstein real data. The average LD between adjacent markers in dairy cattle is related to the accuracy of GS. Values of r 2 between 0.20 and 0.31 have been reported for different populations (Banos and Coffey, Reference Banos and Coffey2010; Habier et al., Reference Habier, Tetens, Seefried, Lichtner and Thaller2010). LD values estimated in our simulation were similar to the values reported in Holstein cattle in North America (Sargolzaei et al., Reference Sargolzaei, Schenkel, Jansen and Schaeffer2008). The level of decay in LD with respect to the distance between SNPs was also similar to the results observed in real populations (De Roos et al., Reference De Roos, Hayes, Spelman and Goddard2008; Sargolzaei et al., Reference Sargolzaei, Schenkel, Jansen and Schaeffer2008).
Inbreeding values of the simulation were in the range of those reported in real dairy cattle populations (Kearney et al., Reference Kearney, Wall, Villanueva and Coffey2004; González-Recio et al., Reference González-Recio, Alenda, Chang, Weigel and Gianola2006; González-Recio et al., Reference González-Recio, López de Maturana and Gutiérrez2007). Finally, the accuracies of the genetic evaluations were within the range of values reported for many traits in dairy cattle populations (González-Recio and Alenda, Reference González-Recio and Alenda2005; VanRaden et al., Reference VanRaden, Van Tassell, Wiggans, Sontegard, Schnabel, Taylor and Schenkel2009a).
Accuracy of genomic evaluations
Differences between the pedigree index of traditional genetic evaluation and the SiresDYD genomic strategy were considered to be part of the simulation quality control. These results were similar to those reported in North American Holstein bulls (VanRaden et al., Reference VanRaden, Van Tassell, Wiggans, Sontegard, Schnabel, Taylor and Schenkel2009a).
In the female-based strategies, the accuracies achieved using the two-tailed strategies (TTYD and TTBV) were greater than those obtained using the pedigree index, even at the smallest population size (1000). Compared with the SiresDYD strategy, the accuracies for the low- and medium-heritability traits derived from TTYD were 38% and 55% higher, respectively, but these increases were at the expense of an increase in the training population size from 1000 to 5000 animals. Two-tailed selections could be compared with the use of divergent lines in QTL detection and genome-wide association studies. The use of extreme samples appears to enhance the ability of selection procedures to select influential SNPs in genetic association studies. Higher accuracies reached by two-tailed strategies are consistent with a broiler mortality study by Long et al. (Reference Long, Gianola, Rosa, Weigel and Avendaño2009), who arrived at similar conclusions.
The TopYD and TopBV strategies required a large number of animals to produce accuracies similar to those produced by the other strategies, which suggests that the TopYD and TopBV strategies were the least informative and should not be used to create a training population. Lower accuracies of Top strategies compared with RND have also been found by Ehsani et al. (Reference Ehsani, Janss and Christensen2010), who compared different selective genotyping strategies and concluded that the selection of the best individuals does not provide good predictions compared with random selection.
Accuracy increased with the reference population size. This phenomenon has also been observed in previous simulations (Goddard and Hayes, Reference Goddard and Hayes2009). In real populations, Lund et al. (Reference Lund, de Roos, de Vries, Druet, Ducrocq, Fritz, Guillaume, Guldbrandtsen, Liu, Reents, Schrooten, Seefried and Su2010) reported average reliability (square of accuracy) increases of between 8% and 11%. These results were obtained when the number of bulls in the training set was increased from the size of national training sets to the 15 966 shared genotypes of the EUROGENOMICS consortium (Holland, Finland, Sweden, Denmark, France and Germany).
The strategies based on yield deviations were more accurate than those that used EBVs as the selection criteria, which might be because of the low accuracy of the EBVs in cows. In the presence of epistasis and dominant effects, the strategies based on yield deviations might produce better results for the commercial population if the method can identify these effects. The dairy cattle industry might be interested in exploiting these effects in commercial populations, although dominance is not inherited and only part of the epistatic variance is transmitted to progeny.
Our study was based on a single trait rather than on multiple breeding objectives. Genetic evaluations are carried out for several traits, but only some of these traits explain the success of sires in the breeding program; for example, udder composite is the key trait in sires’ dams (González-Recio et al., Reference González-Recio, Ugarte and Alenda2005). Selection of different breeding goals may be reduced to a productivity–functionality index selection for two or three traits. The extreme individuals exhibiting both traits should be genotyped. Nevertheless, the genotyping cost for the least profitable individuals must be carefully considered.
Bias and MSE
The results from this study show that genotyping random females in the population leads to smaller biased predictions and MSE in the genomic-assisted evaluations. Genotyping only the top animals of the population, including sires, may lead to greater bias and MSE. Regression coefficients of TBVs on GBVs were not equal to 1. However, SiresDYD coefficients were in the range of similar values reported by other authors with real data of small dairy cattle populations (Olson et al., Reference Olson, VanRaden, Tooker and Cooper2011). Female strategies showed low values, which could represent a potential problem in the application of female base genomic EBV. To deal with that problem, larger reference population sizes produce less bias and MSE. The RND strategy always achieved the smallest bias estimates. It must be pointed out that strategies that produced the more accurate predictions (TTYD, TTBV) also showed larger bias than the RND strategy. This is an interesting result for numerically small populations or when the economic resources for genotyping are limited. The genotyping strategy would need to focus either on maximizing accuracy or minimizing bias. The best strategy would depend on the purpose and organization of the breeding program. For instance, if comparison between non-contemporaneous animals has to be made, the two-tailed strategies may have some drawbacks, but they will maximize the genetic gain. The two-tailed genotyping strategies showed smaller bias and MSE than the SiresDYD strategies, suggesting that they might be interesting genotyping designs in numerically small populations. In addition, Patry and Ducrocq (Reference Patry and Ducrocq2009) detected bias using GS and an underestimation of the breeding values when they were estimated based on preselected genomic animals. This source of bias does not affect our results, as the selection was based on traditional breeding values. The estimation methodology and the model could be a source of bias in this study.
Conclusions
In small cattle populations, two-tailed selection of females might be an advantageous strategy to create the training population in a genomic program, in terms of predictive ability, although at the expense of larger bias, mainly with small reference population sizes.
Random selection may be advisable for larger populations because of lower bias estimations. In addition, selection based on yield deviations rather than on EBVs might be preferable. However, strategies based on genotyping only the best cows (e.g. sires’ dams) performed poorly.
A combination of two-tailed strategies based on the female population and the current male genotyping strategy should be considered, although the method to combine the DYD from sires and the yield deviations of cows must be developed.
All genotyping strategies considered based on genotyping the best animals resulted in biased evaluations, but largest bias was found for the ‘sireDYD’ strategy.
Acknowledgments
The authors acknowledge funds from the project CDTI-P080250866 UPM-INIA, and thank Beatriz Villanueva, Miguel Angel Toro and Agustín Blasco for helpful comments and suggestions.