

Introduction
Indian siris, Albizia lebbeck (L.) Benth. (Fabaceae), is probably native to tropical and subtropical Asia and East Africa, but introduced and planted all over the tropics (Atiq-ur-Rehman and Iqbal, Reference Atiq-ur-Rehman and Iqbal2010). The plant is cultivated in parks and other urban green landscapes, and around roads and industrial areas of Ahwaz, the capital of Khuzestan Province in southwest Iran. The oriental red mite, Eutetranychus orientalis Klein (Acarina: Tetranychidae), is principally a pest of citrus, but has also been reported to attack a wide variety of other plants including Albizia spp. (Walter et al., Reference Walter, Halliday and Smith1995). The pest severely attacks the leaves of A. lebbeck in the green landscapes of Ahwaz. The infested leaves turn yellowish-brown, dry up and ultimately fall off. Mite infestation is usually seen on the upper surface of leaves, under heavy webs to which dust particles adhere. The infested leaves also get crumpled. Web formation, adhered dust particles and continuous cell sap sucking badly affect the photosynthesis process, leading to retarded growth and reduced vigour of the host plants (Yousef et al., Reference Yousef, Chouhan and Guptan2006).
Decision-making processes in an integrated pest management programme are based, among others, on information about the pests' density and spatial distribution (Messing and Aliniazee, Reference Messing and Aliniazee1989; Pedigo, Reference Pedigo2002). Analysis of the spatial distribution pattern is a necessary procedure for arthropod population studies and provides basic information for designing efficient and cost-effective sampling plans for population estimation and pest management (Madadi et al., Reference Madadi, Dashti and Enkegaard2011). The present study was conducted to determine the seasonal population dynamics and the spatial distribution of E. orientalis on A. lebbeck in the green landscapes of Ahwaz, Iran.
Materials and methods
Experimental design
The experiments were carried out from June 2010 to June 2011 in the Dolat Park of Ahwaz, southwest Iran. The park includes 96 A. lebbeck trees that are 10–20 years old. No insecticide or acaricide treatments were applied during the trial period. Irrigation and fertilization of the plants were done according to the recommendations of the park administration.
Seasonal population dynamics of E. orientalis
Population monitoring of E. orientalis was performed monthly using direct counts of the mite developmental stages on leaf surfaces. On each sampling date, ten trees were randomly selected. From each selected tree, five leaves from different layers (top, middle and bottom) from each main side of the tree canopy (north, south, east and west) were randomly chosen and transferred to the laboratory. In the laboratory, nymphal and adult stages of the mite were counted under a stereomicroscope.
Spatial distribution of E. orientalis
The spatial distribution of the mite on A. lebbeck was evaluated using Taylor's power law. It describes the regression between the logarithm of population variance and the logarithm of population mean according to the following equation:
 $$\begin{eqnarray} \end{eqnarray}$$
where S 2 is the population variance,  $$\overline{ X } $$ is the population mean, a is the Y intercept and b is the slope of the regression line. This equation can be transformed as follows:
 $$\begin{eqnarray} \end{eqnarray}$$
where a is the antilogarithm of a and constitutes a scaling factor depending on the sampling unit and b is an index of organism species' spatial pattern, with b< 1, b= 1 and b>1 indicating uniform, random and aggregated spatial patterns, respectively (Southwood, Reference Southwood1978; Tomanocovic et al., Reference Tomanocovic, Kavallieratos and Athanassiou2008). Also, the correlation coefficient (r) was calculated as an indicator of the goodness-of-fit of Taylor's power law. A two-tailed t-test at n− 2 df was conducted to determine whether the slope and correlation coefficient values of the regression relation differed significantly from 1 and 0, respectively (Snedecor and Cochran, Reference Snedecor and Cochran1980).
Data analysis
Analysis of variance was performed to compare the population densities of E. orientalis at different heights and sides of the canopy of A. lebbeck plants. A Pearson's χ2 test (α = 0.05) was conducted to assess the goodness-of-fit of mite density to temperature and humidity. All analyses were carried out using SPSS software version 16 (SPSS Inc., Chicago, Illinois, USA).
Results
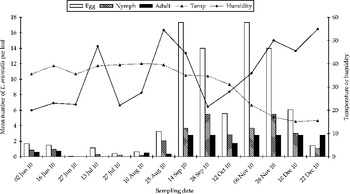
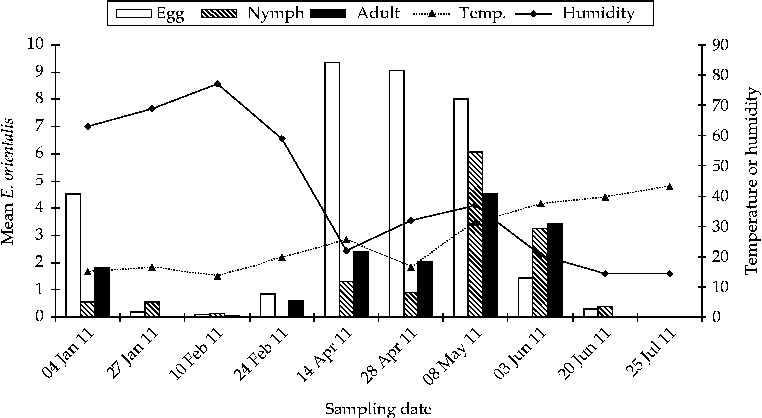
Seasonal population dynamics of E. orientalis on A. lebbeck and temperature and humidity fluctuations during 2010 and 2011 are shown in Figs 1 and 2, respectively. The mites had two activity periods on A. lebbeck: The first and second activity periods were observed during 10 August to 28 October 2010 and 24 February to 20 June 2011, respectively.
Seasonal population dynamics of Eutetranychus orientalis on Albizia lebbeck and fluctuations of temperature (°C) and relative humidity (%) during 2010

Seasonal population dynamics of Eutetranychus orientalis on Albizia lebbeck and fluctuations of temperature (°C) and relative humidity (%) during 2011
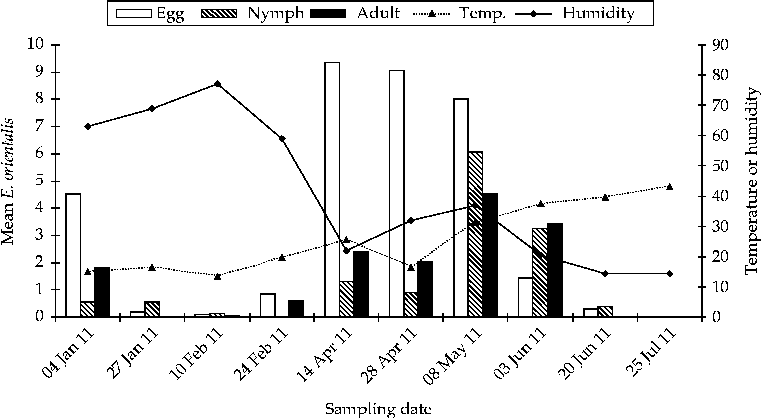
During the first mite activity period, egg densities increased exponentially from 0.47 to 17.33 eggs per leaf from 10 August to 14 September 2010. After 14 September 2010, egg densities rapidly dropped and reached 0.32 eggs per leaf on 10 December 2010. The same population trend was found for nymphs. Their densities peaked at a mean of 5.47 per leaf on 28 September 2010, and then decreased gradually from there onwards. Adult densities of E. orientalis increased slowly from 0.34 to 2.77 mites per leaf from 25 August to 14 September 2010. From 24 September to 28 October 2010, adult densities fluctuated around 2.7–2.1 mites per leaf. Peak densities of adults were 2.78 mites per leaf on 28 September 2010, while a population decrease was recorded from 2.1 to 0.3 from 28 September to 22 December 2010.
During the second activity period, egg densities rapidly increased from 0.1 to 9.3 between 10 February to 14 April 2011, and dropped thereafter. Population growth trends of nymphs and adults were similar during the second mite activity period. Peak densities of 6.05 nymphs and 5.45 adults per leaf were recorded on 8 May 2011.
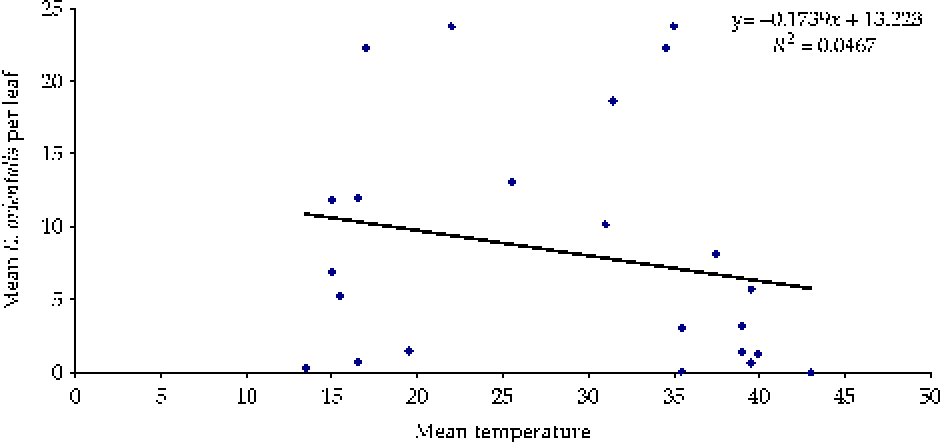
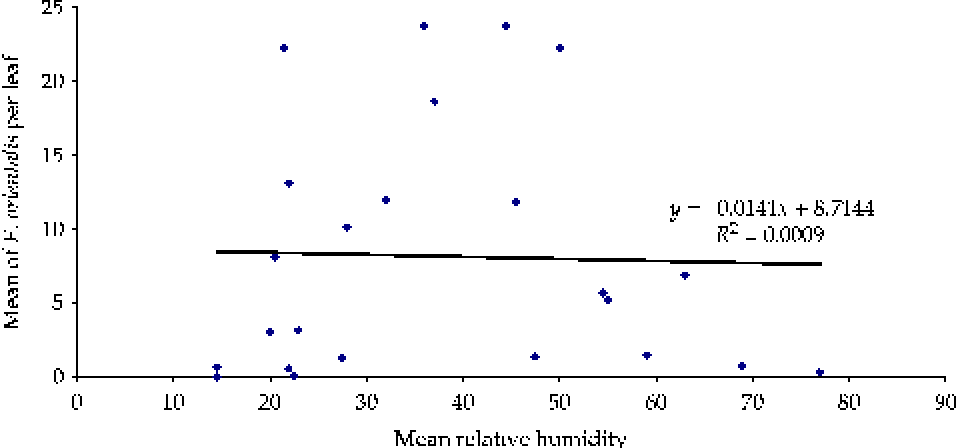
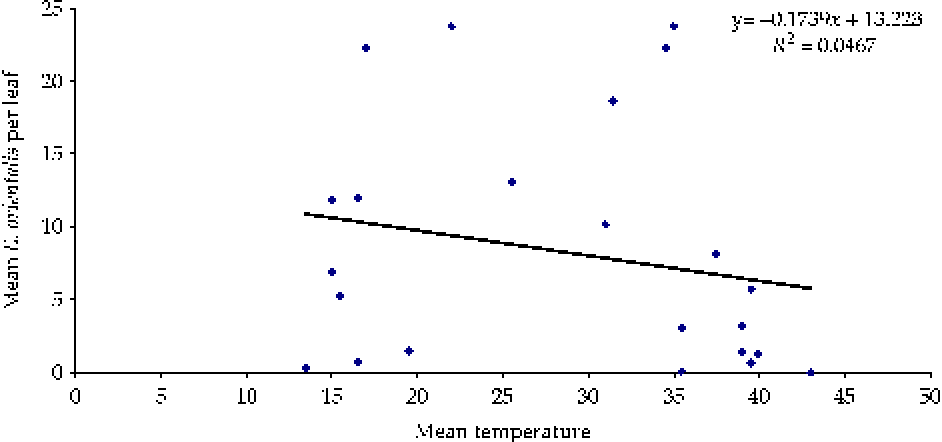
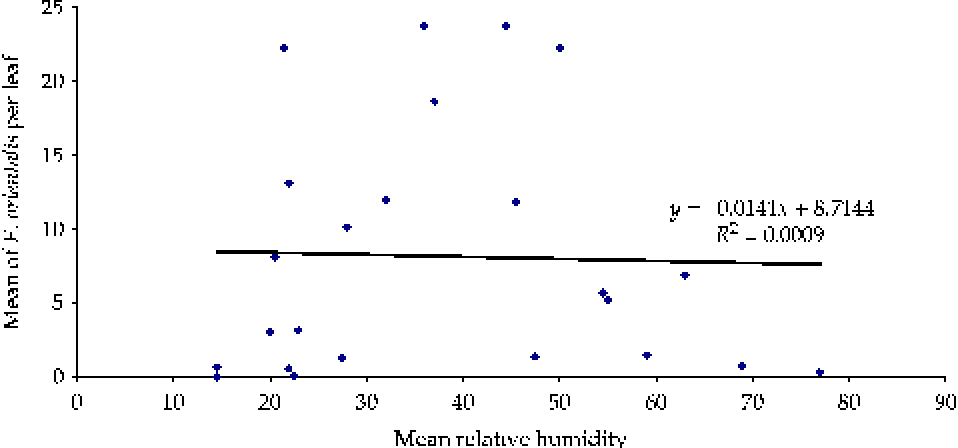
The correlation coefficient values for mite density and temperature and humidity were 0.0467 and 0.0009, respectively (Figs 3 and 4). The values were not significantly different from 0 (df = 1, 23; F= 1.079; P= 0.31 and df = 1, 23; F= 0.21; P= 0.887 for the regression between the mean of E. orientalis and temperature and humidity, respectively).
Regression between mean Eutetranychus orientalis densities and temperature. (A colour version of this figure can be found online at: http://www.journals.cambridge.org/jti).
Regression between mean Eutetranychus orientalis densities and relative humidity. (A colour version of this figure can be found online at: http://www.journals.cambridge.org/jti).
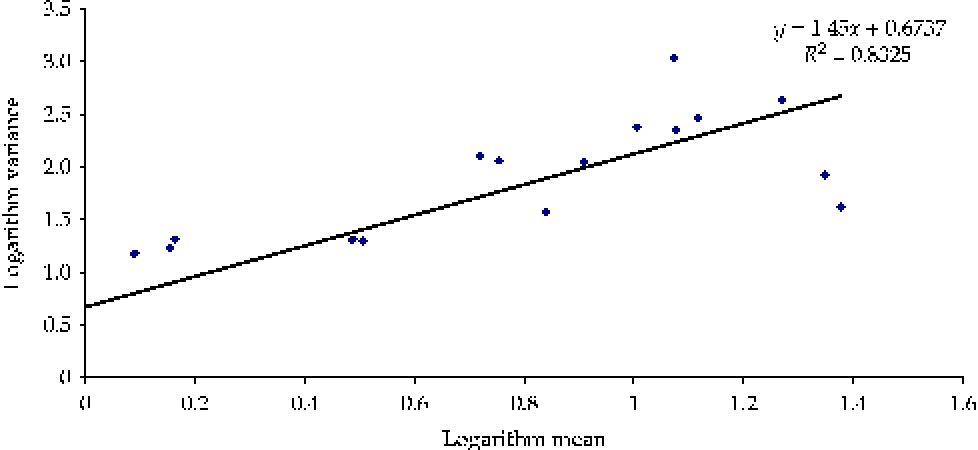
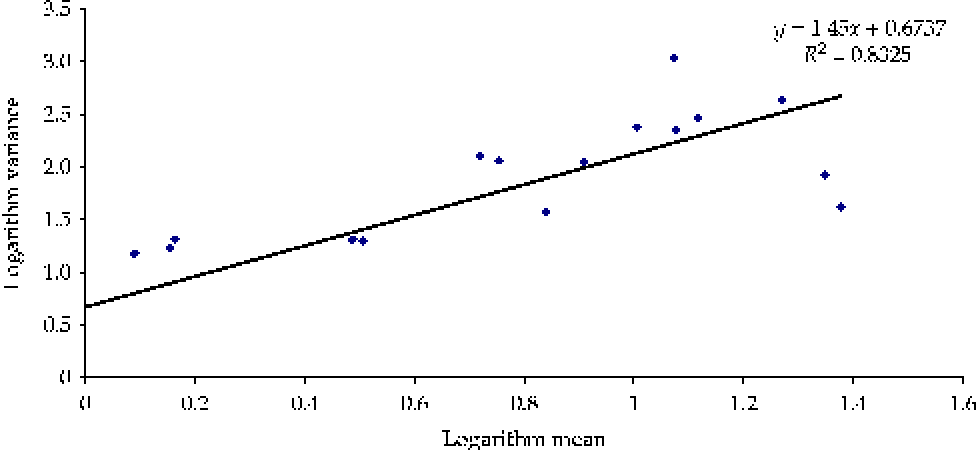
The regression between the logarithm mean and the logarithm variance of E. orientalis on A. lebbeck is shown in Fig. 5. The correlation coefficient value (0.8325) for Taylor's model was significantly different from 0 (P= 0.00, df = 20, t= 11.3). Therefore, this model accurately describes the mean–variance linear relation for the E. orientalis dataset. The value of the regression slope (b) was significantly different from 1 (P= 0.00, df = 20, t= 8.42), indicating an aggregated distribution pattern for E. orientalis on A. lebbeck leaves.
Regression between logarithm mean and logarithm variance of Eutetranychus orientalis on Albizia lebbeck plants (A colour version of this figure can be found online at: http://www.journals.cambridge.org/jti).
No significant differences were found between the population densities of the mites in different heights and sides of the tree canopy (df = 21, 219; F= 0.93; P= 0.72).
Discussion
The highest density and activity of E. orientalis was observed on A. lebbeck during September to November and April to May in the Dolat Park of Ahwaz, southwest Iran. During these months, the average temperature and relative humidity were 20–35 °C and 21–40%, respectively. Mite density decreased when temperatures were above or below this range. In laboratory studies, Imani and Shishehbor (Reference Imani and Shishehbor2009) showed that the highest intrinsic rate of increase (r m) of E. orientalis was observed at 30 °C. At this temperature, the mite population had the ability to double in the shortest time (4.79 days). Childers et al. (Reference Childers, Abou-Setta and Nawar2009) obtained the same results for E. banksi McGregor on grapefruit leaves. Gangwar and Lal (Reference Gangwar and Lal1998), in India, observed E. orientalis from December to April on mandarin oranges and recorded peak activity in early March; peak mite densities were related to temperature and a comparatively low relative humidity. Differences in climatic conditions and host plants may explain the different results obtained in our study. Facultative diapause of polyphagous herbivores is affected by host plant quality (Hunter and McNeil, Reference Hunter and McNeil1997).
Some predators were observed in the E. orientalis colony, the most abundant species being the coccinellid beetle Stethorus gilvifrons Mulsant. According to Imani and Shishehbor (Reference Imani and Shishehbor2011), this predator could be an effective natural enemy of E. orientalis. They suggested that the simultaneous use of both fourth-instar larvae and adult females could increase the rate of predation in the field. Yet, despite the presence of the predator on A. lebbeck plants, over the years, repeated mite outbreaks have been observed in Ahwaz (Imani and Shishehbor, Reference Imani and Shishehbor2011). Hence, inundative releases of ladybirds might increase their efficacy in controlling E. orientalis on A. lebbeck plants.
The spatial distribution of E. orientalis on A. lebbeck was aggregated. Analysis of the spatial distribution pattern is recognized as a necessary procedure for arthropod population studies and provides basic information for designing efficient and cost-effective sampling plans for population estimation and pest management (Madadi et al., Reference Madadi, Dashti and Enkegaard2011). Aggregative distribution of the two-spotted spider mite Tetranychus urticae Koch. has been reported by So (Reference So1991).
Conclusion
The population density of E. orientalis is affected by the environmental temperature. So the mite outbreak is predictable during the mild-climate months of Khuzestan Province (August–October and February–June). Decision making to control the pest should be applied during these months. It is clear that populations of E. orientalis on A. lebbek are aggregative in the Khuzestan region. Indian siris plantations in the vicinity of infested trees are prone to attack by E. orientalis. This is probably due to the aggregated distribution of its population. Hence, plantations in the vicinity of E. orientalis-infested trees need to be protected using prophylactic control measures.
Acknowledgements
The financial support from the Research Deputy of the Khuzestan branch of Ramin Agricultural and Natural Resources University, Jahad Daneshgahi and the Ahwaz Municipality is appreciated.