Soil loss causes many serious environmental problems, such as land degradation, the reduction of agricultural productivity, water shortage and other socio-economic problems, especially in semi-arid regions (Pimentel et al. Reference Pimentel, Harvey, Resosudarmo, Sinclair, Kurz, McNair, Crist, Shpritz, Fitton, Saffouri and Blair1995; Zuazo & Pleguezuelo Reference Zuazo and Pleguezuelo2008). Rainfall, topography, soil properties and vegetation are widely recognised as the primary factors influencing runoff and soil loss (Chirino et al. Reference Chirino, Bonet, Bellot and Sanchez2006; Parsons et al. Reference Parsons, Brazier, Wainwright and Powell2006; Kinnell Reference Kinnell2007; Sadeghi et al. Reference Sadeghi, Seghaleh and Rangavar2013). The Universal Soil Loss Equation and its revised version (USLE and RUSLE) are commonly used to predict annual soil loss by water (Wischmeier & Smith Reference Wischmeier and Smith1978; Kinnell Reference Kinnell2005). Rainfall erosivity (EI30), slope length and vegetation are the basic parameters used in the USLE and RUSLE (Liu et al. Reference Liu, Nearing, Shi and Jia2000; Kinnell Reference Kinnell2007; Gao et al. Reference Gao, Fu, Lu, Liu, Wang and Zhou2012). With comprehensive consideration of the combined and interactive effects of vegetation cover, rainfall characteristic and slope length, the prediction of runoff and soil loss can be improved effectively.
Vegetation restoration is recognised as the most efficient measure to control runoff and soil loss (Elwell & Stocking Reference Elwell and Stocking1976; Feng et al. Reference Feng, Sun, Fu, Su, Liu and Lamparski2012; Lu et al. Reference Lu, Fu, Feng, Zeng, Liu, Chang, Sun and Wu2012). Runoff and soil loss have been shown to decrease linearly or exponentially with vegetation coverage (Crockford & Richardson Reference Crockford and Richardson2000; Chirino et al. Reference Chirino, Bonet, Bellot and Sanchez2006; Allen et al. Reference Allen, Brooks, Keim, Bond and McDonnell2014). The amount of runoff and soil loss varies with different types of vegetation cover, due to their various morphologies and structure (Bochet et al. Reference Bochet, Rubio and Poesen1998; Calder Reference Calder2001). Nunes et al. (Reference Nunes, De Almeida and Coelho2011) showed that shrub land and areas of recovering oak forest resulted in less runoff and soil loss than pasture land, whereas Fusun et al. (Reference Fusun, Jinniu, Tao, Yan, Haixia and Ning2013) found that a high coverage of grass was more efficient in preventing runoff and soil loss in land restoration projects than shrubs and forests. Similar effects of high vegetation coverage on limiting runoff and soil loss were also observed in dry grassland, thorn shrub land and afforested tree land (Chirino et al. Reference Chirino, Bonet, Bellot and Sanchez2006). Variations in runoff and soil loss may result from the presence of different plant species, as well as regional and climatic differences.
Rainfall is the drive for runoff and the source of kinetic energy for erosion (Parsons & Stone Reference Parsons and Stone2006). Rainfall characteristics, such as rainfall depth, duration, average intensity, maximum 10-min (I 10) or 30-min intensity (I 30), and the overall rainfall pattern, had great effects on runoff and soil erosion (Cammeraat Reference Cammeraat2004; Frauenfeld & Truman Reference Frauenfeld and Truman2004; Dunkerley Reference Dunkerley2010; Ran et al. Reference Ran, Su, Li and He2012; Wei et al. Reference Wei, Jia, Yang, Chen, Zhang and Yu2014; Zhou et al. Reference Zhou, Fu, Gao, Lü, Liu, Lü and Wang2016). Among these indices, the maximum I 30 was commonly used to predict soil erosion, which presented more explanatory power for runoff and soil loss than the average intensity (Millward & Mersey Reference Millward and Mersey1999; Angel et al. Reference Angel, Palecki and Hollinger2005; Xu et al. Reference Xu, Liu, Kong, Zhang, Yu and Chen2009; Dunkerley Reference Dunkerley2010; Gao et al. Reference Gao, Fu, Lu, Liu, Wang and Zhou2012). Many studies had used rainfall depth, duration and maximum I 30 to classify rainfall events into different regimes (Fang et al. Reference Fang, Shi, Li, Guo, Liu and Ai2012; Peng & Wang Reference Peng and Wang2012; Liu et al. Reference Liu, Yang, Hu, Tang and Zheng2016). For example, Wei et al. (Reference Wei, Chen, Fu, Huang, Wu and Gui2007) divided rainfall events into three regimes and investigated their effects on runoff and soil loss in five land use types, from 1986 to 1999. Liu et al. (Reference Liu, Yang, Hu, Tang and Zheng2016) and Peng & Wang (Reference Peng and Wang2012) classified rainfall into five regimes to investigate their effects on runoff and soil loss under different types of vegetation cover.
In general, runoff and soil loss also have a strong spatial scale dependency (Parsons et al. Reference Parsons, Brazier, Wainwright and Powell2006; Mayor et al. Reference Mayor, Bautista and Bellot2011; Sadeghi et al. Reference Sadeghi, Seghaleh and Rangavar2013). The inter-influences of vegetation on soil erosion change with scale, which affects processes of the generation and redistribution of runoff, and sediment movement (e.g., delivery, transport and storage) (Puigdefabregas et al. Reference Puigdefabregas, Sole, Gutierrez, del Barrio and Boer1999; Boix-Fayos et al. Reference Boix-Fayos, Martinez-Mena, Arnau-Rosalen, Calvo-Cases, Castillo and Albaladejo2006). Smets et al. (Reference Smets, Poesen and Bochet2008) found that the effectiveness of vegetation in controlling runoff and soil loss reduction was reduced with increasing plot length, and vegetation factors had more effect in plots longer than 11m. The effects of rainfall on runoff and erosion generation were also closely related to the studied scale (Cammeraat Reference Cammeraat2004; Mayor et al. Reference Mayor, Bautista and Bellot2011).
Understanding the responses of runoff and soil loss to changes in rainfall under different land uses is crucial to land management, especially in the areas with severe erosion, such as the Loess Plateau in China. Many studies have been conducted to investigate the effects of vegetation restoration after 1999 (initiation of the Grain-for-Green project) on soil erosion in the Loess Plateau of China (Fu et al. Reference Fu, Liu, Lu, He, Zeng and Wu2011; Feng et al. Reference Feng, Sun, Fu, Su, Liu and Lamparski2012; Lu et al. Reference Lu, Fu, Feng, Zeng, Liu, Chang, Sun and Wu2012; Zhou et al. Reference Zhou, Zhao and Zhu2012; Zhao et al. Reference Zhao, Mu, Wen, Wang and Gao2013). For example, Liu et al. (Reference Liu, Fu, Lu, Wang and Gao2012) found that runoff and soil loss varied with plot scale, but depended on the type of vegetation cover adopted in the vegetation restoration projects. Chen et al. (Reference Chen, Cai, Zhang, Zheng, Qi and Li2011) found that the effects of slope length on soil erosion changed with the rainfall intensity in the Loess Plateau. Fang et al. (Reference Fang, Cai, Chen and Li2008) and Wei et al. (Reference Wei, Chen, Fu, Huang, Wu and Gui2007) presented the responses of runoff and soil loss to rainfall regimes at different plot scales and under different land uses, before the Grain-for-Green project was implemented in the Loess Plateau. However, few studies have considered the response of runoff and soil loss with different slope lengths and land uses to rainfall patterns change after implementing the Grain-for-Green project in the Loess Plateau of China (Fang et al. Reference Fang, Cai, Chen and Li2008; Xin et al. Reference Xin, Xu and Zheng2008; Zhang et al. Reference Zhang, Liu, Yi and Zhang2014). The interaction effects of rainfall pattern and slope length on runoff and soil loss are still unclear.
In this study, runoff and soil loss were measured under three land uses – forest, shrub and grass – with different plot lengths, from 2008 to 2016. Fifty-nine rainfall events with production of runoff and soil loss were classified into three regimes and were used to analyse the variation of runoff and soil loss induced by rainfall pattern and plot length among different land uses. The aims of this study were to: (1) investigate the effects of rainfall regimes on runoff and soil loss among different land uses; (2) determine the responses of runoff and soil loss to plot length changes under different land uses; and (3) detect the interactive effects of rainfall regimes and plot length on the differences of runoff and soil loss between land uses.
1. Materials and methods
1.1. Study area
This study was conducted in the Yangjuangou catchment [36°42′N, 109°31′E], which is located in the central region of the Loess Plateau, Shaanxi Province, China (Fig. 1). The catchment has a total area of 2.02km2, with the elevation ranging from 1050 to 1298m. The catchment has a semi-arid climate, with an average annual precipitation of 535mm and an average annual air temperature of 14°C. The soil type in the study area is a Calcaric Cambisol, which is characterised by a uniform texture, with a maximum depth of approximately 200m (Li et al. Reference Li, Poesen, Yang, Fu and Zhang2003). The dominant vegetation in the catchment consists of replanted vegetation due to the Grain-for-Green project, which was launched in 1999, and is dominated by Robinia pseudoacacia, Prunus armeniaca, Spiraea pubescens, Artemisia sacrorum, Andropogon and Artemisia scoparia. This catchment experienced severe soil erosion, with a mean soil erosion rate of 62.73tha–1y–1 from 1992 to 1996 and 36.41tha–1y–1 in 2006 (Liu et al. Reference Liu, Fu, Lu, Wang and Gao2012).
Location of the study area and distribution of the three runoff plot groups.

1.2. Field experiment
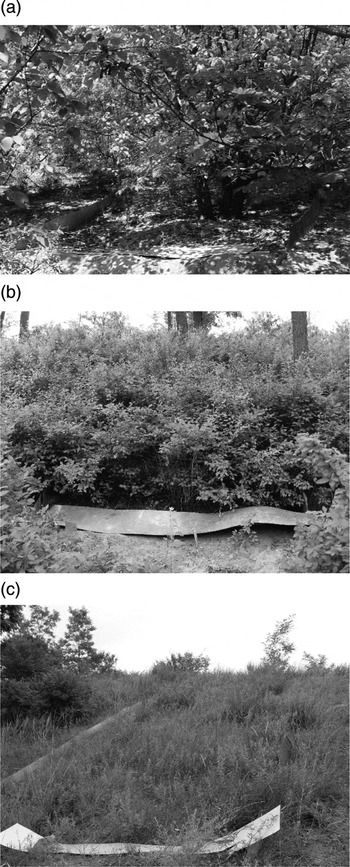
Event runoff and soil loss were measured from 2008 to 2016 (except for 2010) under three land uses – forest, shrub and grass – commonly used in ecological restoration projects (Fig. 2), including (1) abandoned cropland covered by forests (Prunus armeniaca), (2) native shrub land (Spiraea pubescens) with very sparse wood and (3) dense grass (Andropogon L. and Artemisia scoparia). Three runoff plot groups with different land cover types were installed in the catchment in 2008. Each group included three closed runoff plots with a fixed width of 2m and lengths of 5, 9 and 13m. Group 1 plots (forest) had been abandoned for 16 years, and Group 2 (shrub) and Group 3 (grass) had been abandoned for 33 years (Liu et al. Reference Liu, Fu, Lu, Wang and Gao2012). Forest land had a high canopy of 10–15m and large leaf area, and was planted in rows at interval distances of 2.5–5m, which had thinner litter cover and sparse, deep roots. Shrub land had a higher coverage (more than 80%), with a canopy height of 1–2m; it had thick and wide litter cover and dense roots. Grass land was dominated by dense tussock (Artemisia scoparia) and beard grass (Andropogon L.), but also included other grass species, showing greater species richness. It had a low canopy of less than 1m, and bare areas were imbedded between tussock, where litter was distributed according to the patch-bare mosaic pattern of grass. The grass land had the densest roots in the surface soil. The slope gradient of all plots was approximately 22°. Polyvinyl chloride (PVC) sheets (at a depth of 50cm) were used at the boundaries of runoff plots to prevent surface water flowing from lateral seepage during rainfall. A collection system consisting of water channels and water containers was installed at the bottom boundary of each plot.
Photographs of the three plot groups with different land uses. (a) Forest; (b) Shrub; (c) Grass.

Rainfall depth and timing was measured during 2008–2016 using tipping-bucket rain gauges (RG3-M, Onset Computer Corp., Bourne, MA, USA), with an accuracy of 0.2mm. Runoff and sediment samples were collected after each rainfall event. Runoff volume was measured by collecting the water in the containers. Representative samples of runoff containing sediment were shaken vigorously to create a homogeneous mixture in the containers. The mixed water was then poured into plastic bottles and taken to the laboratory to separate sediment from water. After settling for 24h, the excess water was decanted and the residual sample was dried in an oven at 105°C for 24h and weighed. A total of 59 erosive rainfall events producing runoff were observed during the study period.
1.3. Data analysis
The runoff coefficients for each rainfall event were calculated as the ratio of runoff depth to rainfall depth in each plot. Soil loss rates were calculated as the amount of sediment exported per square meter. A clustering methodology was used to classify rainfall events into different rainfall regimes. This analysis method could separate and classify rainfall events based on their characteristics (Yeh et al. Reference Yeh, Wensel and Turnblom2000). In general, clustering can be achieved by two methods: the K-means method and the hierarchical method (Hong Reference Hong2003). In this study, the K-means method was selected due to the large number of rainfall events. Three rainfall regimes were classified based on the variables of rainfall depth, duration and maximum I 30 (Wei et al. Reference Wei, Chen, Fu, Huang, Wu and Gui2007; Liu et al. Reference Liu, Yang, Hu, Tang and Zheng2016). Rainfall regime 1 was characterised by a high intensity, short duration and low rainfall depth. Rainfall regime 2 had a low intensity, long duration and high depth. Rainfall regime 3 had a moderate intensity, duration and depth. With natural logarithm transformation data for passing the normality test, a one-way analysis of variance (ANOVA) with a least-square difference (LSD) post-hoc test was used to determine whether runoff and soil loss differed significantly among different vegetation, rainfall regimes and plot lengths. The level of significance was set at 95% confidence interval (P=0.05).
2. Results
2.1. Rainfall regimes
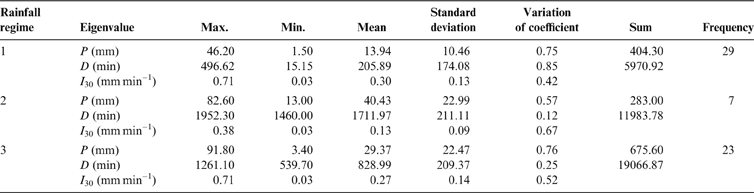
In this study, three rainfall regimes were obtained using K-means clustering from 59 rainfall events based on rainfall depth, duration and maximum I 30 (Table 1). The rainfall events in regime 1 had a low rainfall depth of 13.94mm, a short duration of 205.89min and a high maximum I 30 of 0.30mm/min. They were observed 29 times during the study period, and accounted for 49% of all events. The three eigenvalues of seven rainfall events in regime 2 were the opposite to those in regime 1; they had a high rainfall depth of 40.43mm, a long duration of 1711.97min and a low intensity of 0.15mmmin–1. The rainfall events in regime 3 had a moderate rainfall depth (29.37mm), duration (828.99min) and intensity (0.27mmmin–1), and accounted for 39% of the total events. Thus, extreme rainfall events with a short duration, low rainfall depth and high-intensity storms were classified as regime 1, while those with the opposite characteristics were classed as regime 2. Other events with moderate rainfall eigenvalues were regarded as regime 3.
Statistical features of different rainfall regimes. Abbreviations: P=rainfall depth; D=duration; I 30=the maximum 30-min intensity.

2.2. Runoff and soil loss under different land uses
Figure 3 presents the mean runoff coefficient and mean soil loss during 2008–2016 under the three land uses, forest, shrub and grass. Grass land had the largest runoff coefficient (1.36%) and soil loss (2.15Mgkm–2). The lowest runoff coefficient was found in forest land (0.58%), and shrub land had a moderate runoff coefficient of 0.62%. In contrast, shrub land had the lowest soil loss of 0.31Mgkm–2, accounting for only approximately 14% of that in grass land. A moderate level of soil loss occurred in forest land (0.76Mgkm–2), which accounted for approximately 35% of that in grass land. The runoff coefficient and soil loss of grass land were significantly greater than that of shrub land, but there were no significant differences between forest and shrub land in runoff coefficient, and between grass and forest land in soil loss. The results indicated that grass land produces significantly more runoff and soil loss than shrub land and, thus, forest and dense shrub cover have a significant effect on reducing runoff and soil loss, respectively.
Mean runoff coefficient and soil loss of each rainfall event during 2008–2016 under different land uses with forest, shrub and grass. The same letter on two bars indicates no significant difference (P<0.05) in runoff coefficient and soil loss between different land uses. The error bar represents standard error.

2.3. Runoff and soil loss under different rainfall regimes
The differences in the runoff coefficient and soil loss among the three land uses – forest, shrub and grass – under different rainfall regimes are shown in Figure 4. The rainfall events of regime 2 produced the lowest runoff coefficient of 0.04–0.06% and the lowest soil loss of 0.01–0.03 Mg/km2 under each land use. The highest runoff coefficient of 0.84–2.06% in different land uses was found under regime 1 events, followed by events of regime 3 with 0.33–0.88%. The soil loss of shrub land was highest under regime 1 events (0.45Mgkm–2), whereas for forest land and grass land, regime 3 events produced the highest soil loss of 1.17 and 2.81Mgkm–2, respectively.
Mean runoff coefficient and soil loss of each land use under different rainfall regimes. The same letter on two bars indicates no significant difference in runoff coefficient and soil loss (P<0.05) between different rainfall regimes. The error bar represents standard error.

The differences in runoff and soil loss among different land uses were influenced by rainfall regimes. The order of the runoff coefficient in the three land uses induced by regime 1 events was the same as the average level shown in Figure 3 (forest<shrub<grass), while under regime 2 and regime 3 events, shrub land produced the lowest runoff coefficient. For soil loss, rainfall events of regime 2 produced a different order (shrub<grass<forest) from that under regime 1 and regime 3 (shrub<forest<grass). Regime 1 and regime 3 resulted in significant differences in the runoff coefficient and soil loss among different types of land uses, while the differences of runoff coefficient in regime 2 did not reach a significant level (P<0.05), indicating that the effects of land use in reducing runoff are likely to be crucial during high-intensity rainfall. Moreover, the highest variation in the runoff coefficient and soil loss induced by the different rainfall regimes was found in shrub land, indicating that the effect of shrubs on preventing soil and water loss was highly sensitive to the changes in rainfall.
2.4. Runoff and soil loss under different plot lengths
Figure 5 shows the scale characteristics of runoff and soil loss under different land uses. As shown in Figure 5, the runoff coefficients for the 13-m plots in shrub and grass land were significantly lower than the 5- and 9-m plots, but there were no significant differences between the 5- and 9-m plots. Soil loss in the 5-m plots of forest and grass land was significantly higher than that of the 9- and 13-m plots of forest and grass land, respectively, while no significant differences were found between the 9- and 13-m plots. There were no significant differences among plots with different plot lengths in the runoff coefficient for forest land and soil loss in shrub land.
Mean runoff coefficient and soil loss of each land use at different plot lengths. The same letter on two bars indicates no significant difference in runoff coefficient and soil loss (P<0.05) between different plot lengths. The error bar represents standard error.

Generally, the 5-m plots had the highest runoff coefficient and soil loss in each land use, followed by the 9- and 13-m plots. However, changes in runoff and soil loss with plot lengths were different between land uses. For forest land, the runoff coefficients and soil loss in the 9- and 13-m plots were similar (0.4% and 0.4Mgkm–2, respectively), accounting for only 43% and 29% of the values in the 5-m plot, respectively. For shrub land, the runoff coefficients and soil loss in the 5- and 9-m plots had similar values of 0.8% and 0.4Mgkm–2, which were 2.5 and 2.6 times higher, respectively, than the values in the 13-m plots. For grass land, the runoff and soil loss decreased with plot lengths, exhibiting the largest variation among different plot lengths. These results indicated that the effect of plot length on runoff and soil loss was limited by land use types, and grass land was found to have the strongest response of runoff and soil loss to slope length change.
2.5. Scale characteristics of runoff and soil loss under different rainfall regimes
The effects of slope length on runoff and soil loss induced by different rainfall regimes under each type of land use were also captured (Fig. 6). Under regime 1 events, runoff coefficient and soil loss decreased with plot length in each land use. The same trends (5-m plot>9-m plot >13-m plot) occurred under regime 3 events, except for the soil loss in shrub land (9-m plot>5-m plot>13-m plot). The scale characteristics of runoff and soil loss under regime 2 events were complex. The interaction of rainfall regime and slope length was also affected by land uses. The runoff coefficient and soil loss in forest land and the runoff coefficient in shrub land decreased with plot length. However, for the soil loss in shrub land and the runoff coefficient and soil loss in grass land, the order was 9-m plot>5-m plot>13-m plot. Consequently, the effects of plot length on runoff and soil loss under different land uses were influenced by rainfall regimes. Runoff and soil loss induced by regime 2 events were most sensitive to plot length change.
Scale characteristics of runoff coefficient and soil loss induced by different rainfall regimes for each land use. The same letter on two bars indicates no significant difference in runoff coefficient and soil loss (P<0.05) between different rainfall regimes. The error bar represents standard error.

2.6. Mean annual soil loss during 2008–2016
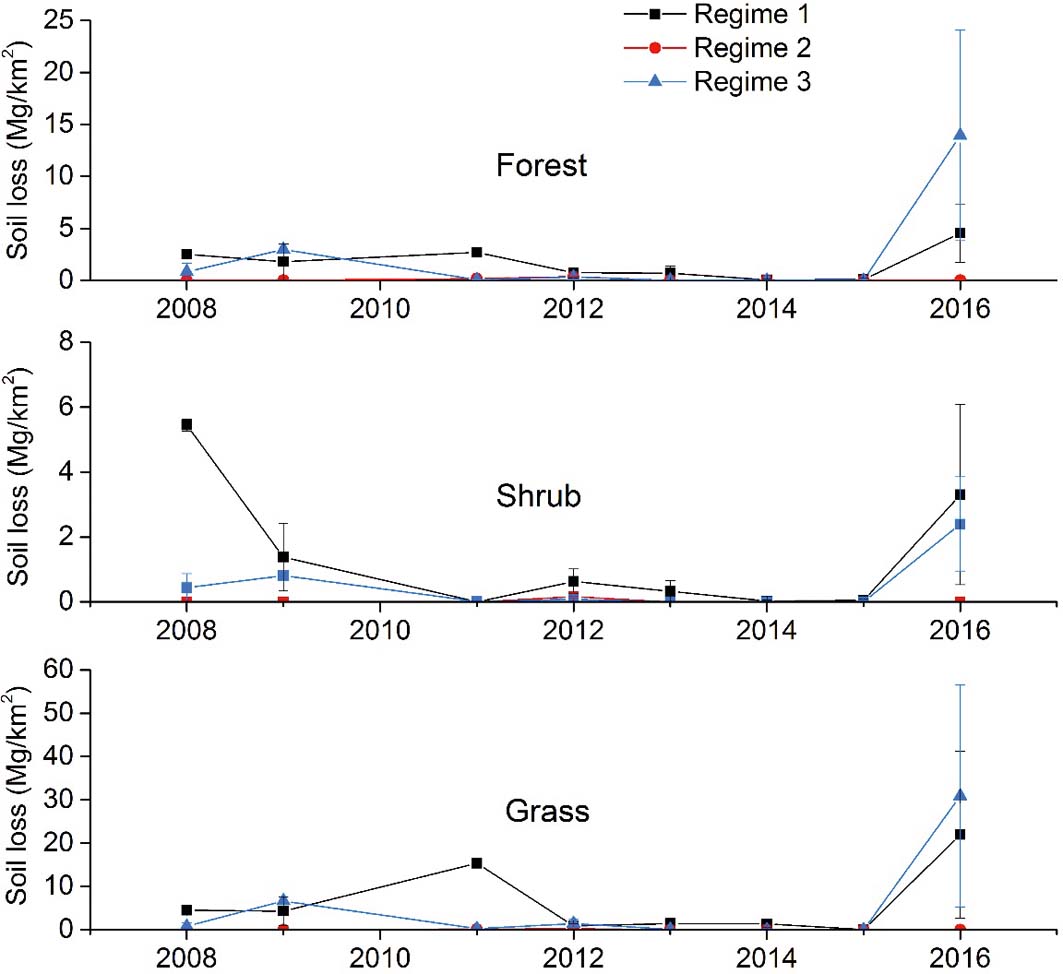
Figure 7 shows the mean annual soil loss rate for different land uses under different rainfall regimes during 2008–2016. The data were calculated using the average values of soil loss in each year and the corresponding rainfall regime, where the soil loss of each land use was the summation value of the three plots with different lengths. The change trends of mean annual soil loss for forest land and grass land were similar. Soil loss in rainfall regime 1 was always higher than that of regime 3 during 2008–2016, except for 2009 and 2016. The highest values of mean annual soil loss in regime 1 and regime 3 were 4.53Mgkm–2 and 13.93Mgkm–2 for forest land, and 21.96Mgkm–2 and 30.91Mgkm–2 for grass land in 2016, respectively. For shrub land, soil loss in regime 1 always higher than that of regime 3. However, the highest value of 5.44Mgkm–2 in regime 1 was found in 2008, and regime 3 still produced the highest soil loss of 2.39Mgkm–2 in 2016.
Mean annual soil loss of different land uses under different rainfall regimes during 2008–2016. The error bar represents standard error.

3. Discussion
3.1. Effects of rainfall regimes on runoff and soil loss under different land uses
As shown in Figure 4, rainfall regimes had a significant effect on runoff and soil loss under different land uses. Rainfall with a low depth, short duration and high I 30 (regime 1) had the greatest effect on runoff generation, while rainfall with a high depth, long duration and low I 30 (regime 2) had the least effect on runoff and soil loss generation. Rainfall with moderate depth, duration and I 30 (regime 3) caused the most severe soil loss for grass and forest cover. Other studies in arid and semi-arid regions also reported similar phenomenon (Wei et al. Reference Wei, Chen, Fu, Huang, Wu and Gui2007; Fang et al. Reference Fang, Cai, Chen and Li2008).
The results could be explained by the mechanism of runoff generation being mainly attributed to excess infiltration in the Loess Plateau of China; runoff only occurred when rainfall intensity was higher than the infiltration rate (Shi & Shao Reference Shi and Shao2000; Kang et al. Reference Kang, Zhang, Song, Zhang, Liu, Liang and Zheng2001). I 30 is recognised as the most significant rainfall index related to runoff and soil loss in arid and semi-arid areas (Angel et al. Reference Angel, Palecki and Hollinger2005; Xu et al. Reference Xu, Liu, Kong, Zhang, Yu and Chen2009; Dunkerley Reference Dunkerley2010). Therefore, regime 1 events with the highest I 30 resulted in the largest runoff coefficient. In contrast, the lower intensity and long duration of regime 2 events resulted in more infiltration, leading to a lower runoff coefficient. However, in other areas, such as humid and semi-humid regions, due to the saturation and Hortonian mechanisms for the generation of runoff, rainfall with a high annual rainfall depth (regime 3) created the most surface runoff (Peng & Wang Reference Peng and Wang2012; Liu et al. Reference Liu, Yang, Hu, Tang and Zheng2016).
It should be noted that most soil loss under grass and forest cover was induced by regime 3 events with moderate I 30, instead of regime 1 events with the highest I 30. This result is not consistent with some previous studies (Wei et al. Reference Wei, Chen, Fu, Huang, Wu and Gui2007; Peng & Wang Reference Peng and Wang2012). Annual soil loss from 2008 to 2016 under each vegetation type is shown in Figure 7 to address this abnormal behaviour. In most years (except for 2009 and 2016), regime 1 events usually induced more soil loss than regime 3 events under grass and forest cover. Based on the observed data, we found that extreme erosion events played a critical role in the soil loss difference induced by different rainfall events. For example, one rainfall event (classed as regime 3 event), which took place on August 15, 2016, resulted in 52.74Mgkm–2 and 20.74Mgkm–2 of soil loss in grass land and forest land, respectively, which was more than 41 and 56% of total soil loss in the corresponding plots induced by regime 1 events during the study period. Previous studies also showed that extreme erosion events were responsible for the high soil loss in the Loess Plateau of China (Shi & Shao Reference Shi and Shao2000; Wei et al. Reference Wei, Chen, Fu, Lu and Gong2009). Heavy rain storms often caused 1.5–53.1 times higher erosion rates than the mean annual rates, which accounted for more than 50%, or even 75%, of annual soil erosion (Shi & Shao Reference Shi and Shao2000; Cheng et al. Reference Cheng, Lin and Lu2002; González-Hidalgo et al. Reference González-Hidalgo, Peña-Monné and de Luis2007; Ramos & Martinez-Casasnovas Reference Ramos and Martinez-Casasnovas2009; Wei et al. Reference Wei, Chen, Fu, Lu and Gong2009). In addition, the effects of extreme rainfall events on runoff and soil loss were also influenced by other factors such as plant growth stage, vegetation cover and cultivated landscapes (Boardman Reference Boardman2015).
The rainfall regimes resulted in a complex order of runoff and soil loss between different land uses. Plant morphology and vegetation structure significantly affected the processes of runoff generation and accumulation, as well as soil detachment and transport (Bochet et al. Reference Bochet, Rubio and Poesen1998; Calder Reference Calder2001), which were responsible for the different orders of runoff and soil loss under different rainfall regimes (Fig. 4). Forest and shrub cover had a greater canopy height and generated more litter cover than grass cover, which significantly reduces raindrop kinetic energy and intercepts more rainfall to delay the generation of runoff (Calder Reference Calder2001; Smets et al. Reference Smets, Poesen and Bochet2008; Li et al. Reference Li, Niu and Xie2014). The ability of vegetation in controlling runoff and soil loss was influenced by rainfall intensity. Shrub land had the highest canopy coverage and produced the thickest litter layer, which effectively reduced runoff and soil loss during low-intensity rainfall (i.e., regimes 2 and 3 events) (Calder Reference Calder2001; Smets et al. Reference Smets, Poesen and Bochet2008; Li et al. Reference Li, Niu and Xie2014), resulting in the lowest levels of runoff and soil loss. However, previous studies have proposed that a flow channel for runoff might be formed by excess litter cover, thus preventing water infiltration when high-intensity rainfall events occurred (Findeling et al. Reference Findeling, Ruy and Scopel2003; Li et al. Reference Li, Niu and Xie2014). Therefore, shrub cover produced more runoff than forest cover under regime 1 events. The thick litter layer can also greatly limit sediment detachment (Pannkuk & Robichaud Reference Pannkuk and Robichaud2003; Li et al. Reference Li, Niu and Xie2014), resulting in low soil loss during regime 1 events. In addition, the time of land abandoned also influenced the processes of runoff and soil loss generation. Under shrub land and forest land, vegetation coverage increased with plant growth years (Wei et al. Reference Wei, Chen, Fu, Huang, Wu and Gui2007). Soil organic carbon and soil water-stable aggregate also increased with the increase in years of returning cultivated land to black locust land (Sun et al. Reference Sun, Zhang, Wang and Luan2017). In this study, shrub land that has been abandoned for the longest presented the lowest runoff levels for regime 2 and 3, and the lowest soil loss, due to its having the highest vegetation coverage and soil anti-erodibility.
3.2. Response of runoff and soil loss to plot length under different land uses
The runoff and soil loss orders in plots with different lengths (5-m plot>9-m plot>13-m plot) were almost the same under the three land uses (Fig. 5). Ghahramani & Ishikawa (Reference Ghahramani and Ishikawa2013) also found that runoff decreased with increasing slope length. The connectivity, distance of runoff pathway and time of runoff were crucial to the amount of runoff and soil loss, which were limited by the slope length and affected by the type of vegetation cover and litter layer (Parsons et al. Reference Parsons, Brazier, Wainwright and Powell2006; Ghahramani & Ishikawa Reference Ghahramani and Ishikawa2013). Increasing infiltration with increasing slope length has been recognised as the main factor contributing to the scale effects of runoff (Mayor et al. Reference Mayor, Bautista and Bellot2011; Ghahramani & Ishikawa Reference Ghahramani and Ishikawa2013). Therefore, due to the key role of vegetation in controlling infiltration, runoff and soil loss at different scales were related to the type of vegetation cover (Cammeraat Reference Cammeraat2004). Grass land was found to have the most significant effect of slope length on runoff and soil loss. Shrub land produced slight variations in runoff and soil loss between plots with lengths of 5 and 9m, while forest cover plots with lengths of 9 and 13m had similar levels of runoff and soil loss. Therefore, the effect of slope length on runoff and soil loss was mainly determined by the type of land use.
3.3. Combined effects of rainfall regime and plot length on runoff and soil loss
Many studies found that the scale effects of runoff and soil loss were influenced by rainfall intensity (Chaplot & Le Bissonnais Reference Chaplot and Le Bissonnais2003; Cammeraat Reference Cammeraat2004; Xu et al. Reference Xu, Liu, Kong, Zhang, Yu and Chen2009; Ghahramani & Ishikawa Reference Ghahramani and Ishikawa2013). The thresholds of rainfall depth and intensity for runoff generation increase with increasing plot length, and runoff may only occur in long plots under sufficient high rainfall amount and intensity (Cammeraat Reference Cammeraat2004; Mayor et al. Reference Mayor, Bautista and Bellot2011). In this study, runoff and soil loss under different land uses were shown to be affected by both the rainfall regime and plot length. The slope length characteristics of runoff at different rainfall regimes under forest and shrub cover showed a similar trend (a decrease with slope length increased), which differed from the behaviour for soil loss. Different slope length effects of runoff were observed under grass cover when experiencing rainfall events with a low intensity (regime 2).
It was found that rainfall events with a high intensity reduced the scale effects of runoff (Fang et al. Reference Fang, Cai, Chen and Li2008; Sadeghi et al. Reference Sadeghi, Seghaleh and Rangavar2013), while the scale effects of soil loss were amplified (Liu et al. Reference Liu, Nearing, Shi and Jia2000). However, the effects of rainfall intensity on the scale characteristics of runoff and soil loss were affected by land uses. Vegetation structures, such as canopy height, litter layer and plant roots, can alter rainfall erosive kinetic energy and soil properties, and then directly or indirectly affect the generation of runoff and soil loss (Quinton et al. Reference Quinton, Edwards and Morgan1997; Crockford & Richardson Reference Crockford and Richardson2000; Gyssels et al. Reference Gyssels, Poesen, Bochet and Li2005; Zuazo & Pleguezuelo Reference Zuazo and Pleguezuelo2008; Li et al. Reference Li, Niu and Xie2014). For forest and shrub land, high-intensity rainfall generated the least response of runoff and soil loss to slope length change, whereas low-intensity rainfall led to the largest response. For grass land, rainfall with moderate intensity resulted in the least variation in runoff and the largest variation in soil loss when slope length changed, whereas low-intensity rainfall generated the converse result, which does not correspond to the previous studies. As a result, we found that land uses could influence the effect of rainfall intensity on the response of runoff and soil loss to slope length.
4. Conclusion
This study investigated the combined effects of rainfall regimes and plot length on runoff and soil loss among different land uses with forest, shrub and grass in the Loess Plateau. Fifty-nine rainfall events recorded from 2008 to 2016 were divided into three rainfall regimes using K-means clustering based on rainfall depth, duration and maximum I 30. Regime 1 events were the most frequent type of rainfall, with high intensity, short duration and low rainfall depth. Regime 2 events were the least frequent type of rainfall, with the opposite characteristics to those in regime 1 events. Regime 3 events had moderate level of rainfall indices between those of regime 1 and 2 events.
The order of mean runoff under the three land uses was grass>shrub>forest, while, for soil loss, the order was grass>forest>shrub. However, the differences between forest and shrub in runoff and between grass and forest in soil loss did not reach significant level. Rainfall regimes had an important effect on runoff and soil loss under different land uses. The orders of runoff among land uses under regimes 2 and 3 events were different from that of regime 1, and only regime 2 events resulted in the change of the order of soil loss. Moreover, runoff and soil loss varied considerably between the different rainfall regimes. Runoff under rainfall regime 1 was the greatest, followed by regimes 3 and 2. Soil loss followed the same order under shrub land, while, under grass and forest land, the order became regime 3>regime 1>regime 2. Runoff and soil loss under shrub land showed the most sensitivity to the change of rainfall regimes.
Runoff and soil loss decreased with increasing plot length, while these effects were influenced by land use type and were highly dependent on the rainfall regime. For forest and shrub land, runoff under all rainfall regimes showed a similar response to slope length change, but different effects of slope length on soil loss were found under regimes 2 and 3. For grass land, regime 2 resulted in different effects of slope length on both runoff and soil loss from other regimes. Consequently, the complex relationship of rainfall pattern–land use–slope length to runoff and soil loss still requires further investigation.
5. Acknowledgements
This research was financially supported by the National Natural Science Foundation of China (no. 41390464), the National Key Research and Development Program (no. 2016YFC0501602) and the Youth Innovation Promotion Association CAS (no. 2016040).