


For some time now, normative theorists have urged more deliberation to enhance democracy (e.g., Chambers Reference Chambers1996; Fishkin Reference Fishkin1995; Gutmann and Thompson Reference Gutmann and Thompson1996; Habermas Reference Habermas, Burger and Lawrence1989; Reference Habermas1996). One of their key requirements is equal participation and authority in discussion. Ideally, then, deliberation will “diminish the discriminatory effects of class, race, and gender inequalities” (Gutmann and Thompson Reference Gutmann and Thompson2004, 48, 50), and unequal power in society will “not shape [deliberators’] chances to contribute to deliberation, nor . . . play an authoritative role in their deliberation” (Cohen Reference Cohen, Hamlin and Pettit1989, 74). Critics counter that deliberators will not achieve equal voice; groups—such as women—with less authority in society will speak less and consequently carry less authority in deliberation (Fraser Reference Fraser and Calhoun1992; Mansbridge Reference Mansbridge1983; Sanders Reference Sanders1997; Williams Reference Williams, Kymlicka and Norman2000; Young Reference Young and Benhabib1996; Reference Young2001).
In response to this concern, numerous attempts are being made to facilitate equal voice for women by increasing their numbers in deliberating bodies. The U.S. National Health Planning and Resources Development Act, for example, requires citizens serving on boards to be “broadly representative” of social identities (Mansbridge Reference Mansbridge1999, 634). Some states mandate gender balance on appointed committees (Hannagan and Larimer Reference Hannagan and Larimer2011). The European Union, United Nations, Organization of American States, and the African Union have declared that member states should adopt 30% minimum quotas for women in all political bodies, and more than one hundred countries have done so (Krook Reference Krook2009).
We investigate whether the critics are correct in arguing that women speak less than men during deliberation and thus have less perceived influence. Moreover, we ask whether increasing descriptive representation – that is, the proportion of women in the group—raises women's deliberative voice (speech participation) and authority (perceived influence). We provide the first rigorous test of these claims using a large dataset of deliberating groups randomly assigned to treatments, and linking individuals’ speech with pre- and post-deliberation preferences and attitudes. Moreover, we develop and find support for our own hypothesis: Numbers can remedy inequality, but do so in interaction with the group's decision rule.Footnote 1 Rules determine whether women benefit from larger numbers and can help women even when they are few. Inequality disappears with unanimous rule and few women, or majority rule and many women.
“Chattiness” may be a randomly distributed personality dimension, but when speaking is the mechanism for deciding political matters, gender differences in speech participation are a relevant marker of social and political inequality. As Sanders (Reference Sanders1997) writes, “If it's demonstrable that some kinds of people routinely speak more than others in deliberative settings, as it is, then participation isn't equal, and one democratic standard has fallen” (365).Footnote 2 Deliberative design may thus need to concern itself both with the equal opportunity to speak and with the equal use of that opportunity, much as democracies consider both the formal right to political participation and social inequalities in who actually participates (Burns, Schlozman, and Verba Reference Burns, Schlozman and Verba2001, 6). Systematic analysis of deliberators’ behavior is almost nonexistent.Footnote 3 Yet, as several theorists argue, speaking is a crucial type of political act in a democracy, and all the more so in deliberative settings (Mansbridge Reference Mansbridge1983). Specifically, if less speech leads to less authority within the group, as the critics contend, then inequalities in speech participation may translate into inequalities in deliberative influence and authority. Therefore, we need to look inside the black box of deliberation by examining the volume of voice and the patterns of silence.
Rather than focusing our attention on whose preferences win, we examine speech participation and perceived influence as forms of symbolic authority that reflect and reinforce the broad civic capacity of a disadvantaged social group (Kathlene Reference Kathlene1994, 560). We do so to address the rationales of advocates and critics of deliberation, which have less to do with whose preferences are implemented than with deliberation's potential to enlarge or undermine democratic and republican civic capacities (Fishkin Reference Fishkin1995; Gastil et al. Reference Gastil, Deess, Weiser and Meade2008; see also Pateman Reference Pateman1970). This approach also follows studies of women's political participation such as Burns, Schlozman, and Verba (Reference Burns, Schlozman and Verba2001, 6), which treat political participation as a form of symbolic authority and civic standing.
EFFECTS OF GENDER COMPOSITION
The literature on gender composition offers the hypothesis that the lower the number of women in a group, the less that women participate in and influence it, and the bigger the gender gap is in participation and influence.Footnote 4 We call this the “gender role” hypothesis. Previous work offers three reasons for this hypothesis.
First, being in a numerical minority lowers the status of women in the group and thus their participation and authority in group discussion. For example, Johnson and Schulman (Reference Johnson and Schulman1989) found that women's influence is rated lower when they are in a numerical minority and that the effect of numerical minority status is greater on women than on men. This effect comes from status, which gives people a sense of entitlement to take and keep the floor; talking more leads, in turn, to more perceived influence (Fiske Reference Fiske2010). The fewer women in the group, the lower their status, the less they may speak, and the lower their influence. The expectation, then, is that the gender gap will shrink as the number of women increases.
Second, the disadvantage women face might be especially powerful in discussions of political issues. Men tend to be perceived as more competent and to enjoy a higher status than women in discussions of what are perceived as masculine subjects (Ridgeway and Smith-Lovin Reference Ridgeway and Smith-Lovin1999). As Burns, Schlozman, and Verba (Reference Burns, Schlozman and Verba2001) suggest, politics has long been viewed as a masculine arena, and in politics, women are less likely than men to express opinions or attempt to persuade others, even controlling on level of information (Hansen Reference Hansen1997; Rapoport Reference Rapoport1981). A variety of studies thus lead us to expect that, when women discuss political issues with men, they will defer to the assumed expertise and displayed confidence of men (Aries Reference Aries, Canary and Dindia1998; Bowers, Steiner, and Sandys Reference Bowers, Steiner and Sandys2001; Croson and Gneezy Reference Croson and Gneezy2009; Eagly Reference Eagly1987; Giles et al. Reference Giles, Mulac, Bradac and Johnson1987; Hastie, Penrod, and Pennington Reference Hastie, Penrod and Pennington1983; Huckfeldt and Sprague Reference Huckfeldt and Sprague1995; Ridgeway Reference Ridgeway1982; Strodtbeck, James, and Hawkins Reference Strodtbeck, James and Hawkins1957). Therefore, when politics is the topic for deliberation, we might expect a gender gap in participation and authority in groups where women are a minority–where there are more active, confident (male) participants to whom the women defer (Aries Reference Aries, Canary and Dindia1998; Johnson Reference Johnson1994; Piliavin and Martin Reference Piliavin and Martin1978; Smith-Lovin and Brody Reference Smith-Lovin and Brody1989). This is the second rationale for the hypothesis that women speak and influence less than men as their numbers decrease.
Third, women may speak less when there are fewer women because gendered norms of interaction vary with gender composition and facilitate or hinder women's participation. The notion is that girls and boys are socialized to different gendered cultures of interaction, and they carry these implicit scripts of behavior with them into adulthood (Maltz and Borker Reference Maltz, Borker and Gumperz1982; Tannen Reference Tannen1990). In settings with many men, the interaction tends to take on more stereotypically masculine characteristics of individual assertion, agency, competition, and dominance; in contrast, in settings with many women, people tend to interact in a more stereotypically feminine style that emphasizes cooperation, intimacy, and the inclusion of all participants (Aries Reference Aries1976; Dindia and Allen Reference Dindia and Allen1992; Ellis Reference Ellis1982; McCarrick, Manderscheid, and Silbergeld Reference McCarrick, Manderscheid and Silbergeld1981; Miller Reference Miller1985; Smith-Lovin and Brody Reference Smith-Lovin and Brody1989; see Mendelberg and Karpowitz Reference Mendelberg, Karpowitz and Rosenberg2007). Therefore women may experience a greater sense of confidence in predominantly female settings with their stereotypically feminine norms of interaction, and more discomfort in predominantly male settings with their more masculine norms of interaction. For example, Kathlene (Reference Kathlene1994) found that predominantly male legislative committees in Colorado feature competitive, aggressive communication behavior that inhibits women's participation more than it does men's. In sum, this literature again suggests that women will participate less than men in predominantly male groups and will increase their participation and influence as their proportion increases.
The existing literature thus offers three distinct rationales, all of which converge on the same prediction: In mixed-gender discussions, women will speak less and be less influential than men. These disadvantages will increase as the group gender composition skews toward males.
The gender role hypothesis implies that effects will be especially pronounced when the gender imbalance in deliberating groups is extreme. For example, existing work finds that women are especially disadvantaged when they are the lone female member of their group (Craig and Sherif Reference Craig and Sherif1986; Johnson and Schulman Reference Johnson and Schulman1989). Men, however, do not suffer the same disadvantage when they are the gender “token.”Footnote 5 Therefore, token women's participation and authority will be lower than that of token men.
At the opposite end of the spectrum, the gender role hypothesis leads to the expectation that women will flourish in all-female settings. Because women are disadvantaged in political discussions with men, they may do best without any interaction with men, and may benefit most from their own discussion spaces or “enclaves” (Karpowitz, Raphael, and Hammond Reference Karpowitz, Raphael and Hammond IV2009). Women in enclaves are more likely than women in mixed groups to initiate interaction and to be addressed (Aries Reference Aries1976, 15; Carlock and Martin Reference Carlock and Martin1977; Reskin, McBrier, and Kmec Reference Reskin, McBrier and Kmec1999, 346). All-female groups elevate women's participation in politics (Burns, Schlozman, and Verba Reference Burns, Schlozman and Verba2001, 230; Crowder-Meyer Reference Crowder-Meyer2010; Skocpol Reference Skocpol1992). As Burns, Schlozman, and Verba (Reference Burns, Schlozman and Verba2001) summarize, “organizations of women provide . . . opportunities for leadership, facilitating the exercise of voice in organizational matters and the development of civic skills” (230). In general, then, the gender role hypothesis leads us to expect that groups composed exclusively of women will increase women's participation and influence.
IMPORTANCE OF THE DECISION RULE
The gender role hypothesis dominates the literature on gender and discussion, but we view that hypothesis as incomplete. The proportion of women in a group is not the only important factor that affects gendered patterns of speech participation. Institutions can eliminate the disadvantages of low numbers; similarly, they can block the power of high numbers. Specifically, we focus on the group's decision rule.
We focus on decision rules because previous work suggests that unanimous rule can create group norms that enhance consensus and inclusion. Because the minority rarely persuades the majority in small groups (Moscovici Reference Moscovici1980; Reference Moscovici, Lindzey and Aronson1985), a rule that includes minorities can substantially alter group dynamics. A seminal experimental study of mock juries reports that people shift their views during discussion more under unanimous than majority rule (Hastie, Penrod, and Pennington Reference Hastie, Penrod and Pennington1983). Unanimous rule can increase a sense that the decision was legitimate and appropriate (Kameda Reference Kameda1991; Kaplan and Miller Reference Kaplan and Miller1987; Nemeth Reference Nemeth1977). Group consensus generated through talk can lead to increased cooperative behavior (Bouas and Komorita Reference Bouas and Komorita1996), and unanimous rule leads to a full sharing of information by deliberators (Mathis Reference Mathis2011). Thus, unanimous rule leads to consensus-oriented norms of inclusion that protect numerical minorities (see also Mendelberg Reference Mendelberg and Delli Carpini2002). However, no one has considered whether this protective effect for preference minorities holds for social identity minorities. The question we pose is whether unanimous rule helps women.
We theorize that unanimous rule protects gender minorities just as it protects preference minorities because of the emphasis it places on inclusion and cooperation (Bouas and Komorita Reference Bouas and Komorita1996; Mathis Reference Mathis2011). As studies reviewed earlier show, the norm that unanimous rule creates is the expectation that everyone should be included in the decision-making process. As Mansbridge (Reference Mansbridge1983) explains, “a consensual rule can actually create unity” (256). This rule helps minorities by elevating their level of participation. Although unanimous rule may also pressure minorities to go along with the group's central tendency at the end of the day (see Devine et al. Reference Devine, Clayton, Dunford, Seying and Price2001, and Mendelberg Reference Mendelberg and Delli Carpini2002), nevertheless, unanimous rule produces the expectation that each voice should be heard. It signals that the group should orient to its members’ commonalities and that decisions should be based on equal respect (Mansbridge Reference Mansbridge1983, 14). Under unanimity, no voice can be overlooked because every vote is pivotal. Conversely, majority rule signals that conflict is acceptable and that some perspectives may not be included in the group's final decision. Majority rule sets a norm whereby decisions are based on a contest over dominance. With this norm, majorities are unlikely to emphasize inclusiveness, and minorities are unlikely to assume that their voices matter and that they should speak. Under majority rule the power of numbers matters most, and minorities are ultimately at a disadvantage.
We theorize, then, that decision rule and gender composition will interact to shape patterns of participation and influence within the group. Our interaction hypothesis rests on the claim that unanimous rule produces a group dynamic in which various types of numerical minorities—social identity as well as preference minorities—are included more than they would be otherwise (Bouas and Komorita Reference Bouas and Komorita1996; Mathis Reference Mathis2011). Compared to majority rule, unanimous rule benefits both genders when they are in the numerical minority of the group. However, the effects of unanimity are best understood in contrast to the speech participation of each gender minority under majority rule. Minority women will be included more under unanimous than majority rule, and this will decrease the gender gap. Minority men will also be included more under unanimous than under majority rule, but this will enhance rather than close the gender gap. The effect of unanimity will be roughly equal for both genders, but women will shift from under-representation to equality, whereas men will shift from equality to over-participation.
One possible explanation for why the equal effect produces different gender gaps is that each gender minority increases its participation under unanimous rule for a different reason. As noted earlier, in small group discussion, on average men tend toward individual agency, women toward cooperation (Miller Reference Miller1985; Smith-Lovin and Brody Reference Smith-Lovin and Brody1989). Therefore, women in a numerical minority may interpret unanimous rule to mean that they should make at least a minimal contribution, more than they do in majority rule, but avoid dominating the discussion. Minority men may interpret unanimous rule as a signal that they should maximize their individual participation. Consequently, men may view minority status as requiring maximum individual input from the minority and act on this view when they are the minority under unanimous rule. In sum, relative to majority rule, unanimous rule elevates the participation of both gender minorities, men and women, equally. By extension, then, unanimous rule helps female tokens, closing the gender gap in those groups, but it also helps male tokens, exacerbating the gender gap in their groups.
Our attention to the interaction of gender composition and decision rule thus significantly qualifies the gender role hypothesis. Women should increase their participation with greater numbers only under majority rule; under unanimous rule, greater numbers do not benefit women, because although this rule helps minority women, it also aids minority men to the detriment of majority women. Formally stated, our interaction hypothesis is that a significant interaction between gender composition and decision rule exists: The gender gap in speech and influence favoring men decreases as the number of women increases under majority rule; the gender gap in speech and influence favoring men increases as the number of women increases under unanimous rule.
No interactive effect of decision rule and gender has been taken into consideration in the literatures on gender or decision rule. Yet an interaction is plausible in light of what we know about each variable in isolation. Attention to this interaction represents our theoretical contribution to these literatures.
DATA, DESIGN, AND METHOD
We designed our study to generate a sufficient number of groups in various gender compositions to create adequate variance in that independent variable; to test for the predicted interactive effects of gender composition with decision rule; to use random assignment to create exogenous gender composition and decision rule variables so as to gauge their unbiased effects; and to measure the level of speech participation of individuals and match it to their individual characteristics, including their gender. Extensive detail on the procedure, subjects, item wordings and responses, coding, descriptive statistics, and other methodological matters is in the supplemental Online Appendix (available at http://www.journals.cambridge.org/psr2012012).
We use a 6 × 2 between-subjects experimental design, randomly assigning individuals to one of six gender compositions (that is, to a group that ranged from 0 to 5 women) and to one of two decision rule conditions: unanimous rule or majority rule.Footnote 6 We stratified by gender to avoid a balanced gender mix in most groups. Gender composition was randomly assigned to dates on the schedule of experimental sessions, and subjects who signed up to attend on that date were assigned to the corresponding gender composition condition. This ensured that group types did not cluster on particular days of the week and that participants had a roughly equal probability of being assigned to each group type. Thus, each man or woman had the same probability of being assigned to a given gender composition. This satisfies the random assignment assumption, which is not that each treatment is equally likely to be assigned to a given person, but rather that each person is equally likely to be assigned to a treatment (Morton and Williams Reference Morton and Williams2010). We recruited more than five participants for each session, and the alternates helped ensure that we could fill the day's assigned type of gender composition. Randomization of decision rule was achieved by the roll of dice prior to each session. Randomization checks and propensity score analyses indicate that individuals were assigned by a random process and groups were equivalent on relevant covariates.Footnote 7
Between August 2007 and February 2009, we recruited students and community members and randomly assigned them to one of the conditions. Our method followed the basic procedure of a study by Frohlich and colleagues (Frohlich and Oppenheimer Reference Frohlich and Oppenheimer1990; Reference Frohlich and Oppenheimer1992; Frohlich, Oppenheimer, and Eavey Reference Frohlich, Oppenheimer and Eavy1987). We told participants that later in the experiment they would be doing work tasks to earn money and that the amount of money each individual took home would be based on their performance on the work tasks and the group's decision about how to redistribute any money earned by group members. Prior to group deliberation they were not told the nature of the work.Footnote 8
After participants privately filled out a pretreatment questionnaire, they were brought together as a group, where they were instructed to conduct a “full and open discussion” and to choose the “most just” principle of redistribution. Following Frohlich and Oppenheimer (Reference Frohlich and Oppenheimer1992), we instructed participants to make a collective decision that would apply not only concretely and immediately to themselves and their group but also hypothetically to society at large, so we could generalize beyond the lab situation to the decisions people make about redistribution in politics. The only requirement was that they deliberate for at least five minutes before making a collective decision about the redistribution of income earned during the experiment. All instructions were exactly the same across conditions.Footnote 9 Voting on rules for the distribution of income occurred by secret ballot, with the decision based on either unanimous or majority rule. Every group included five participants.
Participants appeared to take their deliberations seriously. On average, the groups spent just over 25 minutes (SD = 11) in discussion, and some discussions lasted for more than an hour. Consistent with the instructions, group discussions nearly always explored how their choices about redistribution would work outside the experimental setting. The discussions touched on meaningful topics related to the redistribution, including the nature of equality, the needs of the poor, the importance of incentivizing work, the possibility of economic mobility, the fairness of various systems of taxation, and the value of charity. Before deliberating, participants were given information about several well-known principles of redistribution, including no redistribution at all (everyone keeps what they earn), various poverty thresholds (minimum incomes below which no one would be allowed to fall), or equal redistribution of all income earned by the group (every group member receives the same amount, regardless of performance). These different principles and their implications formed the basis for much of the group discussion. During deliberation, each participant was recorded on a separate audio track, and the full conversation was also recorded on a master track that included all participants.Footnote 10 A sample transcript is in the supplemental Online Appendix.
After the group deliberation and decision, participants were asked to indicate (privately) the most influential person in the group. Participants then performed several rounds of “work”—correcting as many spelling errors in a block of difficult text as they could find within a two-minute time limit (replicating Frohlich and Oppenheimer's [Reference Frohlich and Oppenheimer1992] choice of procedure). Participants earned money according to their performance, and these earnings were distributed to group members according to their chosen distribution scheme. At the end of the work period, participants responded to a series of questions on attitudes and beliefs and were debriefed.
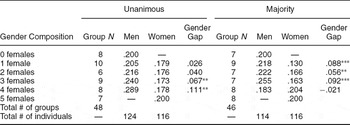
Our experiment included 470 individuals in 94 groups. Table 1 summarizes our experimental conditions and the number of participants in each. Although our statistical power was somewhat limited, our research design includes a much larger sample of groups than is typical in group research.
Average Individual Proportion Talk by Gender and Experimental Condition

Note: Gender gap is the average male Proportion Talk minus average female Proportion Talk in each condition. Positive numbers indicate male advantage. Asterisks indicate gender gaps significantly different from 0. *** p < .01; ** p < .05; * p < .10; one-tailed unpaired difference of means test, group-level analysis.
CONTROLS FOR ALTERNATIVE EXPLANATIONS
The experiment was conducted at two different sites—a small town on the mid-Atlantic coast and a medium-sized city in the Mountain West. In the regressions we control on site because subjects were assigned randomly within but not across sites. As is common in controlled experiments, our goal was not a nationally representative sample but one with sufficient variance, and the sample did vary on relevant characteristics such as SES and political attitudes (see Table A1 in the supplemental Online Appendix). Because individual race and group racial composition would introduce powerful interactions with our explanatory variables, thereby requiring a much larger number of groups, we recruited white non-Hispanic subjects only.
It is possible that gender differences are spuriously caused by preferences or attitudes correlated with individual gender. Our experiment focused on deliberation about redistribution, so preferences over the principles of redistribution or attitudes about egalitarianism are relevant. Controlling for these preferences is important because they are correlated with gender (Crowder-Meyer Reference Crowder-Meyer2007; Shapiro and Mahajan Reference Shapiro and Mahajan1986). Another possibility is that women are quiet not because of gender disadvantage or gendered communication, but because others are articulating their preferences. If one's preferences are already voiced, efficiency dictates that there is no need to waste time or effort on repetition. This would happen if women are members of the preference majority in the group, so the discussion would likely proceed in their preferred direction. To address this possibility, in our individual-level analyses we also control for the match between the individual's preference and the majority's pre-deliberation preference.
RESULTS I: SPEECH PARTICIPATION
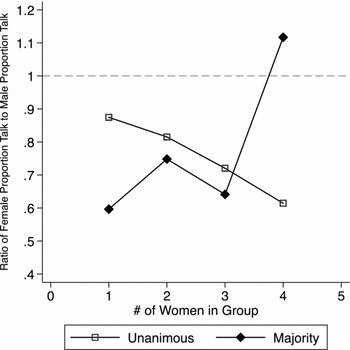
Advocates argue that well-constructed deliberations “create an environment in which [gender or class] inequalities in the broader society do not distort the deliberative process” (Fishkin et al. Reference Fishkin, He, Luskin and Siu2010, 8–9). Critics argue that deliberation entails the “the systematic disregard of ascriptively defined groups such as women” (Sanders Reference Sanders1997, 353). Which claim is more accurate? Specifically, does deliberation produce gender equality or inequality? To answer these questions, we divide the number of seconds each individual spoke by the group's total number of seconds. This is an individual's Proportion Talk (scaled 0–1), and it allows contrasts across groups with varying discussion lengths.Footnote 11Table 1 shows, for each condition, the average male Proportion Talk, the average female Proportion Talk, and the difference between them (with associated group-level t-tests).Footnote 12 If men and women participated at equal rates in a five-person group, the average individual Proportion Talk for each gender would be 0.20 (in other words, the average male and the average female would each take 20% of the conversation), resulting in a gender gap of 0. But in five of the eight conditions, the t-test indicates a statistically significant gender gap (always favoring men), partially confirming the critics’ worries. In Figure 1, the ratios of female-to-male Proportion Talk in each condition show the magnitude more clearly. In most of the conditions, women's participation is under 75% of that of men; in three of the eight conditions it is less than two-thirds of men's participation. The critics of deliberation have cause for concern—women often participate less than men, sometimes substantially so.
Ratio of Female-to-Male Speech Participation by Experimental Condition

Yet these results also show that the inequality varies with the group's decision rule and gender composition, in a pattern more consistent with the interaction hypothesis than with the gender role hypothesis. The gender role hypothesis predicts equality in the four conditions in which women are a majority and inequality in the four conditions where they are a minority. Table 1 shows that only three of these eight predictions are confirmed. But Table 1 confirms seven of the eight predictions of the interaction hypothesis: Under majority rule, there is a large and significant gender gap in the one- and two-female conditions, but not in the four-female condition; under unanimous rule, we see the reverse: a large and significant gender gap in the three- or four-female conditions but not in the one- and two-female conditions. Unanimous rule helps minority women, and larger numbers help women only under majority rule. The gender role hypothesis neither anticipates the contingent effect of gender composition nor the protective effect of unanimous rule, whereas the interaction hypothesis predicts both.
A small anomaly is the disconfirmation of one of the eight predictions of the interaction hypothesis: Under majority rule, women under-participate men in the three-female groups. Our interaction hypothesis does not predict an exact functional form for the relationship between gender composition and speech participation, leaving open the possibility that women's disadvantage is sufficiently powerful that it requires a supermajority to overcome. It is also quite possible that the result for the three-female groups is simply noise. We are reassured that the movement toward equality in the four-female groups is large and statistically meaningful. In our view, the unexpected result for the three-female groups qualifies, but does not undermine, our interaction hypothesis.
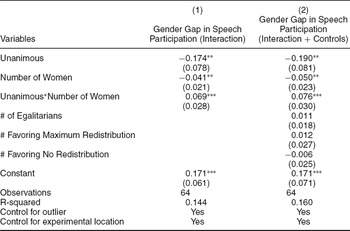
Having shown a pervasive but contingent gender gap, we directly test the competing predictions from the gender role and interaction hypotheses about what increases or decreases the gap, using ordinary least squares (OLS) with group-level data (see Table 2).Footnote 13 The dependent variable is the Gender Gap in Speech Participation (scaled −1 to 1), which is the difference between the group's average male and average female Proportion Talk. Model 1 confirms the interaction hypothesis: The coefficient on the number of women and the interaction term of number of women and unanimous rule are both in the expected direction, statistically significant, and substantively large. As the interaction hypothesis predicts, only under majority rule does the gender gap shrink as the number of women increases (evidenced by the negative and statistically significant coefficient for Number of Women); the reverse effect is obtained under unanimous rule (indicated by the positive and significant coefficient for the interaction between the number of women and unanimous rule). These interactive effects are not anticipated by the gender role hypothesis.
Determinants of the Gender Gap in Speech Participation (Group-level Analysis)

Note: Standard errors in parentheses. *** p < 0.01; ** p < 0.05; * p < 0.1; one-tailed test.
Model 2 in Table 2 also controls for alternative explanations by including three variables measured before deliberation: the number of group members who scored above the scale midpoint (nearly identical to the mean) on general egalitarianism, the number who favored no redistribution, and the number who favored very high levels of redistribution from rich to poor (see Table A2 in the supplemental Online Appendix for details of all measures). Even with these control variables, the effect of the interaction between decision rule and gender composition is strong and statistically significant, confirming our interaction hypothesis.Footnote 14
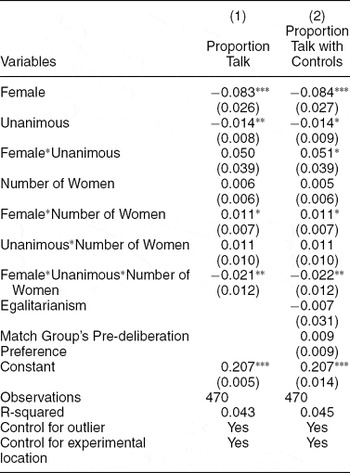
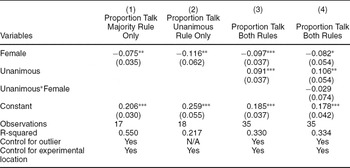
Table 3 shows an individual-level test of our hypotheses that allows us to apply additional controls. If women speak less regarding redistribution because they have more generous attitudes about redistribution, then what appear to be gender differences may be due to differences in these attitudes instead. Therefore, we include a measure of the individual's pre-deliberation level of egalitarianism. We also test the notion that women may speak less when they are satisfied with the direction of discussion not because of the group's gender composition and decision rule, but because they are part of the group's pre-deliberation preference majority. We thus include a dummy variable tapping whether the individual's pre-deliberation preferences about redistribution matched the group's pre-deliberation majority preference. We use OLS regression with cluster robust standard errors because individuals are nested within groups. The dependent variable is individual Proportion Talk (scaled 0–1).
Determinants of Speech Participation (Individual-level Analysis)

Note: Cluster robust standard errors in parentheses. *** p < 0.01; ** p < 0.05; * p < 0.1; one-tailed test.
With or without controls, the results in Table 3 confirm the interaction hypothesis. Under majority rule, women talk more, relative to men, as the number of women increases (see the positive interaction term Female*Number of Women). However, under unanimous rule, women talk less than men as the number of women increases (the negative coefficient on Female*Unanimous*Number of Women). The controls for the participants’ pre-deliberation preferences are not significant. This evidence thus undermines the alternative explanations that women are speaking less than men because (1) they have different preferences than men or (2) they do not bother to speak because others already articulate their ideas, as may occur when they are the preference majority. The gender gap is due to the different responses of women and men to the gendered dynamics in the group, as the interaction hypothesis argues.Footnote 15
Table 4 contains four models that relate to the speech participation of gender tokens. Recall that the gender role hypothesis predicts that women will be especially disadvantaged when they are an extreme minority. However, our interaction hypothesis suggests that female tokens will be helped by unanimous rule and that so will male tokens. The analysis in Table 4 compares the participation of token women to the participation of token men. In other words, it directly compares the behavior of men and women when they are in similar conditions.
Effects of Gender and Decision Rule on Token Speech Participation

Note: Standard errors in parentheses. *** p < 0.01; ** p < 0.05; * p < 0.1; one-tailed test.
In all models in Table 4, the Female term is negative, suggesting that female tokens talk less than male tokens. This finding supports the gender role hypothesis. However, Model 3 shows that the gender role hypothesis is only part of the story. Consistent with the interaction hypothesis, token males and females each perform better under unanimous rule than under majority rule (the positive, significant coefficient on the Unanimous term).Footnote 16 The difference-in-differences in the effect of unanimous rule on the two gender tokens, represented by the interaction term in Model 4, is not statistically significant: The effect of unanimity is essentially the same for men and women. This equal effect, combined with unequal starting points under majority rule, means that unanimous rule elevates the token male above his female group members while it equalizes the token female with her male group members. As the interaction hypothesis predicts, unanimous rule helps minority women but hurts majority women. This explains why, under unanimous rule, increasing the number of women does not help women.Footnote 17
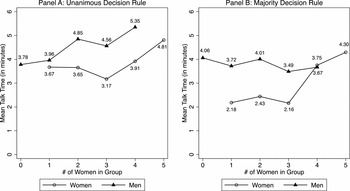
Figure 2 explores the final expectation from the gender role hypothesis: that women do best in all-female discussions, away from the forces that produce gender inequality, whereas men do not benefit from being in all-male groups. We use Talk Time, men's and women's average talk time in the group, because it allows us to examine the gender-homogeneous groups.Footnote 18 Consistent with this expectation, female participants do tend to talk longer when surrounded only by other women.Footnote 19 The average woman talks more in enclaves than in the pooled majority-female groups (significant at p < .04 in a one-tailed, group-level test and at p < .01 in a one-tailed test with individual-level data). This test is not significant for men.Footnote 20 Enclaves seem to provide some benefit to women but not to men, as the gender role hypothesis predicts.
Mean Talk Time for Men and Women by Experimental Condition

RESULTS II: PERCEIVED INFLUENCE
As we argued in the introduction, speech participation matters because it may contribute to authority, specifically perceived influence. We measured Influence after discussion by asking each group member to indicate the one person who was “most influential” in the group's discussion and decisions.Footnote 21 We tallied the number of votes each individual received, a measure that runs from 0 to 4.
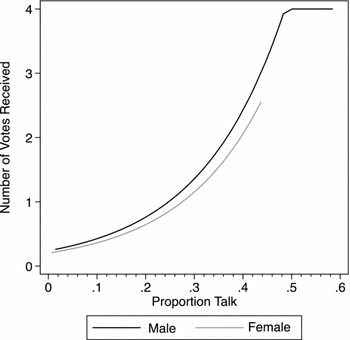
Figure 3 shows the effects of deliberative participation on Influence. The lines for men and women only extend as far as the maximum value of Proportion Talk found in the data for each gender. The figures derive from the model whose coefficients are provided with Figure 3.Footnote 22 The unit of analysis is the individual, with cluster-robust standard errors. We include controls for pre-deliberation confidence in one's own speaking ability (see the supplemental Online Appendix for wording) and whether or not the individual's pre-deliberation preferences matched the group's eventual decision as controls on individual gender. The results are similar without these controls or when additional demographic controls are added, including income and party preference.Footnote 23 Participants who held the floor for a greater percentage of the group's deliberation were more likely to be seen as influential by the other members of the group. Thus the active use of voice translates into greater perceived influence, as we expected.
Proportion Talk's Effect on Perceived Influence

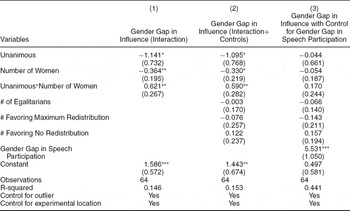
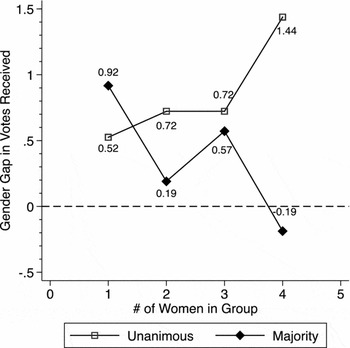
Because speech is related to authority, our interaction hypothesis expects that authority is also directly affected by the interaction of women's numbers and the decision rule. Figure 4 illustrates the large magnitude of the gender gap and the predicted interactive effect of the decision rule and composition on perceived Influence.Footnote 24 In Table 5, we test our interaction hypothesis using the same group-level OLS models we used to test the Gender Gap in Speech Participation, this time with the Gender Gap in Influence as the dependent variable (the average number of influence votes in the group for men minus the average number of votes in the group for women, scaled −4 to 4). Model 1 tests our hypothesized interaction effect, and Model 2 adds controls for alternative explanations. The results offer evidence that the gap in influence narrows as the number of women increases under majority rule, in line with both our hypothesis and the gender role hypothesis, but expands significantly in groups with more women under unanimous rule. Controls for alternative explanations do not alter the findings. Together, these results offer strong validation for our interaction hypothesis.
Determinants of Gender Gap in Influence

Note: Standard errors in parentheses. *** p < 0.01; ** p < 0.05; * p < 0.1; one-tailed test.
Gender Gap in Influence by Experimental Condition

To better illustrate the magnitude of the interactive effect, consider who wins the influence vote count: When women are the majority, a woman is much more likely to win under majority rule (73%) than unanimity (53%); as the minority, women win more often under unanimous (25%) than majority rule (13%).Footnote 25 In majority groups, no token woman ever wins. Influence within the group is thus structured by the interaction of gender composition and decision rule, as the interaction hypothesis predicts: The same conditions that create disproportionate silence by women also create disproportionate authority for men.
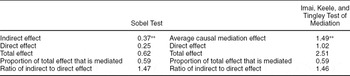
Model 3 also tests whether speaking behavior mediates the effect of the conditions on influence, as we expect. Baron and Kenny (Reference Baron and Kenny1986) suggest that a test of mediation should include three models: one that shows a relationship between the conditions and the Gender Gap in Speech Participation, another that shows a relationship between the conditions and the Gender Gap in Influence, and a third that shows a smaller or nonexistent relationship between the conditions and the Gender Gap in Influence when the Gender Gap in Speech Participation is included in the model. Model 3 in Table 5 shows that the interaction in Models 1 and 2 disappears once the Gender Gap in Speech Participation is included. Thus, the effect of the conditions on influence is mediated by speech participation.
We employ the formal test of mediation of Imai, Keele, and Tingley (Reference Imai, Keele and Tingley2010). Table 6 shows that a significant percentage of the effect of our interacted experimental conditions on the Gender Gap in Influence – 59% – is mediated by the Gender Gap in Speech Participation.Footnote 26 A Sobel test yields similar results. Together, the regressions and mediation tests show that speech matters: It affects influence. Conditions that increase speech increase influence and thus authority, and they do so in interaction, as the interaction hypothesis predicts.
Results of Mediation Analysis

Note: The analysis shows how much of the effect of the interaction between gender composition and decision rule (Unanimous*Number of Women) on the Gender Gap in Influence is mediated by the Gender Gap in Speech Participation. Analyses are group-level; in addition to the interaction term, models include main effects for group gender composition and for decision rule; controls are for outlier group and experimental location. Asterisks indicate a statistically significant mediation effect. ** p < 0.05.
SUMMARY
Our analyses provide mixed support for the gender role hypothesis. Our first supportive finding is that women are often disadvantaged in speech participation, whereas men are never disadvantaged. Second, women participate less than their equal share when they are a minority and at equal rates when in a large majority (at least under majority rule). Third, women tend to do best in homogeneous groups. Fourth, female tokens participate less than male tokens. Fifth, women's influence gap shrinks as their numbers grow (under majority rule).
However, contrary to the gender role hypothesis, in unanimous groups, women are not disadvantaged in voice or authority when in the minority, and unanimity substantially boosts the speech participation of minority women, relative to majority rule. Finally, and most troublesome for the gender role hypothesis, under unanimous rule, the gender gap in voice and authority is biggest when women are a majority, not a minority.
The interaction of decision rule and group gender composition best explains this pattern of results. The gender role hypothesis is largely correct under majority rule, but is largely incorrect under unanimous rule. Unanimous rule protects minority women, and under this decision rule they take up their equal share of the conversation, but it is a double-edged sword because it also protects minority men. Minority women leverage unanimous rule to reach equality, whereas minority men leverage it to exceed equality. Rule protects or hinders numerical minorities depending on who these minorities are. These conclusions about rule would not be possible without interacting it with gender composition.
ALTERNATIVE EXPLANATIONS AND CAVEATS
Our results allow us to address several alternative explanations. First, one might argue that low talk time is not a problem if it is caused by efficiency—if it occurs when there is no need to repeat what others already said because one is in the preference majority. In response, we showed that women speak less than men whether their preference is widely shared or not. In addition, if women are silent because they are the preference majority, that does not explain the interactive effects.Footnote 27 Thus, less voice is an indicator of less influence, not the product of a desire to avoid redundancy with preference allies. Second, the controls reassure us that the differences between women and men are not due to a correlated difference in attitudes about redistribution, but to the divergent responses of men and women to the interaction taking place. Finally, although randomly distributed chattiness may partially explain why some people talk more than others, it does not explain the gender gap or why it changes as it does. There are likely considerable differences among men and among women, but there is also a difference between the sexes. The effects really are due to gender.
We offer caveats about the results. Our study featured a small group size not uncharacteristic in real-world deliberations (e.g., Esterling, Fung, and Lee Reference Esterling, Fung and Lee2009), but worth further study as a possible effect moderator. The mitigating influence of discussion moderators also merits investigation (Humphreys, Masters, and Sandbu Reference Humphreys, Masters and Sandbu2006), although moderators often focus more on airing various views than on assuring equal floor time and an opportunity to influence for disadvantaged populations, and they tend not to focus at all on gender (Mansbridge et al. Reference Mansbridge, Hartz-Karp, Amengual and Gastil2006).Footnote 28 Our study was conducted with non-Hispanic whites since the effects may differ for other populations; this too can be tested in future work.Footnote 29
Although our study was conducted under controlled circumstances, its high internal validity is valuable despite the tradeoff with external validity (McDermott Reference McDermott, Druckman, Green, Kuklinski and Lupia2011). We further note that the task resembled the task in many deliberative settings—people made decisions about the distribution of resources to themselves and to others in society. Although these decisions were nonbinding outside of the experimental setting, so are the recommendations of many actual citizens’ deliberative bodies. In addition, although we assembled people unfamiliar with each other to avoid the confounding effects from familiarity, so do many real-world settings. These settings include juries; civic deliberations (e.g., rebuilding the World Trade Center, or town planning) (Fung Reference Fung2003); government-organized meetings such as on the siting of hazardous materials; and local boards and commissions, which tend to meet infrequently and have high turnover (Crowder-Meyer Reference Crowder-Meyer2010). As Jacobs, Cook, and Delli Carpini (Reference Jacobs, Cook and Delli Carpini2009) found, meeting attendees are highly unlikely to know each other (72). Our experimental setting thus shares important similarities with many groups of citizens who deliberate on issues of importance to their communities all across the United States.Footnote 30
CONCLUSION
Advocates of deliberative democracy posit equal participation as a necessary requirement of deliberation. Our results show how far actual deliberation deviates from that ideal standard: In our study, women speak substantially less than men in most mixed-gender combinations. Further, speech is a crucial form of participation that substantially shapes perceptions of authority. As critics of deliberation contend, deliberation can produce inequalities of participation that affect deliberators’ influence.
Unequal time used, not merely unequal speaking opportunities given, is problematic for democratic deliberation especially when it is associated with lower authority. Even if men and women enter deliberation with the same preferences and equal formal rights, the disproportionate exercise of these rights by men erodes the political and civic standing of women, a group not yet equal in society.
But these inequalities must be understood in light of the gender context and institutional rules within which men and women deliberate because the effect of gender is contingent on the structure of the group setting. This finding has direct implications for the debate among political theorists about whether deliberation is a positive force for democracy and its precept of equality or instead undermines the voices of subordinate group members. We suggest that a way to resolve this debate is to focus on the conditions that give rise to one or the other. Both views have empirical support—but are contingent on circumstances. The fact that gender inequality disappears under some conditions means that deliberation can in fact meet the standard of equality, as its advocates contend.
Our results have practical implications for designing policy to enhance democratic participation.Footnote 31 It is possible to produce equal voice in citizen deliberation by adopting specific decision rules and assigning deliberators to particular gender compositions. Many government and nongovernmental organizations that run discussions can do so because they control the conditions of deliberation. The results provide some simple guidelines for promoting gender equality of participation and influence. When women are outnumbered by men, use unanimous rule; when women are a large majority, decide by majority rule. To avoid the maximum inequality, avoid groups with few women and majority rule. To minimize male advantage, assemble groups with a supermajority of women and use majority rule. To maximize women's individual participation, gender-homogeneous groups are best.
More generally, our study yields substantively important results. Perhaps most importantly, it shows that political science has something unique to add to the study of gender relations: the notion that the institutional rules under which men and women participate in collective decision making have a significant effect on gender dynamics. Studies of women's representation in legislatures recognize the importance of institutional rules and norms (Carroll Reference Carroll2001; Grunenfelder and Baechtiger Reference Grunenfelder and Baechtiger2007). Our results suggest that rules and norms also shape interactions among citizens.
This study also reinforces the notion in several recent studies of political behavior that gender effects are contingent on the environment. Burns, Schlozman, and Verba (Reference Burns, Schlozman and Verba2001), for example, found that the gender composition of the political environment—the density of women running for high-visibility office or the gender composition of civic groups—can increase women's level of political information, interest, efficacy, and participation (see also Crowder-Meyer Reference Crowder-Meyer2010). This finding implies a conceptual distinction between individual gender versus gender composition and other gendered aspects of the setting (see Sapiro Reference Sapiro, Sears, Huddy and Jervis2003). Studies of political behavior or of political decision making may not capture all that gender does if they only account for individual-level gender and omit gender composition and gendered interaction. For example, Hickerson and Gastil's (Reference Hickerson and Gastil2008) study of deliberation found no differences between men and women and “calls into question” the concern over social difference and equality. Our study supports the concern about equality in part because it analyzes gender not only as a difference between men and women but also as a characteristic of the environment.
Yet although the results are in line with some existing hypotheses about gender composition or institutional rules, our chief result goes beyond the existing research. The interdependent effects of gender composition and decision rule in small group interaction have not been a focus of any literature. We find that these effects matter for both men and women, and for the ability of democratic institutions to reach normative goals of equality.
Finally, our results have implications for the debate over substantive versus descriptive representation. As Mansbridge (Reference Mansbridge1999) notes, “In theory, deliberation seems to require only a single representative, or a ‘threshold’ presence, in the deliberation to contribute to the larger understanding. . . . [I]n practice, however, disadvantaged groups often need the full representation that proportionality allows in order to achieve several goals: deliberative synergy, critical mass, dispersion of influence, and a range of views within the group” (636).We argue that the same logic applies to the volume of voice. Mansbridge is correct that “getting the relevant facts, insights, and perspectives into the deliberation” is not enough for substantive representation; it is also necessary that many members of the disadvantaged group air those facts, insights, and perspectives and that they do so more than once. The conditions that promote this process are worthy of continuing investigation.




Comments
No Comments have been published for this article.