Introduction
Illite and mixed-layered illite-smectites (I-S) are the most abundant clay minerals in the Earth’s crust; they comprise ~40% of the modal mineralogy of sedimentary rocks and also form common constituents of hydrothermally altered rocks. Clay-mineral diagenesis may be characterized by smectite illitization reactions in which smectite transforms to illite through the development of a series of mixed-layered I-S phases; i.e.:

Illitization reactions have been documented during burial diagenesis of argillaceous sediments (Dunoyer de Segonzac Reference Dunoyer de Segonzac1970; Perry & Hower Reference Perry and Hower1970; van Moort Reference Van Moort1971; Foscolos & Kodama Reference Foscolos and Kodama1974; Heling Reference Heling1974; Hower et al. Reference Hower, Eslinger, Hower and Perry1976; Boles & Franks Reference Boles and Franks1979), hydrothermal alteration of volcanic deposits (Inoue et al. Reference Inoue, Minto and Utada1978; Inoue & Utada Reference Inoue and Utada1983), alteration of sediments in geothermal environments (Muffler & White Reference Muffler and White1969; McDowell & Elders Reference McDowell and Elders1980; Lonker et al. Reference Lonker, Fitz Gerald, Hedenquist and Walshe1990), and contact metamorphism of shales (Nadeau & Reynolds Jr Reference Nadeau and Reynolds1981; Pytte & Reynolds Reference Pytte, Reynolds, Naeser and McCulloh1989; Drits et al. Reference Drits, Lindgreen, Sakharov, Jakobsen, Fallick, Salyn, Dainyk, Zviagina and Barfod2007). In earlier investigations, K-fixation (Hower et al. Reference Hower, Eslinger, Hower and Perry1976; Eberl & Hower Reference Eberl and Hower1977), selective cannibalization of smectite layers of I-S (Pollastro Reference Pollastro1985), smectite dissolution, and concomitant crystallization of illite (Ahn & Peacor Reference Ahn and Peacor1986; Dong & Peacor Reference Dong and Peacor1996) have been evaluated as possible factors governing illitization reactions. The illitization reaction becomes detectable at temperatures higher than surface temperatures (50°C, Perry & Hower Reference Perry and Hower1970) and the estimated temperature for the development of zero expandable illite varies from 200 to 264°C (Steiner Reference Steiner1968; Inoue et al. Reference Inoue, Minto and Utada1978; McDowell & Elders Reference McDowell and Elders1980; Inoue & Utada Reference Inoue and Utada1983) and underscores that factors besides temperature, such as the composition of coexisting pore fluids (Roberson & Lahann Reference Roberson and Lahann1981; Inoue Reference Inoue1983), determine the extent of smectite illitization in a particular setting. In addition, in some geothermal and/or hydrothermally altered assemblages, smectite, ordered I-S, and illite crystallized directly from hydrothermal solutions without undergoing the stepwise transformation typical of illitization reactions (e.g. Tillick et al. Reference Tillick, Peacor and Mauk2001).
The mineralogical and geochemical consequences of the particular mechanisms by which illitization may occur (solid-state transformation, dissolution and crystallization, and Ostwald ripening) have been evaluated by Altaner & Ylagan (Reference Altaner and Ylagan1997); in their analyses, those authors concluded that Ostwald ripening describes illitization rather poorly owing to the progressive mineralogical and chemical changes during illitization. They further concluded that a solid-state transformation mechanism models illitization in rock-dominated systems such as bentonite whereas a dissolution and crystallization mechanism applies to fluid-dominated systems typified by sandstones and hydrothermal environments; ostensibly, both mechanisms may occur in shales, and permeability may explain the differences in reaction mechanism. In other words, both solid state transformation and dissolution-crystallization take place in a fluid medium though the former occurs under a more limited supply of fluids. Both mechanisms may thus simply be expressions of the effect of variable fluid/rock ratios on the same neoformation process.
Illitization reactions have also been shown to be catalyzed by microbial mineral reactions (Kim et al. Reference Kim, Dong, Seabaugh, Newell and Eberl2004, Reference Kim, Dong, Yang, Park, Elliott, Spivack, Koo, Kim, Morono, Henkel, Inagaki, Zeng, Hoshino and Heuer2019; Zhang et al. Reference Zhang, Kim, Dong and Sommer2007; Jaisi et al. Reference Jaisi, Eberl, Dong and Kim2011). Kim et al. (Reference Kim, Dong, Seabaugh, Newell and Eberl2004) effected the conversion of smectite to illite by incubating a dissimilatory metal-reducing bacterium (Shewanella oneidensis strain MR-I) with nontronite for 14 days at 1 atmosphere; the reduction of structural trivalent iron by the microbes promoted the dissolution of the Fe-rich smectite and subsequent neoformation of an illite. In a test of the idea that the smectite-to-illite reaction can be promoted by bacteria in the presence of organic matter, Zhang et al. (Reference Zhang, Kim, Dong and Sommer2007) demonstrated that bioreduction of Fe(III) in Fe-rich smectites owing to intercalated organic matter may promote illitization in some instances (e.g. cysteine-intercalated nontronite) whereas in other instances (e.g. toluene-intercalated nontronite) intercalated organic matter does not promote illitization; in the former case, the catalytic consequences of bioreduction concurred with the notion of a dramatic reduction in the required geologic time and elevated temperature. Jaisi et al. (Reference Jaisi, Eberl, Dong and Kim2011) studied the effects of a variety of factors (pH, temperature, solution chemistry, and aging) on a microbially mediated smectite illitization reaction, and thus further confirmed that the formation of illite during smectite-to-illite reaction may be catalyzed by bioreduction, and this depresses the temperature and time normally required for illitization by inorganic geochemical processes. In a natural analogue investigation of microbially mediated illitization, Kim et al. (Reference Kim, Dong, Yang, Park, Elliott, Spivack, Koo, Kim, Morono, Henkel, Inagaki, Zeng, Hoshino and Heuer2019) studied sediments from the International Ocean Discovery Program (IODP) Site C0023, Nankai Trough, offshore Japan; they concluded that illite abundance in the deepest sediment (700–1300 m) is consistent with abiotic burial diagenesis whereas diagenetic alterations in the intermediate zone (400–700 m) may have resulted from a microbially induced smectite-to-illite transition by means of biotic reduction of phyllosilicate structural Fe(III) in clays of the IODP mudstones.
The illitization of smectite through mixed-layered I-S has been viewed as an application of Ostwald’s step rule (Morse & Casey Reference Morse and Casey1988); i.e., “If a reaction can result in several products, it is not the stablest state with the least amount of free energy that is initially obtained, but the least stable one, lying nearest to the original state in free energy” (Ostwald Reference Ostwald1897). Clay-mineral formation and paragenesis have, thus, been thought to follow the Ostwald step rule and ripening processes, though they tend to form more ordered or complex structures (compared to carbonates and oxides) with time (Morse & Casey Reference Morse and Casey1988). The Ostwald step rule implies that mineral paragenetic pathways may proceed via thermodynamically unfavored phases and thus clay diagenetic transformations may reflect a disequilibrium process controlled by relative rates. Ordinarily, the operation of the step rule would reflect the kinetic advantages of forming metastable intermediates relative to the comparative rate of forming the stable phases directly. Nonetheless, the Ostwald step rule is simply a qualitative description of empirical observation (e.g. Chung et al. Reference Chung, Kim, Kim and Kim2009) and does not provide a rigorous thermodynamic and, hence, predictive model of mineral behavior. Clearly, the question is still largely unresolved as to whether the treatment of clay-mineral paragenesis in low-temperature environments should adopt kinetic formalisms rather than equilibrium thermodynamic approaches. The development of an accurate model of the thermodynamic status of smectite, I-S, and illite serves crucial heuristic and practical purposes; in this discussion, the question of the stability or metastability of these clay minerals will be reassessed in light of recent structural and experimental thermodynamic data.
Illitization and Ostwald Processes
Ostwald ripening (or coarsening) is undergone by metallic and non-metallic systems and describes a phase-transformation process following nucleation in a given medium containing particles with various sizes. Such an ensemble of nucleated particles does not represent a minimum energy configuration owing to the excess surface energy present in the system. To achieve thermodynamic equilibrium, surface-energy minimization is achieved by the growth of large particles with a concomitant dissolution of smaller particles; the total energy of the system is, thus, decreased by the interfacial energy-driven mass transfer. In a closed system, the surface-energy minimization reaches a theoretical endpoint when a single crystal containing the entire volume fraction of the growing phase forms. Also, morphological changes may occur owing to the dissolution of the small particles and subsequent transfer of their mass to the larger particles. The theoretical underpinning of Ostwald ripening, provided by Lifshitz & Sloyozov (Reference Lifshitz and Slyozov1961) and Wagner (Reference Wagner1961) (the LSW theory), made quantitative predictions on the long-time behavior of coarsening systems by assuming that the coarsening rate of a particle is independent of its surroundings; hence, at long times the cube of the average particle radius should vary linearly with time, and when scaled by the average radius, the particle radii should assume a time-independent form (see discussions in Baldan Reference Baldan2002). However, the time-independent distribution of radii predicted by LSW is usually not observed experimentally. Because Ostwald ripening has been presumed to be the basic process of aggrading neomorphism (Morse & Casey Reference Morse and Casey1988 and references therein), several studies of morphological and crystal-size distributions of illite and I-S clay minerals samples from a variety of geological settings have been reported in the literature.
Morphometry of Illite and I-S Crystallites
The implications of recent morphometric studies (Eberl & Środoń Reference Eberl and Środoń1988; Inoue et al. Reference Inoue, Velde, Meunier and Touchard1988; Lanson & Champion Reference Lanson and Champion1991; Eberl et al. Reference Eberl, Środoń, Kralik, Taylor and Peterman1990, Reference Eberl, Drits and Środoń1998; Inoue & Kitagawa Reference Inoue and Kitagawa1994; Środoń et al. Reference Środoh, Eberl and Drits2000) for illite stability and for illitization mechanism are somewhat unresolved. The sericites from the Silverton caldera (Colorado), formed by hydrothermal alteration, exhibited a linear relation between apparent K-Ar age and maximum expandability of the sericites which was attributed to Ostwald ripening of an older clay during a later hydrothermal event (Eberl & Środoń Reference Eberl and Środoń1988); the shape of the steady-state profiles of the reduced coordinates of the grain-size distribution histograms appeared indicative of Ostwald ripening in a closed system. The maximum size of the steady-state profiles and the general shape of the profiles, however, do not match any of the theoretically calculated profiles, and an inverse correlation between maximum expandability and fixed interlayer charge (K + Na) per half unit cell was also documented, which is indicative of chemical changes during the hydrothermal alteration of the sericites.
Crystal-size analyses have also been reported in a study of the applicability of Ostwald ripening to I-S reactions for a series of I-S minerals from the Shinzan (Japan) hydrothermal area (Inoue et al. Reference Inoue, Velde, Meunier and Touchard1988). That study focused on the illite-growth mechanism during illitization of I-S clay having 50–0% expandable layers because of the presumption that short- and long-range ordered I-S grains with 50–0% expandable layers are immature illites undergoing growth; the K content per half unit cell for the samples investigated varied from 0.29±0.07 (55±5% expandable) to 0.80 ± 0.01 (0% expandable). They deduced that grain-length and grain-width histograms vary systematically as functions of percent expandable layers, and the length and width distributions normalized to the modes give steady-state profiles. These observations were interpreted to mean that the Ostwald ripening process governed the coarsening in the lateral faces of I-S particles and that the shape of steady-state profiles demonstrated that the growth of the I-S minerals is dominated by a spiral-growth mechanism inasmuch as Ostwald ripening theory predicts a steady state profile when a grain-size histogram is plotted in reduced coordinates. Hence, the same Ostwald ripening mechanism can be used to describe growth of both the lath-shaped particles (55–20% expandable I-S) and the hexagonal shaped particles (20–0% expandable I-S) (Inoue et al. Reference Inoue, Velde, Meunier and Touchard1988). As was the case for the Silverton sericites, the samples studied underwent compositional changes (as indicated by K x /O10(OH)2).
In further morphological studies of smectite illitization owing to Miocene Kuroko ore mineralization, Inoue & Kitagawa (Reference Inoue and Kitagawa1994) investigated I-S and illite from the Kamikita hydrothermal alteration area (Japan); for the samples studied, expandable layers varied from 12 to 0%. The reduced size coordinates yielded steady-state profiles that were independent of the formation ages and temperatures, and also skewed towards larger values for particle-size distribution. The steady-state profiles of the normalized distribution of particle diameter and particle thickness were deemed to be consistent with the Ostwald ripening mechanism during the late stages of illitization. Moreover, the growth spirals occurred most commonly on the basal surfaces of illite crystals, which they interpreted to mean that spiral growth was the growth-controlling mechanism for the Ostwald ripening during the late stages of illitization; also, the normalized particle-size distribution curves fitted better to a log-normal distribution curve than to the theoretical profile calculated for a screw-dislocation (Inoue & Kitagawa Reference Inoue and Kitagawa1994).
Clay samples from the late-stage burial diagenetic alteration of smectite to illite (i.e. ordered mixed-layered I-S → illite) sequence of the Paris Basin were studied by Lanson & Champion (Reference Lanson and Champion1991). They documented the existence of two particle populations including an illitic phase that changes little with depth and an I-S phase that becomes less smectitic with depth. Particle sizes for the illitic samples (whole samples, lath-shaped, and hexagonal-shaped) plotted as reduced coordinates skew to larger sizes as is expected for dynamic crystal growth typical of the Ostwald ripening mechanism. However, the normalized modes of the grain-size distribution fit log-normal distributions and, moreover, Ostwald ripening is strictly applicable to a monomineralic closed system, constraints which are not satisfied in those studies (Lanson & Champion Reference Lanson and Champion1991).
The universality of the log-normal distribution of crystal-size distributions of illite fundamental-particle thicknesses was further validated by Środoń et al. (Reference Środoh, Eberl and Drits2000) using samples collected from several bentonites and hydrothermally altered volcanics (Upper Silesia Coal Basin Carboniferous bentonite, Welsh Borderlands Silurian bentonite, hydrothermally altered Silverton caldera sericites, hydrothermally altered rhyolite from Zempleni Hills (Hungary), East Slovak basin Miocene bentonite, hydrothermally altered volcanics from Central Slovakia, and hydrothermally altered Miocene volcanics from Japan). Furthermore, those authors concluded that the three-dimensional crystal-growth characteristic of the latter stages of illitization cannot be explained by Ostwald ripening, supply-controlled crystal growth, or the coalescence of smectite layers and that these crystal-growth mechanisms do not explain the observed evolution of the mean and variance of the crystal dimensions and the observed shapes of crystal-thickness distributions. On the whole, crystal-size distributions of illitic and I-S samples from bentonites, hydrothermal altered volcanic rocks, and burial diagenetic sequences have been shown by the various studies to be log-normal distributions.
The probability density function of a log-normal distribution of the variable X conforms to the model (Eberl et al. Reference Eberl, Drits and Środoń1998; Środoń et al. Reference Środoh, Eberl and Drits2000):

If X is the crystal dimension and f(X) is the observed frequency of the crystal dimension, then the mean of the logarithm of the crystal dimension (α) and the variance of the crystal dimension (β) are given by the following:


Moreover, a log-normal distribution of crystal-size distribution reflects crystal growth predicated on size-dependent growth and results from the operation of the Law of Proportionate Effect, given as (Eberl et al. Reference Eberl, Drits and Środoń1998):

where X j is the initial crystal size parameter, X j + 1 is the new crystal-size parameter after one growth cycle, and ϵ j is a random varied number (with value between 0 and 1) that measures the system’s variability. Implicit in the factor of system variability are the effects of the geological environment, the thermodynamic properties of the minerals, and petrophysical constraints on the crystal-growth processes. The effect of system variability on clay-mineral growth and stability, implicit in the operation of the law of proportionate effect, probably translates into the question of the effect of the rate of entropy production on clay-mineral neoformation and stability.
Entropy Production and Crystal-size Distributions
In general, log-normal distributions reflect the cumulative product of a variable influenced by many small independent factors and are indicative of the multiplicity of factors in the illite growth mechanism during illitization; their characteristic skew apparently arises from the non-linear fluctuations in successive reaction steps and, hence, the utility of the law of proportionate effect in reproducing log-normal distributions of crystal sizes. Because skewed distributions are common when variance is large, log-normal distributions apparently derive from the increasing entropy of equilibrium distributions of natural processes of growth. In other words, log-normal distribution is the maximum entropy probability distribution for a random variable X for which the mean (see Eq. 2) and variance (see Eq. 3) of ln(X) are specified (Berrill & Davis Reference Berrill and Davis1980; Groṅholm & Annila Reference Gro$nDholm and Annila2007). The principle of maximum entropy is rooted in the second law of thermodynamics and applies when non-uniformity of outcomes (in this case crystal growth) is expected and provides that as a physical system evolves toward equilibrium its entropy is increasing. For heterogeneous systems undergoing reactions in which chemical reactions are distributing matter among various chemical compounds, the total probability of the interactions quantifies the entropy; i.e., S = RlnP where P is the overall probability. For such a heterogeneous system containing a total number of reacting atomic constituents, N j , the entropy in the system (Sharma & Annila Reference Sharma and Annila2007) is:

where S is the entropy, T denotes absolute temperature, R is the universal gas constant, and A j is chemical affinity. The time derivative of Eq. 5 is the rate of entropy production (Sharma & Annila Reference Sharma and Annila2007); i.e.

The rate of entropy production (Eq. 6) embodies the exchange of entropy and matter with the surroundings and also the rate of entropy production due to irreversible processes associated with the various reactions. Thus, the log-normal distributions may derive from the increasing entropy of equilibrium distributions of natural processes of growth inclusive of the effect of system variability on the growing crystals.
Crystal Size and Stability of Clay Minerals
The small size of clay minerals in surface and near-surface environments has been held to reflect details of their crystal structure rather than the temperature and pressure conditions at which they formed (Meunier Reference Meunier2006). In his excellent review article, Meunier (Reference Meunier2006) reasoned that genetic models for the small crystal sizes of clay minerals and the allomorphic shape of some clay minerals derive from the effect of order-disorder on the crystal-growth processes of clay minerals. Clay-mineral structures contain various scales of disorder which are expressed ultimately as structural defects. These structural defects include defects in the c direction, which may arise from faults in stacking layers of constant thickness or from stacking layers of variable thickness which gives rise to mixed layers. In addition, crystal defects inside the 2:1 layer may arise from order-disorder within the tetrahedral sheets, order-disorder in dioctahedral sheets, and order-disorder in the interlayer zone. Within the framework of periodic bond chains (Hartman Reference Hartman and Hartman1973), Meunier (Reference Meunier2006) speculated that the state of order affects the development of the periodic bond chain (PBC). A random distribution of interlayer cations leads to development of zero PBC and, hence, favors small montmorillonite crystallites. In contrast, incorporation of ordered interlayer cations (in beidellite, vermiculite, and illite) imply the existence of up to 3 PBCs and, hence, the development of euhedral crystallites. Meunier (Reference Meunier2006) further speculated that the presence of numerous crystal defects hinders the growth of nucleated crystallites; thus, in the low-temperature conditions (T ≤ 250°C) of clay genesis, nucleation is always favored over crystal growth, leading to the characteristic small size of clay minerals.
An alternative model, however, is that the small size of clay minerals is a function of the temperature and pressure conditions at which they grow and reflects constraints present during growth. Illitization reactions are driven by increasing temperatures and, given that entropy production drives chemical reactions that occur in response to heating effects (Loucks Reference Loucks1991), illite formation and stability may be impacted significantly by the rate of entropy production. Within the context of irreversible thermodynamics, entropy production per unit time in an isolated system may be given (Prigogine Reference Prigogine1961) as:

where
 is the rate of entropy production owing to changes in the system, A
p
is the chemical affinity of the p
th reaction which is linked to the chemical potential of the reacting species and vanishes at equilibrium,
 is the reaction velocity or the rate of change of the progress variable of the p
th reaction, and T is the absolute temperature. The rate of entropy production is an inverse function of temperature (Eq. 7) and, thus, entropy production for illitic phases formed during prograde illitization will diminish with increasing temperatures of illitization up to the stability limit of illite; by contrast, entropy production is likely to be a less significant factor in the formation and stability of macroscopic mica (being higher temperature phases) relative to illite. One aspect of entropy production during the crystallization of the illitic phases may derive partly from the entropic contribution of structural water to the intermolecular bond energy and may be amplified by the variable states of structurally bound water in illites and I-S phases.
Effects of Bound Interlayer Water
The molar proportion of structurally bound H2O [H2O(+)] as a function of the molar proportion of interlayer cations was evaluated by Loucks (Reference Loucks1991) based on 72 wet-chemical analyses of muscovite, lepidolite, and illite from igneous, metamorphic, low-pressure hydrothermal, and sedimentary environments; he presumed the limiting substitutions:

His analysis demonstrated that the total structural H2O contents may be predicted by assuming that the interlayer may contain both neutral water molecules and hydronium ions, (H3O)+, associable with hydropyrophyllite [(H2O)Al2Si4O10(OH)2] and hydromica [(H3O+)Al2AlSi3O10(OH)2] components, respectively. On average, the hydromica substitution (H3O)K−1 accounts for 73% of interlayer H2O in the sample group, whereas the hydropyrophyllite substitution H2OSi(KAl)−1 accounts for only 27% of the interlayer H2O in the average muscovite. However, because of the sparsity of high-quality analytical data, the analyses included only five illitic samples, and this raises the question whether the contribution of the Al2Si4O10(OH)2 ⇋ KAl2AlSi3O10(OH)2 substitution to the compositional trend might be greater. Nonetheless, the systematic variation in white mica H2O content is amenable to a crystal-chemical model that considers all interlayer sites to be occupied by alkali and alkaline earth cations, hydronium ions, and H2O molecules. In terms of the various thermal regimes covered by the study of Loucks (Reference Loucks1991), structurally bound water in illitic phases from low-temperature sedimentary environments have both more variation in the amounts of structural water and substantially larger mean values compared to micas from hydrothermal and metamorphic environments. Water in igneous and high-grade metamorphic micas approximates the stoichiometric OH-halogen allotments and are also the least amount of water in these phases.
The variable states of structurally bound water would probably contribute to the Gibbs free energy of crystallization of illitic phases such that (cf. Yau et al. Reference Yau, Petsev, Thomas and Vekilov2000):

The notion that the variable states of structural water enhance significantly the stability of illitic phases (Loucks Reference Loucks1991) is consistent with the understanding that the structuring of water molecules is an important thermodynamic driver of crystallization (De Yoreo & Vekilov Reference De Yoreo and Vekilov2003).
A Thermodynamic Model of Clay-Mineral Behavior
Clay minerals are hydrous phases the formation of which results from water–rock interactions in surface and near-surface environments. Consequently, solubility techniques (either solution equilibration or solubility sensu stricto) provide a unique way to assess directly the thermodynamic behaviors of minerals in this mineral group. Experimental determination of the stability of clay minerals faces challenges peculiar to the low-temperature regimes of their occurrences (see review by Manning Reference Manning, Worden and Morad2003), and the demonstration of the attainment of equilibrium in solubility measurements has been a particularly vexing question. Numerous solubility studies have been reported in the literature for various clay minerals and, in some of the earliest studies (e.g. Reesman & Keller Reference Reesman and Keller1968; Routson & Kittrick Reference Routson and Kittrick1971), the attainment of equilibrium was not demonstrated affirmatively; rather equilibrium was presumed and the identity of the solubility-controlling phases was not ascertained directly. The bulk compositions of the starting natural clays were, thus, wrongly presumed to be the same as the composition of the solubility-controlling phases and, moreover, ion speciation analyses of the reacted solutions were generally omitted. Owing to these earlier shortcomings, recent reviews of the clay-solubility literature have tended to be generally dismissive of all solubility studies regardless of whatever adaptations had been undertaken in later studies to correct deficiencies of the earlier studies, thus necessitating some further clarifications.
Solution Equilibration Investigations
Experimental investigations of the thermodynamic stability of natural illites are constrained by the rarity of single-phase, monomineralic reference or standard illite samples. X-ray powder diffraction surveys of ordered illite-smectites and illitic (or illite-like clay containing some expandable layers) materials from mostly diagenetic environments demonstrated that discrete illite is commonly intermixed with ordered illite-smectite in reference illites; e.g. Fithian illite, Beavers Bend illite, Marblehead illite, and Silver Hill illite have been shown to be I+ISII mixtures (Środoń Reference Środoh1984; Środoń & Eberl Reference Środoh and Eberl1984). In a long-term (up to 2.6 years) solubility experiment with Goose Lake, Beavers Bend, and Fithian illites at 25°C, Kittrick (Reference Kittrick1984) concluded that natural illites contain two or more clay phases or components in equilibrium with each other; this deduction, based on solubility measurements, is thus consistent with the prior determination by Środoń (Reference Środoh1984) that the reference illites are multiphase mixtures. The peculiar problem posed by these intermixtures derives from the impossibility of mechanical separation of these clay phases; incidentally, recent studies with natural reference illites (e.g. Nieto et al. Reference Nieto, Mellini and Abad2010; Gailhanou et al. Reference Gailhanou, Blanc, Rogez, Mikaelian, Kawaji, Olives, Amouric, Denoyel, Bourrelly, Montouillout, Viellard, Fialips, Michau and Gaucher2012; Smith et al. Reference Smith, Dai and Caroll2017) seem to have presumed that these reference or standard illites are single-phase, micaceous materials when in fact they are mixtures. In this context, treating these natural samples as single-phase, micaceous materials is likely to yield ambiguous results. Solution equilibration techniques provide an approach to resolving the solubility and thermodynamic stability of the component phases in such clay minerals. The equilibration of solid assemblages with aqueous compositions of variable initial compositions can bring some of the component phases to equilibrium and, as the experimental temperature is varied, the thermal evolution of the solubility-controlling mica-like phases becomes apparent. Thus, the basic experimental strategy in solution equilibration investigations is to bring the component phases of natural illite to equilibrium in a manner that facilitates demonstration of equilibrium by the analysis of the equilibrated solutions.
Solution equilibration studies of illites
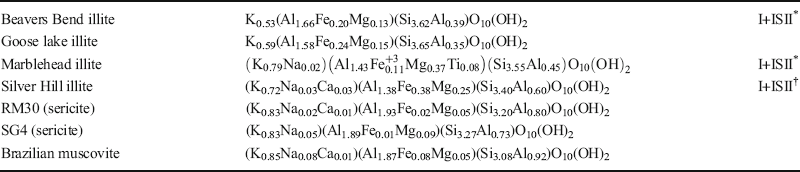
Several natural illites, including Goose lake illite (GL), Beavers Bend illite (BB), Silver Hill illite (SH), and Marblehead illite (MH) (Table 1), were utilized in a series of solution equilibration experiments (Rosenberg et al. Reference Rosenberg, Kittrick and Sass1985; Sass et al. Reference Sass, Rosenberg and Kittrick1987; Aja Reference Aja1991; Aja et al. Reference Aja, Rosenberg and Kittrick1991a, Reference Aja, Rosenberg and Kittrick1991b; Aja & Rosenberg Reference Aja and Rosenberg1996).
Bulk compositions of natural samples used in solution equilibration studies

The sericites (RM30 and SG4) formed from hydrothermal alteration of fault gouge in Tertiary volcanics in the Silverton caldera (Eberl et al. Reference Eberl, Środoń, Lee, Nadeau and Northrop1987). Sources of phase components of natural illites: * Środoń (1984); † Środoń & Eberl (Reference Środoh and Eberl1984).
The Goose Lake illite (Goose Lake, Illinois) is a Pennsylvanian underclay and was originally characterized by Grim & Bradley (Reference Grim and Bradley1939) as a non-bentonitic illite containing small amounts of quartz, kaolinite, and organic matter; it (GL) is a mixed-layered illite with expandability between 25 and 30% (Gaudette et al. Reference Gaudette, Eades and Grim1966a, Reference Gaudette, Grim and Metzger1966b). Fithian illite is a Pennsylvanian underclay from Vermillion County, Illinois (Grim et al. Reference Grim, Bray and Bradley1937; Gaudette et al. Reference Gaudette, Eades and Grim1966a, Reference Gaudette, Grim and Metzger1966b). The Beavers Bend illite is a well crystallized illite from an unweathered claystone from the Silurian Blaylock Formation in the Ouachita Mountains (Beavers Bend State Park of southeastern Oklahoma); some samples contain minor chlorite as a mechanical mixture (Mankin & Dodd Reference Mankin and Dodd1963; Gaudette et al. Reference Gaudette, Eades and Grim1966a, Reference Gaudette, Grim and Metzger1966b). Silver Hill illite derives from a Cambrian shale in Montana (Hower & Mowatt Reference Hower and Mowatt1966), has a modal mineralogy of 89% illite-smectite content (Kuila & Prasad Reference Kuila and Prasad2013), and <10% expandable layers (Hower & Mowatt Reference Hower and Mowatt1966). The Marblehead illite is a pure, well crystallized 2M 1 illite, has <5% mixed-layering, and occurs as large pockets of gray laminated clay in Silurian dolomite (Burnt Bluff Group) near Marblehead, Wisconsin (Gaudette Reference Gaudette1965; Gaudette et al. Reference Gaudette, Eades and Grim1966a, Reference Gaudette, Grim and Metzger1966b). Güven (Reference Güven1972) also reported the presence of trigonally arranged twin aggregates in MH and suggested its derivation from a phengitic mica. The presence of varying amounts of expandable layers in BB, SH, MH, and GL is indicated by the CEC (meq/100 g) of 18.48, 15, 21.18, and 24.20, respectively (Gaudette et al. Reference Gaudette, Grim and Metzger1966b; Hower & Mowatt Reference Hower and Mowatt1966); furthermore, BB, SH, and MH have been shown to be mixtures of discrete illite and ISII (see Table 1). Clearly, these natural samples are of divergent geological pedigrees and have varying amount of expandable components and quite different bulk chemistries.
In the experiments with these natural illites, illite chemical compositions were, in the first instance, projected onto the quaternary system, K2O-Al2O3-SiO2-H2O; in this system, three solid phases can be in equilibrium with solution at a given temperature and pressure. Hence, KCl solutions were reacted with mixtures of illite and two other solids (kaolinite-gibbsite, kaolinite or microcline plus quartz or Cab-O-Sil) from 25 to 250°C. In order to bring solutions to equilibrium rapidly, starting solutions (0.2 M and 2.0 M KCl/HCl or KCl/KOH) were equilibrated with approximately equal weights of the mineral mixtures. The experiments were conducted in pairs with identical solid mixtures and solutions having the same ionic strength but with high and low values of K+/H+. Under isothermal and isobaric conditions, the mineral mixtures will control pH, pK+, and pSiO2(aq) if Al is conserved. The attainment of equilibrium was generally based on the reversibility of
 ratios in solutions; equilibrium was approached from silica undersaturation in most of the experiments, but reversibility of
 was demonstrated by approaching equilibrium from silica supersaturation in some experiments. At the conclusion of each experiment, the solid products were separated from the equilibrated solutions by immiscible displacement techniques; the solid products were characterized by X-ray diffractometry while the solutions were analyzed using conventional wet chemical techniques (additional details of experimental and analytical procedures are available in Sass et al. Reference Sass, Rosenberg and Kittrick1987 and Aja et al. Reference Aja, Rosenberg and Kittrick1991a). The molalities of the quench solutions were corrected to activities at temperature using the Pitzer phenomenology (Aja Reference Aja1989 and references therein); the resulting ion activities were then plotted in ion activity diagrams (Fig. 1).
Solution equilibration data for Marblehead Illite (a, b) and Goose Lake illite (c) depicted on isothermal isobaric activity diagrams. In Figures 1a and 1b, open and partially open triangles indicate experiments in 2 M and 0.2 M KCl solutions, respectively (Aja et al. Reference Aja, Rosenberg and Kittrick1991a). In Fig. 1c, solid triangles and open triangles indicate experimental data for Goose Lake and Beavers Bend illites, respectively (Aja Reference Aja1991).

If the component phases in the illites behaved as a solid solution under isothermal and isobaric conditions, the solubility data should fit onto a single curvilinear pattern. This was not the case (Fig. 1 in Aja et al. Reference Aja, Rosenberg and Kittrick1991a); rather, the solubility data from the solution equilibration experiments have linear dispositions. At 25 and 60°C, for instance, data in experiments with MH (Fig. 1a, b) and GL (Fig. 1c) show negatively sloping lines as expected for kaolinite–illite phase boundaries for illites of fixed compositions. Under isothermal and isobaric conditions, the solubility data show multiphase solubility patterns which are consistent with these reference illites being multiphase mixtures. These solubility data also imply the existence of a large group of particles having a similar chemical composition and physical state. In order to determine the K-contents of the mica-like solubility-controlling phases from the univariant boundaries, the phases were presumed to have the general structural formula, K x (Al2)(Al x Si4 − x )O10(OH)2. The univariant kaolinite ⇌ illite reaction is,

Applying the law of mass action leads to

Equation 10 is the equation of a straight line the slope of which is a function of x or the K-content per half unit cell of the solubility-controlling phases. From the slopes of the plots of
 vs
 , values for K
x
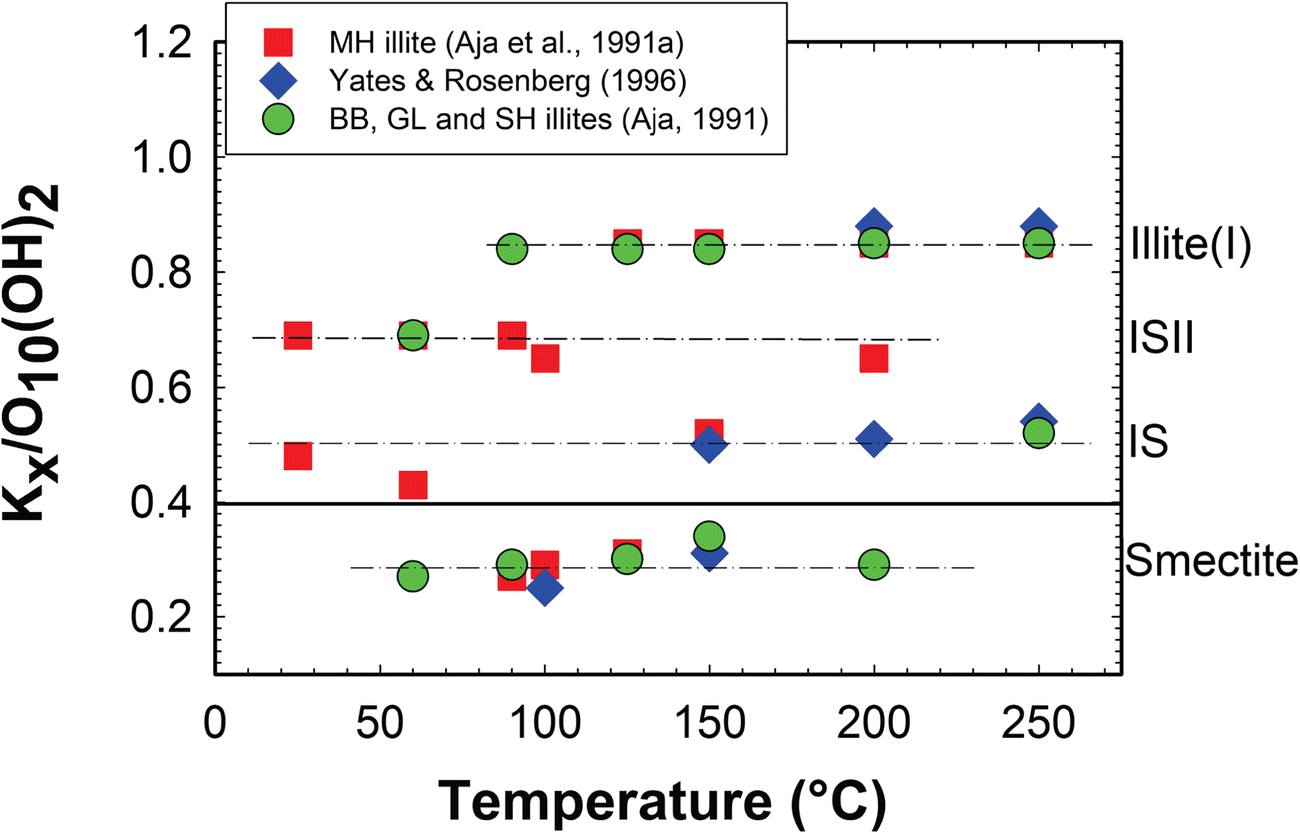
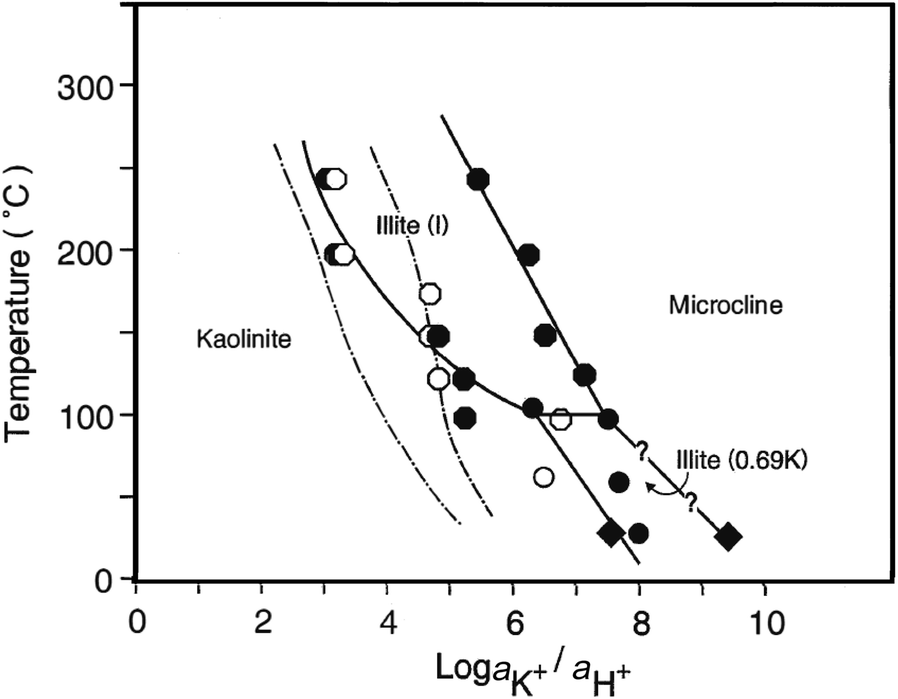
/O10(OH)2 were determined to be 0.29 ± 0.04, 0.50 ± 0.05, 0.69 ± 0.08, and 0.85 ± 0.05 (Fig. 2; also Table 1 in Aja et al. Reference Aja, Rosenberg and Kittrick1991a). The relative stabilities of these phases are determined by temperature and the chemistry of the coexisting aqueous solutions; for instance, only two of these four phases are stable in solutions at equilibrium with quartz (Fig. 3).
Variation of the interlayer K-content per half unit cell [K x /O10(OH)2] of the solubility-controlling phases in the presence of kaolinite between 25 and 250°C; values of the K-content (x) are based on the general structural formula K x (Al2)(Al x Si4 − x )O10(OH)2 used in the solubility model (Eq. 9). The solid red squares indicate data from experiments with Marblehead illite (Aja et al. Reference Aja, Rosenberg and Kittrick1991a); the solid green circles indicate data reported by Aja (Reference Aja1991) for Beavers Bend, Goose Lake (GL), and Silver Hill (SH) illites; the solid blue diamonds indicate results of solution equilibration experiments with San Juan sericites (RM30, SG4) and Brazilian muscovite (Yates & Rosenberg Reference Yates and Rosenberg1996). Smectite, IS, ISII, and Illite (I) represent the nomenclature of the four mica-like solubility-controlling phases by Rosenberg et al. (Reference Rosenberg, Kittrick and Aja1990).

A depiction of phase relationships in the system K2O-Al2O3-SiO2-H2O at quartz saturation using temperature vs
 coordinates (Aja & Rosenberg Reference Aja and Rosenberg1996). The hexagons and circles represent equilibrium ion activities of phase boundaries with endmember illite [i.e. Illite (I) or illite (0.85K)] and illite (0.69K) [or ISII], respectively. The solid symbols, open symbols and diamonds represent data points from experiments with MH illite, GL illite, and data points from Garrels and Howard (Reference Garrels and Howard1957), respectively. The dot-dashed boundaries outline the predicted field (Montoya &Hemley Reference Montoya and Hemley1975) of muscovite stability.

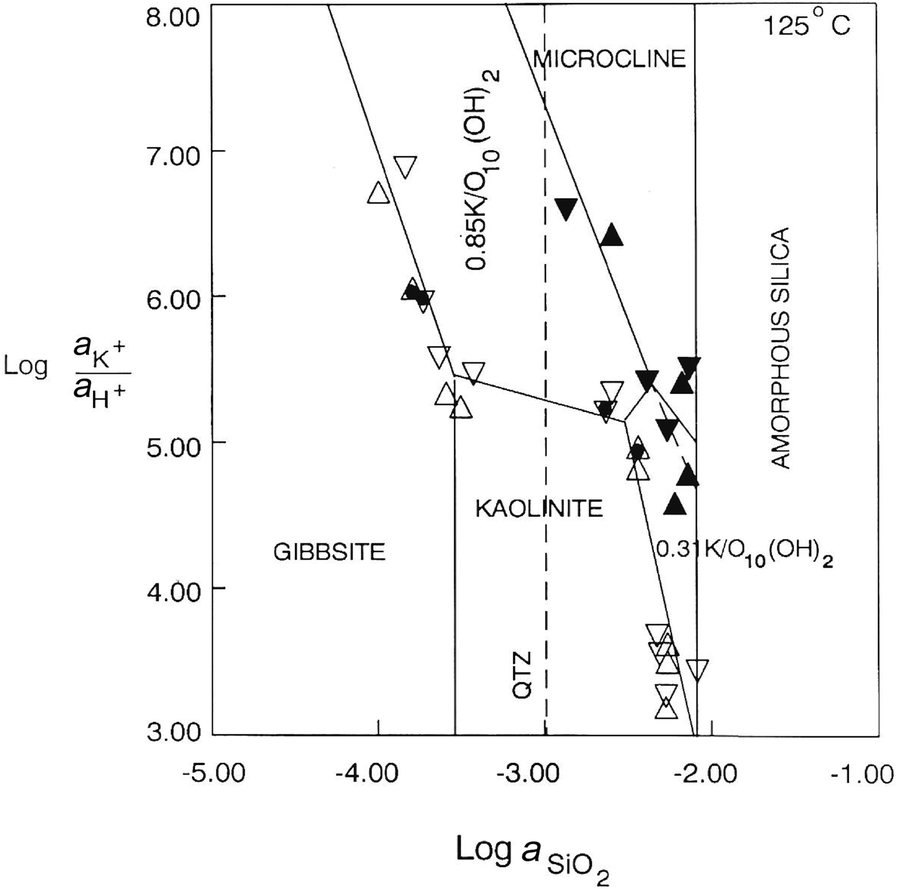
The internal consistency of the experimental solubility data, in the studies discussed above, was tested using the compositions of the solubility-controlling phases calculated independently from the slopes of different univariant boundaries constraining the stability field of a given illite at a given temperature. For example, Fig. 4 shows the experimental results from the equilibration of illite with either kaolinite or microcline; in the former, additional solid phases included gibbsite or quartz whereas in the latter, the additional phases were quartz or Cab-O-Sil. If the results of the experiments are internally consistent, values of K x /O10(OH)2 determined independently from the three univariant boundaries containing illite must be in agreement; i.e. values of x calculated from the univariant kaolinite ⇌ illite (x), illite(x) ⇌ gibbsite, and illite(x) ⇌ microcline boundaries must be in agreement if and only if the data are internally consistent. This was demonstrated to be the case for the data plotted in Fig. 4; similar conclusions were reached for experiments conducted at other temperatures. Not only does this conclusion imply that the chemical potential diagrams were topologically consistent, it also strongly implies that equilibrium was attained between illite(x) and the equilibrating solutions. Furthermore, it negates the notion that these experimental observations may derive from adsorption–desorption reactions on surfaces of the illite, especially considering that these experiments were conducted in decade KCl solutions and shows no ionic strength dependence. The adsorption of alkali and alkaline earth cations on mineral surfaces are dominated by outer-sphere mechanisms and are, therefore, strongly dependent on ionic strength.
Isothermal, isobaric activity diagram depicting results of solution equilibration investigations at 125°C. Open (2.0 M KC1 solutions) and partially open (0.2 M solutions) triangles show excess kaolinite; solid triangles, excess microcline (Aja et al. Reference Aja, Rosenberg and Kittrick1991a).

The dominant divalent octahedral cation in MH is Mg2+ (see Table 1); hence, illite equilibrium relationships were evaluated within the K2O-MgO-SiO2-Al2O3-H2O system. In this quinary system, the composition of the solubility-controlling phases may be referred to the muscovite–MgAl celadonite [K(Al, Mg)Si4O10(OH)2]–pyrophyllite compositional space and, hence, the general formula K x (Al2 − y Mg y )(Al x − y Si4 − x + y )O10(OH)2 (Aja et al. Reference Aja, Rosenberg and Kittrick1991b). Consequently, the illite ⇌ kaolinite equilibrium reaction becomes:

for which the corresponding equilibrium constant expression is

The strong collinearity of the solubility data precluded solution of Eq. 12 directly by muliple regression analyses and, thus, a semi-empirical approach was adopted (Aja et al. Reference Aja, Rosenberg and Kittrick1991b). Based on the two models (Eqs 9 and 11), the compositions of the solubility-controlling phases were subsequently determined to be K0.29(Mg0.26Al1.74)(Al0.03S3.97)O10(OH)2, K0.50(Mg0.22Al1.78)(Al0.28Si3.72)O10(OH)2, K0.69(Mg0.16Al1.84)(Al0.53Si3.47)O10(OH)2, and K0.85(Mg0.12Al1.88)(Al0.73Si3.27)O10(OH)2. Standard state thermodynamic properties for these phases have also been retrieved from the solubility data (Aja Reference Aja1995).
The resolution of the solubility data into linear univariant boundaries (Figs 1 and 4) implies that each solubility-limiting phase behaved as discrete phases of fixed compositions in the experimental systems. But in natural environments, the compositions of analogous phases may exhibit temporal and spatial variations. Therefore, using Gibbs energy-minimization techniques, Kulik & Aja (Reference Kulik, Aja, Palmer and Wesolowski1997) modeled the compositional and thermodynamic data from the solution equilibration experiments (Aja Reference Aja1995; Yates Reference Yates1993) presuming the ternary muscovite–celadonite–pyrophyllite solid solution. Hence, the formalism:

In Eq. 13,
 ,
 ,
 ,
 , X
i
, and W
i
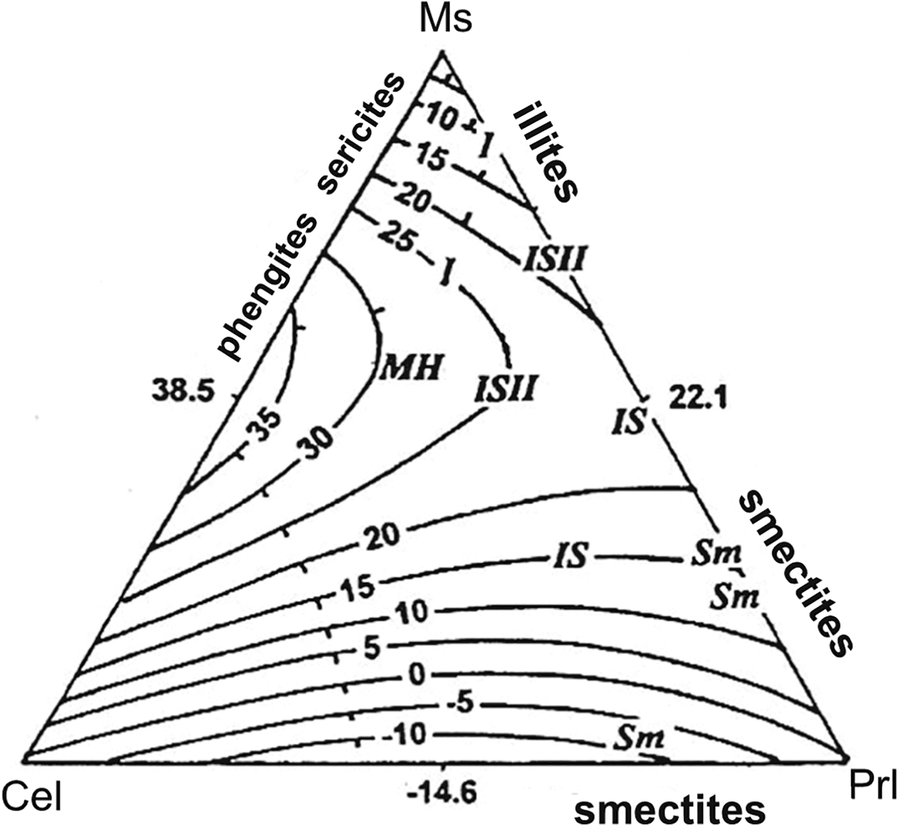
represent the Gibbs free energy of formation of the solubility controlling phases, Gibbs free energy of formation of pyrophyllite, Gibbs free energy of formation of celadonite, Gibbs free energy of formation of muscovite, mole fraction of the various endmember components, and the various Margules interaction parameters. The use of macroscopic micas in Eq. 13 reflects the non-existence of thermochemical properties of endmember clay minerals suitable for modeling the properties of illite and illitic phases. Certainly, this will affect the magnitudes of the Margules interaction parameters which exhibited no particular dependence on temperature (Table 2 in Kulik & Aja Reference Kulik, Aja, Palmer and Wesolowski1997); Fig. 5 depicts the variation of the calculated excess Gibbs energy at 25°C.
Excess Gibbs energy of mixing (
 , kJ/mol) for pyrophyllite (Prl)–celadonite (Cel)–muscovite (Ms) ternary solid solution model of solubility-controlling phases; MH, bulk composition of Marblehead illite (Kulik & Aja Reference Kulik, Aja, Palmer and Wesolowski1997).

In the studies with natural illites summarized above, the compositions of the solubility-controlling phases were not presumed to be the same as the composition of the starting illite based on bulk chemical analyses. Thus, errors inherent in earlier solubility studies resulting from the presence of multiple phases in these natural samples were circumvented. However, a possible criticism of these studies is that the concentrations of Al in the equilibrated solutions were not determined but were presumed to have been conserved in the solid phases; this practice reflected the widely held view of the geochemical immobility of aluminum and was adopted in other studies (e.g. Hemley Reference Hemley1959). Perhaps, the most severe limitation of this group of solution equilibration studies was the lack of simultaneous verification, by analytical transmission electron microscopy (ATEM), of the structure and chemical compositions of the solubility-controlling phases.
Solution equilibration studies of sericite and muscovite
In further investigations of illite equilibria in the system K2O-Al2O3-SiO2-H2O, Yates & Rosenberg (Reference Yates and Rosenberg1996, Reference Yates and Rosenberg1997, Reference Yates and Rosenberg1998) applied the same solution equilibration techniques as were used by Sass et al. (Reference Sass, Rosenberg and Kittrick1987) and Aja et al. (Reference Aja, Rosenberg and Kittrick1991a); but, in lieu of natural illites, the starting materials used by them were San Juan sericites (RM30, SG4; Eberl et al. Reference Eberl, Środoń, Lee, Nadeau and Northrop1987) and some natural muscovites, and their investigations were conducted between 100 and 250°C. These latter studies yielded solubility-controlling phases having the approximate compositions [K x /O10(OH)2] of 0.28±0.04, 0.51±0.04, and 0.88±0.04; in other words, the solubility-controlling phases in these latter studies were identical to those inferred from the prior studies with natural illites (Fig. 2). However, in these studies with sericites and muscovites, a phase having the approximate composition K0.69/O10(OH)2 was not observed, probably because the experiments were conducted outside its stability field (Fig. 3).
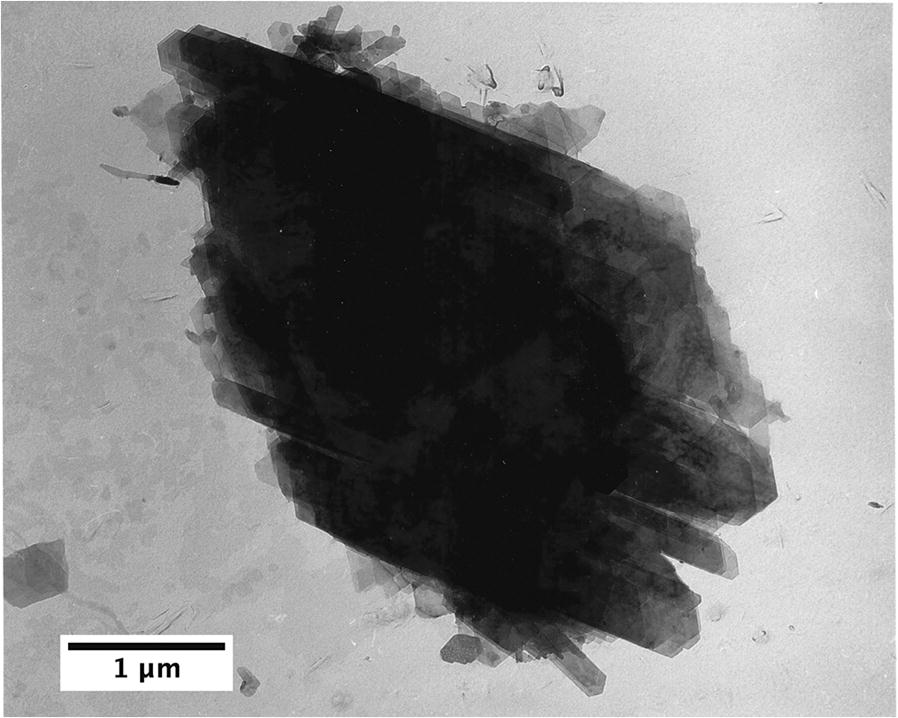
In order to characterize better the identity of the inferred solubility-controlling phases, Yates & Rosenberg (Reference Yates and Rosenberg1997) conducted solid-equilibration experiments. In solid-equilibration experiments, identical solid materials (to those used in prior solution-equilibration experiments) were reacted with aqueous solutions the compositions of which were the same as the final composition of the prior solution-equilibration experiments; however, a high solution-to-solid ratio (~120:1) was used which ensured that the solution composition did not change while the solids were brought to equilibrium with the solution. The solid products from these solid-equilibration experiments with sericites and muscovites were characterized by ATEM (Yates & Rosenberg Reference Yates and Rosenberg1997, Reference Yates and Rosenberg1998). At 250°C, neoformed illite laths grew on muscovite edges and may have resulted from dissolution of both kaolinite and muscovite edges (Figs 2 and 3 in Yates & Rosenberg Reference Yates and Rosenberg1997; Figs 3 and 4 in Yates & Rosenberg Reference Yates and Rosenberg1998). The neoformed illite crystals had a compositional range varying from 0.31 to 0.89 K/O10(OH)2; with increased duration of the experiments, the K content converged towards 0.88 K/O10(OH)2 which was the K content calculated from slopes of univariant boundaries in solution-equilibration experiments. The range and convergence of the illite compositions documented under isothermal conditions (Yates & Rosenberg 1988) may be indicative of crystal growth following nucleation. Nonetheless, the ATEM data appear to validate the congruence between the composition of the solubility-controlling phases inferred from slopes of univariant boundaries in ion activity diagrams and the composition of the neoformed illites. Of particular relevance to this review is the observation (Yates & Rosenberg Reference Yates and Rosenberg1996, Reference Yates and Rosenberg1997) that muscovite did not come to equilibrium in muscovite + kaolinite or muscovite + microcline solution-equilibration experiments; rather, neoformed illitic phases identical to phases observed in experiments with natural illites + kaolinite or sericites + kaolinite were the stable phases (see Fig. 6).
TEM image of of muscovite grains with neoformed illite laths on muscovite edges. The illite grew in muscovite-kaolinite solid equilibration experiments conducted at 250°C and at saturation vapor pressure by Yates (Reference Yates1993).

The attainment of equilibrium in solubility experiments such as discussed above may, therefore, be presumed if: (1) the same steady-state conditions defined in terms of the equilibrating aqueous solution compositions can be approached from both under- and over-saturation as was the case in the studies discussed above; (2) the slopes of univariant lines representing mineral-solution equilibria are rational over a wide range of solution compositions at a given temperature; and (3) results are reproducible in experiments of long duration and with a variety of analogous but different starting materials. These conditions were apparently met in the solubility studies discussed above and, thus, strongly suggest that illites and sericites may dissolve to points of thermodynamic equilibrium in solution equilibration experiments.
Solution equilibration studies of chlorites
Similar solution-equilibration techniques to those employed in studies with illites, sericites, and muscovites have also been applied to the investigation of the hydrothermal stability of several chlorites (Aja & Small Reference Aja and Small1999; Aja Reference Aja2002; Aja & Dyar Reference Aja and Dyar2002); the chlorites included a low-Fe clinochlore (or ferroan clinochlore) and two magnesian chamosites. In the studies with natural chlorites as starting materials, the solid products were examined by both X-ray diffraction and ATEM and these did not document the formation of new chlorite phases in the run products; therefore, the solubility-controlling phases were the same as the starting chlorites. In addition, the equilibrated solutions were analyzed exhaustively including for Al and trace metals and, thus, the presumption of conservation of Al in the solid phases was not necessary; ion speciation modeling of the reacted aqueous solutions were executed using EQ3/6 (Wolery Reference Wolery1993).
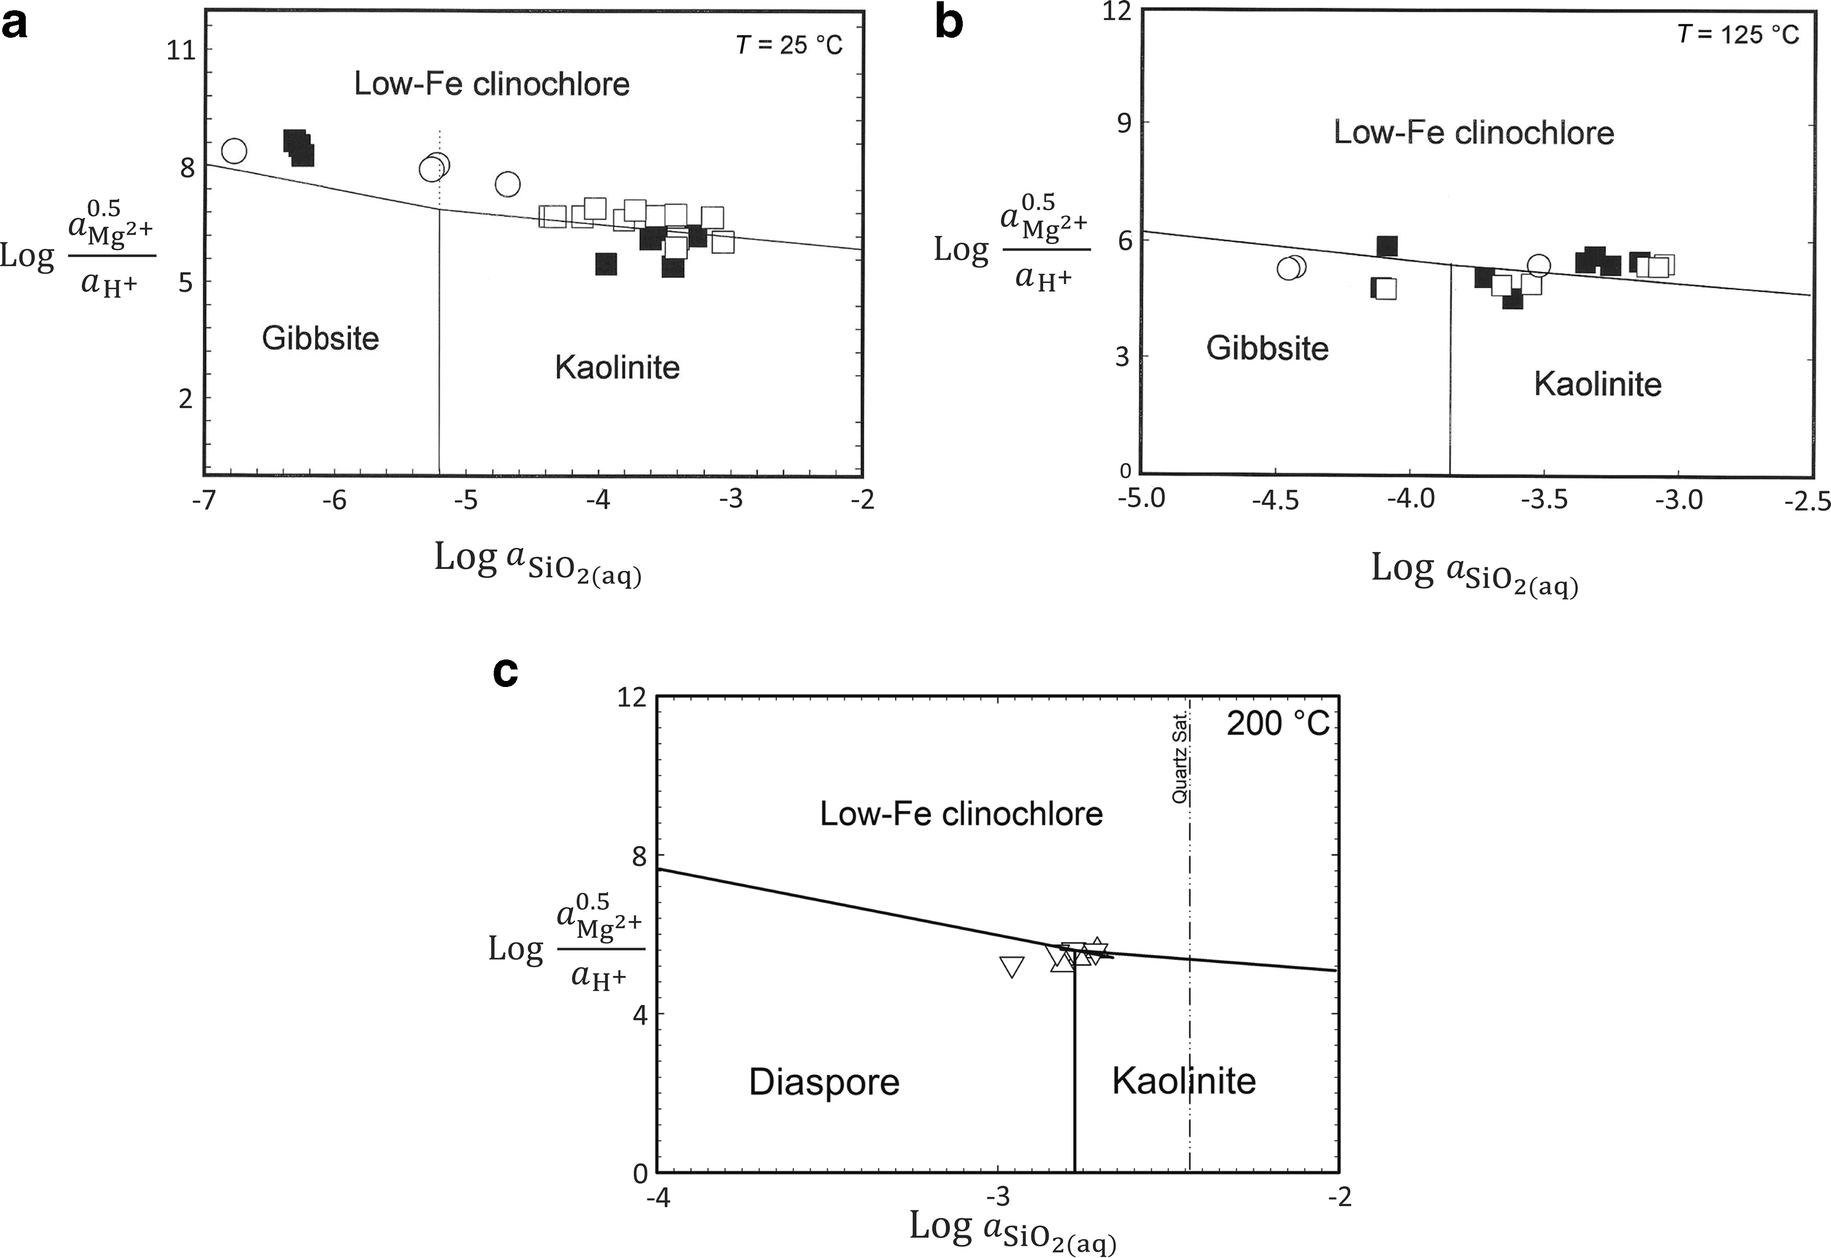
The solutions from the hydrothermal experiments with chlorites, when plotted on ion activity diagrams, resolved into univariant boundaries (Fig. 7a, b) for the experiments conducted at T ≤ 175°C. But at 200°C (Fig. 7c), the data converged to a common point defining the kaolinite-diaspore-chlorite invariant point. These experiments were multiple batch runs having identical starting charges; the primary variable in the data plotted on Fig. 7 was the equilibrating temperature. Hence, such a transition from a univariant equilibrium to an invariant one caused solely by increasing temperatures is clearly equilibrium driven, consistent with Duhem’s Law and strongly suggests the attainment of stable equilibrium in these low-temperature (T ≤ 250°C) hydrothermal experiments. Furthermore, the multi-phase solubility documented in studies with illite-bearing assemblages was not observed in these experiments with chlorites; perhaps, this intrinsic difference in the solubility behaviors of chlorite-bearing assemblages vis-à-vis illite/sericite-bearing assemblages is rooted in differences in the nature of the interlayer material between the 2:1 layers.
Isothermal, isobaric
 vs
 diagrams depicting experimental data obtained at 25°C (a), 125°C (b) and 200°C. The open circles represent experiments in which chlorite were reacted with gibbsite in aqueous NaCl solutions; open and solid squares represent experiments in which chlorite was reacted with kaolinite in the presence of aqueous MgCl2 and NaCl solutions, respectively (Aja & Small Reference Aja and Small1999). Triangles denote experiments conducted in aqueous MgCl2 solutions and the apices of triangles indicate direction of approach (Aja & Dyar Reference Aja and Dyar2002).

Discussion
In the literature, muscovite is still very commonly used as a proxy for illite in low-temperature chemical potential diagrams and this largely reflects persistent questions as to whether complex clay minerals (such as illite) are stable, metastable, or even unstable phases. Questions on the stability vs metastability of illite and related phases have revolved around three main issues: (1) are the solubility behaviors of these minerals in hydrothermal solutions amenable to treatment by the laws of equilibrium thermodynamics? (2) do illite and illite-smectite have defined stability fields relative to muscovite and pyrophyllite stability? and (3) are illites and smectites constrained to be thermodynamically metastable owing to physicochemical conditions of their environments of formation?
Models of Illite Metastability
A postulate of the metastable model of compositionally complex clay asserts that illite is metastable relative to muscovite + pyrophyllite inasmuch as a large solvus is required to explain the apparent coexistence of muscovite and pyrophyllite inferred in transmission electron microscopic investigations of metapelites from Witwatersrand and northeastern Pennsylvania (Jiang et al. Reference Jiang, Essene and Peacor1990); they inferred that the coexistence of the muscovite and pyrophyllite resulted from the prograde decomposition of illite that had formed metastably in the muscovite-pyrophyllite solvus. By contrast, Loucks (Reference Loucks1991) reasoned that the argument by Jiang et al. (Reference Jiang, Essene and Peacor1990) for illite metastability is false because the presumption that pyrophyllite lamella exsolved from illite is untenable considering that pyrophyllite is not a significant molecular component of illite crystalline solutions. Moreover, the compositional vector along the Al2Si4O10(OH)2 ⇌ KAl2AlSi3O10(OH)2 compositional trend is not a significant component of the substitutional variations of structurally bound H2O in potassic white micas when viewed as a function of the molar proportion of conventional interlayer cations; hence, the muscovite–pyrophyllite binary is not a simple binary solvus (akin to the paragonite–muscovite solvus) but rather contains the subsidiary muscovite-hydromica and muscovite-hydropyrophyllite solid solutions (Loucks Reference Loucks1991). Secondly, a T–X stability diagram calculated for the hydrous muscovite–pyrophyllite binary (fig. 10a in Vidal & Dubacq Reference Vidal and Dubacq2009) precludes the coexistence of muscovite and pyrophyllite; rather between 275–350°C, 200–275°C, and 100–200°C, the following assemblages illite + pyrophyllite, illite + kaolinite + quartz, and illite + beidellite become successively stable, respectively; muscovite + pyrophyllite was not a stable assemblage under these conditions. Furthermore, Dubacq et al. (Reference Dubacq, Vidal and Lewin2011) demonstrated through Monte Carlo simulations of energetics of muscovite-pyrophyllite solid solutions, that the conclusions of the solid-state study of Jiang et al. (Reference Jiang, Essene and Peacor1990) is probably erroneous inasmuch as the stabilizing influence of hydration on clay minerals was neglected; they concluded that it is impossible to use the muscovite–pyrophyllite solvus as proof of metastability of illite as the compositions of illitic materials cannot be modeled in this system without considering the effects of hydration.
Another postulate of the metastable model of illite is that clay minerals sequences encountered during illitization reactions reflect the operation of the Ostwald step rule in which kinetic factors rather than approach to equilibrium drives illitization reactions (Essene & Peacor Reference Essene and Peacor1995). At the time of this postulate by Essene & Peacor (Reference Essene and Peacor1995), the Ostwald step rule was still a theoretical conjecture; however, this is no longer the case. Using high-resolution electron microscopy, Chung et al. (Reference Chung, Kim, Kim and Kim2009) provided the first empirical confirmation of the Ostwald step rule more than a century after it was postulated by Ostwald (Reference Ostwald1897); they observed the ephemeral metastable crystal structures postulated by the Ostwald step rule in the formation of amorphous LiFePO4 and its recrystallization to the stable (olivine) phase via the formation of a number of different metastable nanocrystal forms at 450°C. In this validation of the Ostwald step rule (Chung et al. Reference Chung, Kim, Kim and Kim2009), the nucleation and crystallization occurred in a closed system under isochemical and isothermal conditions. These conditions are divergent from those under which illitization reactions occur and, hence, the notion of illite metastability predicated on the presumptive application of Ostwald’s step rule to illitization reactions is questionable. Furthermore, because the presumption of Ostwald ripening during illitization reactions has been based on indirect evidence anchored on the interpretation of particle-size distribution normalized to modes, it is fraught with difficulties. As was discussed previously, earlier presumptions of the applicability of an Ostwald-type process to the sequential appearance of various phases during smectite illitization reactions now appear questionable. Moreover, the correct interpretation of Ostwald processes emphasizes structural chemistry rather than entropy production (Morse & Casey Reference Morse and Casey1988) but, because the preponderance of evidence has now shown that crystal-size distributions of particles that have undergone illitization have log-normal distributions (e.g. Kim & Peacor Reference Kim and Peacor2002) which are rooted in maximum entropy effects, the metastability of illite cannot be presumed justifiable on the applicability of Ostwald ripening mechanisms.
The question as to whether clay minerals dissolve to points of thermodynamic equilibrium in solubility measurements dates back to Lippmann (Reference Lippmann1977, Reference Lippmann, Olphen and Veniale1982) who proposed that compositionally complex clay minerals are metastable and/or disequilibrium solids and, thus, their solubility behaviors are not amenable to the law of mass action. The issues raised by Lippmann (Reference Lippmann1977, Reference Lippmann, Olphen and Veniale1982) regarding the solubility characteristics of clay minerals have been treated extensively heretofore (Aja & Rosenberg Reference Aja and Rosenberg1992; Aja & Dyar Reference Aja and Dyar2002). Furthermore, in the series of investigations discussed in the previous section, only one smectite, one illite, and two I-S phases (Fig. 2) were found to control solubility in the presence of gibbsite/diaspore ± kaolinite or in the presence of microcline despite the differences in the chemical composition and structure of the various illites, sericites, and muscovites used as starting materials. Furthermore, the failure of muscovite to equilibrate in muscovite-bearing experiments and the neoformation of illitic phases in lieu of muscovite suggests equilibrium reversal of the stability of illite, especially considering that the compositions of the neoformed illites in experiments starting with muscovite were akin to those observed in experiments starting with natural illites of different compositions.
H 3 O + in Illite Interlayers
The question of the state and roles of structurally bound water in illitic clays recently has been of renewed interest. On the basis of a study of SH, Nieto et al. (Reference Nieto, Mellini and Abad2010) reasoned that illite is a dioctahedral mica characterized by the exchange vector, K−1H3O+, rather than by the substitution towards pyrophyllite (SiAl−1, K−1); in developing this model, they fixed the sum of tetrahedral and octahedral cations a priori to six during crystallochemical recalculation of chemical analyses. This echoes the earlier model of Brown & Norrish (Reference Brown and Norrish1952) in which the excess H2O found in illite is attributed to occupancy of the interlayer site by mostly K+ and hydronium (H3O+) ions. This model had been deemed unsatisfactory (Hower & Mowatt Reference Hower and Mowatt1966) inasmuch as two monomineralic illites having no expandable layers yielded chemical analyses amenable to structural recalculation of oxide composition without recourse to hydronium ions in the interlayer. The excess water in SH is more likely to occur as H2O rather than H3O+ inasmuch as reasonable estimates of equilibrium conditions and water content are obtained with thermobarometric models incorporating H2O in the interlayer position of illite (Vidal et al. Reference Vidal, Dubacq and Lanari2010), and unrealistically acidic conditions are required for significant incorporation of H3O+ into the interlayer of illite. Indeed, the solution equilibration data at 25°C (Fig. 1a) does not support illite formation in rather acidic conditions as would be expected if H3O+ is a significant interlayer component.
The substitutional model of Nieto et al. (Reference Nieto, Mellini and Abad2010) essentially defaults to the muscovite ⇌ hydromica substitution of Loucks (Reference Loucks1991) who modeled compositional variations in white micas and illites using muscovite ⇌ hydropyrophyllite [(H2O)Al2Si4O10(OH)2] and muscovite ⇌ hydromica (H3O+)Al2AlSi3O10(OH)2 substitutions. Hence, the binary solid solution, Al2Si4O10(OH)2 ⇌ KAl2AlSi3O10(OH)2, may not be used to model illite compositional variations; this contradicts the presumption that excess H2O in the interlayer of illite is H2O rather than hydronium ion (Hower & Mowatt Reference Hower and Mowatt1966). Because excess H2O (relative to micas) is characteristic of illites and mixed-layered I-S (Hower & Mowatt Reference Hower and Mowatt1966), the extent of the proposed hydropyrophyllite ⇌ muscovite and hydromica ⇌ muscovite substitutions in the compositional variations of illite and I-S clay minerals needs to be spectroscopically resolved, and given the multiphase nature of SH and other reference illites (Table 1), resolution of this question requires the use of clearly monomineralic samples the bulk chemical analyses of which can be recalculated satisfactorily into a single structural formula. Obviously, the states of structurally bound water have thermochemical ramifications. For instance, the inclusion of structurally bound water in the illite general formula (Eq. 9) is not likely to affect significantly the magnitude of the slopes of the univariant phase boundaries if hydronium ion is not a component in the interlayer site (as noted previously). However, structurally bound water, even in the absence of hydronium ions, will likely have pronounced entropic effects during crystallization especially for phases with lower interlayer K-contents (e.g. smectites and I-S).
Multiphase Solubility of Illite and I-S
In the solution equilibration studies discussed previously, only a limited number of solubility-limiting phases were observed despite the wide diversity in the chemistry and mineralogy of the starting materials (Table 1) used in these studies. In addition, in non-equilibrium experiments in which sodic feldspar was reacted with aqueous KCl solutions at 150–200°C, Primmer et al. (Reference Primmer, Warren, Sharma, Atkins, Manning, Hall and Hughes1993) documented the neoformation of illites. Although these experiments were not designed as equilibrium experiments, the resulting aqueous solutions resolved into univariant boundaries, in
 ion activity space, such that the composition of the neoformed illites [K
x
/O10(OH)2] inferred from the univariant boundaries (using Eqs 9, 10 above) were 0.29, 0.51, and 0.87. These are clearly identical to those inferred from experiments with illites and sericites. Furthermore, ATEM analyses of the neoformed illites by Primmer et al. (Reference Primmer, Warren, Sharma, Atkins, Manning, Hall and Hughes1993) yielded compositions 0.27, 0.55, and 0.87 which confirmed the values they inferred from slopes of the univariant boundaries. In other words, these authigenesis experiments in which neither illite nor muscovite was used as a starting material seem to validate the results of the prior solution-equilibration experiments conducted with natural illites, sericites, and muscovite.
A multiphase illite solubility model had been proposed by Rosenberg et al. (Reference Rosenberg, Kittrick and Aja1990) based on compositions inferred from the solution-equilibration investigations. In the multiphase model, the compositions of solubility-controlling phases observed in experiments with K-saturated Goose Lake illite, K0.25/O10(OH)2 (Rosenberg et al. Reference Rosenberg, Kittrick and Sass1985) was presumed to represent K-saturated smectite whereas the phase with composition K0.85/O10(OH)2 observed in experiments with Marblehead illite (Aja Reference Aja1989) was presumed to represent end-member illite [or Illite (I)]; then the intermediate compositions K0.50/O10(OH)2 and K0.69/O10(OH)2 correspond closely to those expected for phases with IS [K0.55/O10(OH)2] and ISII [K0.70/O10(OH)2] ordering, respectively. In this model, the four mica-like solubility-controlling phases having the following interlayer K-contents per half unit cell 0.29 ± 0.04, 0.50 ± 0.05, 0.69 ± 0.08, and 0.85 ± 0.05, correspond then to the four layer types S, IS, ISII, and I recognized in natural I-S samples by X-ray diffractometry (Fig. 2).
The repeated appearances of these discrete phases in these experimental systems suggest the existence of certain free energy minima within illite compositional space and seem consistent with the lack of continuously ordered I-S interstratifications going from smectite-rich clays to illite-rich clays. In an X-ray diffractometry (XRD) study of expandability of 41 clays from several diagenetic settings, Środoń (Reference Środoh1984) demonstrated a continuous variation of illite-smectite interstratifications from random, through incomplete IS to IS, incomplete ISII to ISII type of ordering; however, the existence of IIS-type of ordering was not detected in the diagenetic materials. That is, these XRD studies (Środoń Reference Środoh1984) documented only the existence of IS- and ISII-ordered interstratifications. The existence of only these two ordered I-S phases would seem to validate the solution equilibration data, but questions as to how many ordered I-S phases exist in different geological settings are unresolved. In a study of the smectite illitization sequence in the hydrothermally altered silicic volcanic glass in the Shinzan hydrothermal area, Inoue et al. (Reference Inoue, Kohyama, Kitagawa and Watanabe1987) reported the existence of R1, R2, and R ≥ 3 ordering interstratifications. On the other hand, Dong et al. (Reference Dong, Peacor and Freed1997), in a transmission electron microscope (TEM) investigation of five diagenetic samples, concluded that smectite, R1 IS (i.e. I-S with 50% I), and illite are the three dominant phases observed within a diagenetic sequence; according to Dong et al. (Reference Dong, Peacor and Freed1997), R1 IS is relatively abundant whereas other kinds of mixed-layer I-S phases are rare. Clearly, the existence of a limited number of ordered interstratifications would concur with the existence of certain free-energy minima between smectite and endmember illite implied by the multiphase solubility model. However, the number of ordered interstratifications existing in different geological systems and determined using different techniques (XRD vs TEM) is not conclusive.
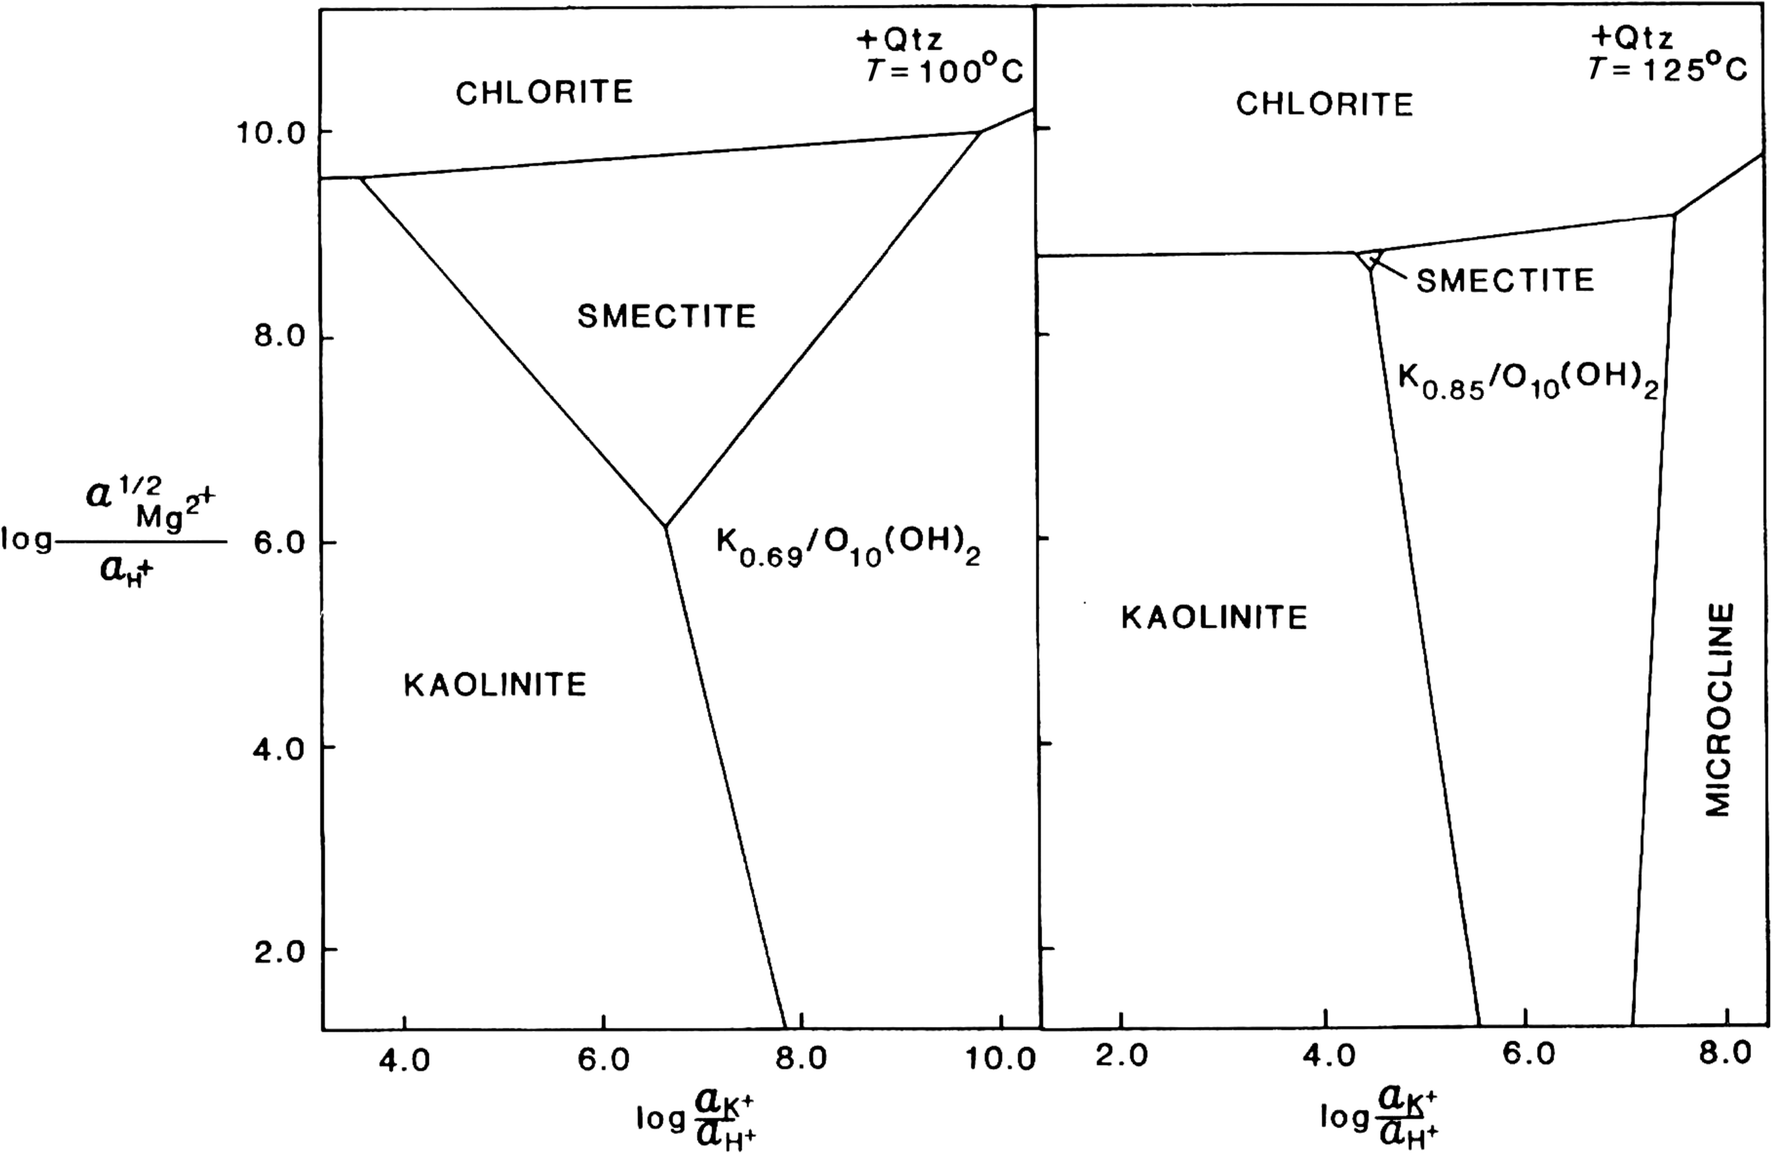
The relative stabilities of the solubility-controlling phases are influenced by the chemistry of coexisting pore water and temperature. In the quaternary system and at quartz saturation, stability fields are defined for only Illite (0.69K) at T ≤ 100°C and Illite (I) at 100°C < T < 250°C (Fig. 3). But in the quinary K2O-MgO-Al2O3-SiO2-H2O system, on the other hand, smectite (0.29K) stability fields persist at quartz saturation alongside Illite (0.69K) and Illite (I) (Fig. 8). This effect of temperature and porewater chemistry on the relative stability finds empirical validation in the direct crystallization of smectite, ordered I-S, and illite from hydrothermal solutions (Tillick et al. Reference Tillick, Peacor and Mauk2001). The path towards the crystallization of endmember illite is, therefore, not unique but will depend on both the lithogeochemistry and aqueous geochemistry of the hosting environment; smectite or IS will transform directly to endmember illite given the appropriate physicochemical conditions (fig. 2 in Aja et al. Reference Aja, Rosenberg and Kittrick1991a; Fig. 1 in Yates & Rosenberg Reference Yates and Rosenberg1996).
Stability diagrams showing phase relationships in the system K2O-MgO-Al2O3-SiO2-H2O in the presence of quartz at 100 and 125°C (Aja et al. Reference Aja, Rosenberg and Kittrick1991b).

The successive transformation of these solubility-controlling phases as would be expected during illitization is at odds with the presumption of Ostwald ripening as a driving force of illitization. The solubility-controlling phases are discrete thermodynamic phases having different chemistries and particle thicknesses and include smectite (S), endmember illite [Illite (I)], and the ordered interstratifications R1 (IS) and R3 (ISII). Thus, in going from smectite to Illite (I), these phases are characterized by progressively increasing interlayer K-contents and thicknesses. Being that Ostwald ripening is an isochemical process, the successive nucleation and growth of the different phases as would be expected during diagenesis and/or hydrothermal alteration would violate its basic tenets (cf. Primmer Reference Primmer1994). Nonetheless, Ostwald ripening may occur within the stability field of an illite phase. For instance, a phase such as endmember illite or Illite (I) may crystallize and undergo Ostwald ripening given its wide stability field (Fig. 3); in the Paris basin (Lanson & Champion Reference Lanson and Champion1991), illites having hexagonal morphology and interlayer charge of ~ –0.9 [that is, Illite (I)] appeared to have undergone some coarsening but during this coarsening it did not undergo compositional changes as is expected during Ostwald ripening.
Illite Stability during Diagenesis/Hydrothermal Alteration
The solution-equilibration studies summarized above have important implications for the stability of illite, especially when viewed in terms of relevant mineral paragenetic sequences. Consider, for instance, the behavior of clay minerals documented (McDowell & Elders Reference McDowell and Elders1980) in the Salton Sea Geothermal Field (SSGF). First, as noted by the authors, the phases described as authigenic sericite are analogous to sedimentary illite in arenaceous formations. In the SSGF, illite (sericite) and coarse-grained muscovite are not coeval in P-T-X stability range though some overlap occurs (fig. 2 in McDowell & Elders Reference McDowell and Elders1980); with increasing temperatures, illitization reactions proceeded toward ideal muscovite through phengitic substitutions. Macroscopic muscovite occurs at higher temperatures (T ≥ 275°C) compared to fine-grained sericite which occurs mostly as a lower-temperature phase. At the lower temperature regimes, extensive alterations of detrital muscovite to sericites occur and conversely with increasing temperatures these sericites recrystallize to coarse-grained euhedral phengites. In addition, very fine-grained authigenic illites-sericites recrystallize to coarse-grained euhedral grains. By contrast, both authigenic fine-grained chlorites and macroscopic chlorites coexist for most of the depth range in which chlorite is stable but at ~300°C the recrystallization of the authigenic chlorites to euhedral grains also occurs along with the recrystallization of other minerals such as quartz and feldspars.
This pattern is somewhat mirrored in the experimental observations. In experiments with illite, sericite, and muscovite conducted at 25 ≤ T ≤ 250°C, muscovite was not a solubility-controlling phase (Figs 2 and 3). By contrast, under comparable conditions (25 ≤ T ≤ 200°C) chlorite was shown to be stable across the low-temperature regions in which the experiments were conducted (Fig. 7). Chlorite is a structurally far more complex aluminosilicate than muscovite and would have been expected not to equilibrate with kaolinite under these conditions, but it did; whereas muscovite failed to come to equilibrium. Not only did muscovite fail to equilibrate, illite grew from the muscovite-kaolinite mixtures and came to equilibrium with kaolinite. Thus, muscovite appears to be unstable at T ≤ 250°C and at these lower temperatures a variety of illitic phases exist and their fields of stabilities are determined by temperature and composition of coexisting aqueous solutions (Figs 3, 8). Clearly, the behaviors of illite, chlorite, and muscovite in the hydrothermal experiments seem to be borne out by the SSGF paragenesis and this buttresses the notion that clay minerals can and do dissolve to the point of thermodynamic equilibrium. Of course, the experimental stability studies were all conducted in well defined, closed experimental systems whereas clay minerals equilibria in natural systems occur under open systems subject to variable physicochemical and hydrothermal fluxes.
The SSGF paragenesis is remarkable for another reason. At temperatures near 300°C, significant recrystallization of layer silicates occurred; unaltered detrital muscovites completely recrystallized to idioblastic phengite grains and, simultaneously, aggregates of authigenic illite recrystallize to phengite mica through the process of gradual alignment and coalescence of grains. In other words, at and above this temperature, several crystallization pathways come into play for the crystallization of coarse mica; the driving force for the crystallization of macroscopic mica is sufficiently strong that alignment and coalescence of grains becomes a crystallization mechanism for authigenic illites that had persisted to this depth. Similarly, Kuwahara & Uehara (Reference Kuwahara and Uehara2008) in a study of the growth of hydrothermal illites reported that coalescence of particles occurred in late-stage growth and at higher temperatures compared to growth by spiral-type mechanisms. In general, crystal growth by coalescence of particles proceeds by oriented attachment of the particles during which the interface is eliminated (Li et al. Reference Li, Nielsen, Lee, Frandsen, Banfield and De Yoreo2012). In other words, structural factors that may induce strain, and possibly disorder, at the coalescing grain boundary did not preclude success of such crystal growth mechanisms and in fact are eliminated at the appropriate crystallization temperatures which reflects the magnitude of the driving force for crystallization.
The structural characteristics of illite may be thought of as the small particle-size effect of ordinary dioctahedral mica (White & Zelazny Reference White and Zelazny1988). Despite this structural similarity, evidence is currently lacking for the thermodynamic stability of muscovite in the P-T-X regime in which illite (sericite) appears to be the stable phase. In other words, muscovite persists metastably at low temperatures (T ≤ 275°C) but begins to crystallize at slightly higher temperature (300°C). Hence, the small size of clay minerals may have more to do with environmental factors inasmuch as at high enough temperatures (T ≈ 300°C), idioblastic mica does form from authigenic illite by coalescence of crystallites.
A Framework for Modeling Illite and I-S Minerals
Given that muscovite is not stable in the low-temperature environment in which illites and I-S form, the wide-spread presumption that these fine-grained phases are metastable precursors of coarse-grained micas is vitiated. That is, if muscovite is not a stable phase under the conditions in which illite forms, then illite cannot be its metastable precursor. For the Ostwald step rule to apply, a macroscopic equivalent of illite must exist that would form under the same physicochemical conditions but is hindered by kinetic restrictions. Otherwise, the application of the Ostwald step rule to the stepwise smectite illitization sequence is merely presumptive. In geothermal and/or hydrothermally altered assemblages, smectite, ordered I-S, and illite crystallized directly from hydrothermal solutions without undergoing the stepwise transformation typical of illitization reactions (Tillick et al. Reference Tillick, Peacor and Mauk2001 and references therein); that is, at the appropriate temperatures and pore water chemistries, these minerals could crystallize directly without going through stepwise transformation. This is consistent with these phases having their own stability fields and agrees with the conclusions of the solution equilibration experiments (Figs 3 and 8). Hence, the stepwise transformation characteristic of the smectite illitization sequence may be documenting the transitions between phases having different stability fields rather than being a manifestation of the Ostwald step rule. Certainly, petrographic observations of illitization may be complicated by factors such as the effect of fluid/rock ratios and the role of biotic vs abiotic factors. In fact, the simultaneous operation of both abiotic and biotic controls on illitization reactions in a given geologic setting (as evident in the Nankai Trough, offshore Japan) may lead to a geologic record divergent from that resulting solely from abiotic illitization. Thus, the lack of universality in the types of ordered I-S phases encountered during illitization, as discussed previously, may be a reflection of local physicochemical conditions rather than an intrinsic metastability. In that case, geological occurrences of illite and I-S that defy current understanding must find alternate explanations other than presumptive metastability. The foregoing does not preclude these phases from being metastable. Owing to their small crystal sizes, illite and I-S phases may be treated as metastable phases inasmuch as the total Gibbs free energy of systems containing these clay minerals may not be at a minimum. Metastability derived from these considerations implies that constraints (cf. Anderson Reference Anderson, Hellman and Wood2002) such as temperature, variable states of structural water, and the rate of entropy production may be the controlling factors. In other words, illite and related minerals are constrained to be metastable by the conditions of their formation. Nonetheless, they are thermodynamic phases the relative stability fields of which are resolvable by application of equilibrium thermodynamics.
In general, equilibrium thermodynamics has provided the framework for thinking about mineral assemblages and paragenesis, but an inherent limitation of equilibrium thermodynamics is that it deals primarily with initial and final states. Nonetheless, the starting consideration in placing the results of the hydrothermal experiments within the context of the illitization phenomenon in various geological settings should be that equilibrium thermodynamics governed the formation and stability of the different phases (i.e. smectite, IS, ISII, Illite(I)); these experiments were conducted in closed systems under isothermal conditions at the corresponding saturation vapor pressures. Furthermore, the multiphase solubility characteristic of illite-bearing systems was observed in both equilibrium (Aja et al. Reference Aja, Rosenberg and Kittrick1991a, Reference Aja, Rosenberg and Kittrick1991b; Yates & Rosenberg Reference Yates and Rosenberg1996) and non-equilibrium (Primmer et al. Reference Primmer, Warren, Sharma, Atkins, Manning, Hall and Hughes1993) hydrothermal experimental systems. During prograde illitization and sedimentary basin evolution, the successive conversion of natural equivalents of these discrete phases from phases of lower to phases of increased layer charges and particle thicknesses consists of stepwise irreversible reactions. These mineralogical changes during illitization are usually accompanied by temperature and pressure changes, fluid flow, and mass transfer in the evolving sedimentary basin or hydrothermal system. Therefore, the framework of irreversible thermodynamics may provide the ideal framework to model illitization phenomena. Conceivably, in natural systems undergoing diagenesis and/or hydrothermal alteration, the discrete solubility-controlling phases (observed in solution-equilibration experiments) may be held to define boundary conditions of local equilibrium, and as the sedimentary basin/hydrothermal system evolves, the intensive variables defining equilibrium become functions of both time (t) and position (x). Because the intensive variables are continuous functions of space coordinates, the total rate of entropy production in such natural systems will be expected to conform to the model,

where σ is the rate of entropy production per unit volume (V) and is given by,

where F i is thermodynamic force driving the associated fluxes, J i , and the inequality is an expression of the Second Law. The thermodynamic forces and fluxes in Eq. 15 will suffice to describe the system thermodynamically. In the absence of mechanical disequilibrium in the system, the forces and fluxes devolve to chemical affinities and reaction rates, and for a system with a heterogeneous distribution of temperature and chemical affinity, heat and mass transfer must be factored in with the chemical reactions (Morse & Casey Reference Morse and Casey1988; Kondepudi & Prigogine Reference Kondepudi and Prigogine1998).
Conclusions
The basic premises of the metastability of illite have not been borne out by available data: (1) presumptions of illite metastability by projecting illite crystalline solutions onto the muscovite-pyrophyllite solvus is flawed because the stabilizing effect of hydration on illite has been omitted; (2) the extent of applicability of Ostwald processes to illitization reactions is unresolved and, therefore, cannot provide prima facie evidence for illite metastability; and (3) solution equilibration studies with illite, sericites, and chlorites confirm that clay minerals do dissolve to points of thermodynamic equilibrium in low-temperature hydrothermal solutions.
In comparative, low-temperature hydrothermal experiments with muscovite-kaolinite and chlorite-kaolinite assemblages, equilibrium was demonstrated in the latter but not in the former. In the former experiments, Illite (I) rather than muscovite equilibrated, suggesting that muscovite is not stable under these conditions. Furthermore, the combined results of hydrothermal studies conducted by several investigators with one natural muscovite and six different natural illites of contrasting lithogeochemistry (SH, GL, BB, MH, SG4, RM30) showed that only four mica-like solubility-controlling phases were observed repeatedly. These results in conjunction with mineral paragenesis from the SSGF suggest that muscovite persists metastably in P-T conditions in which illite/sericite forms. Thus, using muscovite as a thermodynamic proxy for illite precludes development of an accurate and rigorous model of illite stability in diagenetic and hydrothermal environments.
Morphometric studies of clays undergoing illitization have log-normal crystal-size distributions which ostensibly derive from maximum entropy effects during crystallization. Given that the correct interpretation of Ostwald processes emphasizes structural chemistry rather than entropy production and entropy production appears to be a significant factor in the formation and stability of illite, the use of Ostwald processes as an index of metastability to rationalize the sequence of clay mineralizations encountered during illitization reactions may be flawed.
Acknowledgments
This work was not directly funded by any external funding agencies. Constructive and thoughtful review comments provided by the Editor-in-chief, the Associate Editor, and two journal reviewers are gratefully acknowledged. Also, the author gratefully acknowledge Dr. D. M. Yates for providing the TEM micrograph.
Compliance with Ethical Standards
Conflict of Interest
The author declares that he has no conflict of interest.