

After several decades of democratic governments, countries in Latin America remain among the world’s most unequal, and high poverty rates persist. In 2017, just over 30 percent of the population in the region (184 million) lived in poverty (CEPAL 2019). Yet despite high levels of poverty and inequality, people in Latin America are visibly engaged in politics: they protest, vote, and frequently pressure officials for better government services. What explains this high level of political activism? We argue that high levels of membership in civil society organizations help explain why poor people are so active in politics in Latin America.
Poor people are exceptionally well organized in most Latin American countries. Despite the decline of labor unions and other corporatist organizations that had been repressed under authoritarian governments or that had lost mobilizational capacity during the 1980s and 1990s (Collier and Handlin Reference Collier and Samuel2009; Silva and Rossi Reference Silva and Rossi2018), scholars concur that civil society in the region has strengthened in recent decades (Avritzer Reference Avritzer2002; Silva and Rossi Reference Silva and Rossi2018; Álvarez et. al. Reference Rossi2017; Álvarez et al. Reference Álvarez, Evelina and Arturo1998; Collier and Handlin 2009). Today, Latin America boasts an autonomous civil society that is a heterogenous mix of many kinds of organizations, including soup kitchens, neighborhood associations, Catholic organizations and myriad other religious groups, professional groups, groups focused on election monitoring, women’s groups, environmental organizations, human rights groups, domestic and international NGOs, and cooperatives. Many of these new organizations work to organize Latin America’s poorest and politically most marginalized citizens.
What role do these organizations play in mobilizing poor people into politics? The current literature on civil society’s influence on political participation holds many contradictions. Much research is unambiguously optimistic about the role community organizations play in mobilizing participation. North American scholarship, heavily influenced by insights from Toqueville and modernization theory, emphasizes how civil society organizations create spaces for ordinary citizens to develop democratic practices, habits, and attitudes. Organizations—even nonpolitical ones—play critical roles in mobilizing citizens, cultivating politically relevant skills, and boosting political participation in ways that can lead to more political equality (Rosenstone and Hansen Reference Rosenstone and John1993; Verba et al. Reference Verba, Schlozman and Brady1995; Schussman and Soule Reference Schussman and Soule2005).
In Latin America, autonomous civil society organizations are important actors that have challenged authoritarian regimes, enabled grassroots activism, cultivated new forms of citizenship that emphasized political equality and inclusion, and could challenge existing power structures and open up new spaces for marginal groups to gain in power and representation (Álvarez et al. Reference Álvarez, Evelina and Arturo1998; Álvarez et. al. Reference Álvarez, Rubin, Millie, Baiocchi and Agustín2017; Yashar Reference Yashar2005).
A more negative view emphasizes the limits of civil society’s potential for incorporating and representing lower-class citizens in Latin America. Civil society organizations remain small and resource-poor, and lack horizontal connections that would allow them to mobilize sustained collective challenges (Collier and Handlin 2009; Holzner Reference Holzner2010; Shefner Reference Shefner2008). Though the autonomy of community organizations is often cited as a strength, it also means that they lack linkages to political parties and larger organizations that are necessary to represent poor people’s interests beyond local politics (Avritzer Reference Avritzer2002; Collier and Handlin 2009; Silva and Rossi Reference Silva and Rossi2018). A number of scholars have also warned that poor people’s organizations are vulnerable to cooptation and clientelistic subordination (Avritzer Reference Avritzer2002; Taylor-Robinson Reference Taylor-Robinson2010; Handlin Reference Handlin2016; Sacouman Reference Sacouman2012), or that they participate out of material necessity (Baiocchi Reference Baiocchi2001). Instead of creating the conditions for more political equality, some empirical work has shown, neighborhood associations in Latin America reinforce class biases in political participation (Dunning Reference Dunning2009). In short, there is no consensus about the effect of civil society on the political participation and political inclusion of Latin America’s poorest citizens.
This study aims to understand the impact that community organizations have on the political activity of the poorest citizens in Latin America. Unlike most studies that focus on a single case, sometimes on a single city or neighborhood, this one utilizes LAPOP’s AmericasBarometer surveys of 18 Latin American countries to examine the effect of civil society on political participation across the region. The study shows that poor people in Latin America are incredibly well organized—on average, 77 percent of poor people participate in the activities of at least one community organization.
Unlike the United States, where organizational involvement is more common among wealthier individuals, in Latin America poor people are just as likely—and in some cases more likely—to be involved in community organizations. This widespread membership makes lower-class citizens “structurally available” for mobilization into politics, making it more likely that they will be asked to participate (Schussman and Soule Reference Schussman and Soule2005). Indeed, we find that membership in community organizations, even membership that does not involve frequent or deep involvement in organizational activities, has a powerful positive effect on poor people’s participation.
This article also analyzes the impact of community organizations on different modes of political activity, including voting, protesting, and directly contacting government officials. Studies of political participation often focus narrowly on voting behavior, but both direct contacting and protesting are important mechanisms for democratic accountability and critical ways that citizens express their political voice (Boulding Reference Boulding2014; Holzner Reference Holzner2007b). An understanding of whether civil society enables full-throated participation by Latin America’s poor therefore requires examining whether organizations can stimulate heterogeneous kinds of political activism. We argue that community organizations will have a stronger positive effect for activities that require more individual and collective resources, like protesting and government contact. Though positive, the impact on turnout will not be as strong.
Another important goal is to assess whether community organizations help erase class-based inequalities in participation that have plagued democracies in the region for decades. Given Latin America’s high levels of poverty and inequality, the potential for socioeconomic inequalities to translate into political inequality is always there. Indeed, during the 1980s and 1990s, a number of studies argued that instead of opening spaces for popular participation, democracies in the region created barriers to participation that affected poor people the most (Holzner Reference Holzner2007a; Kurtz Reference Kurtz2004a).
Our examination of how community organizations affect political participation also helps unravel the complex ways that civil society might contribute to greater levels of political equality in the region’s democracies. Ambiguity in the literature about the capacity of grassroots organizations to promote political equality may exist because organizations do not have the same effect on all modes of participation. It is possible, for example, that community organizations are more effective at mobilizing poor people to protest and demonstrate than to go to the polls. If that is the case, then research that focuses narrowly on voting behavior would come away with a pessimistic assessment of civil society’s role in incorporating Latin America’s poorest citizens, whereas research focusing on protest would be more optimistic.
We argue that political participation is driven both by factors at the elite level (decisions made by political parties to target certain communities or groups with their campaign and mobilization efforts) and by the mobilizational resources available in local communities (including networks of organizations that reduce barriers to collective action). Community organizations are important for both these mechanisms of mobilization. On the one hand, they make it more likely that people in local communities have the resources to mobilize and engage their neighbors on political issues. On the other, they give elites a point of access into communities to pursue their own strategies for political mobilization. However, political elites do not use organizational networks to recruit and mobilize everyone equally, or for all forms of political activism. Parties and candidates have obvious interests in promoting electoral modes of participation, but elites are less interested in encouraging activities like government contacting, which put direct demands on them that they may not be able to fulfill. So we also argue that the strategic ways political elites use organizations to mobilize people will impact class-based patterns of participation. Specifically, we think that strategic mobilization should produce more political equality for acts like voting and protesting and relatively less for direct government contacting.
We build this argument in several steps. First, the article provides new empirical evidence showing that poor people are highly politically active across the region. In several countries, they participate at higher levels than more affluent individuals do. The study also provides comparative evidence about individual involvement in community organizations across 18 Latin American countries and shows that on the whole, poor people are just as organized and involved as more affluent citizens are. Several hypotheses are tested about how political participation is influenced by involvement in community organizations.
Political Participation and Poverty in Latin America
Citizen political participation—whether voting in elections, reaching out to contact government officials, or protesting unpopular government decisions—is an important mechanism for democratic accountability. Given Latin America’s high levels of poverty and inequality, the question of how poverty affects political participation is particularly important. Political regimes in most Latin American countries have a long history of excluding poor people from politics. Sometimes they did so through laws that allowed only a small percentage of male landowning elites to vote, and often through violent repression by military regimes. The spread of democracy across Latin America that began in the 1980s raised hopes that more inclusionary political systems would emerge, and that poor people—who made up 50 percent or more of the population in many countries at the time—would finally achieve participatory equality.
Initially, this optimism was misplaced. Though protests remained common (Bellinger and Arce Reference Bellinger and Moisés2011), numerous case studies showed that market-based reforms, along with the steep decline in the mobilizing capacity of labor unions and peasant organizations, generally closed opportunities for political participation across Latin America (Dietz Reference Dietz1998; Holzner Reference Holzner2007a, Reference Holzner2010; Huber and Solt Reference Huber and Solt2004; Kurtz Reference Kurtz2004b; Oxhorn Reference Oxhorn1995; Silva and Rossi Reference Silva and Rossi2018). This period also saw a narrowing of political choice at the ballot box, since parties on the left were severely weakened or nonexistent in most Latin American countries. As a result, poorer citizens were less likely to be mobilized by partisan organizations and had fewer incentives to become involved in politics. The overall effect was the consolidation of “thin democracies,” where people from higher social classes participated more often, and in more ways, than people from lower social classes (Holzner Reference Holzner2007a, Reference Holzner2010; Kurtz Reference Kurtz2004b; Levine and Molina Reference Levine and José2011).
Recent evidence suggests that these stratified patterns of political participation have changed in Latin America. During the late 1990s and early 2000s, massive protests against neoliberal policies took place in many countries, many of them supported by a dense associational life (Álvarez et al. Reference Álvarez, Evelina and Arturo1998; Silva Reference Silva2009; Rossi Reference Rossi2017). These movements ushered in a wave of more “pro-poor” politics in the region, as leftist parties and candidates campaigned and won elections on platforms that included attention to social programs, indigenous issues, poverty alleviation, and greater opportunities for citizen participation. Many scholars wondered whether the left turn and the political reactivation of grassroots organizations in Latin America created opportunities for poor people to participate more actively in politics than before, but systematic cross-national evidence was lacking.
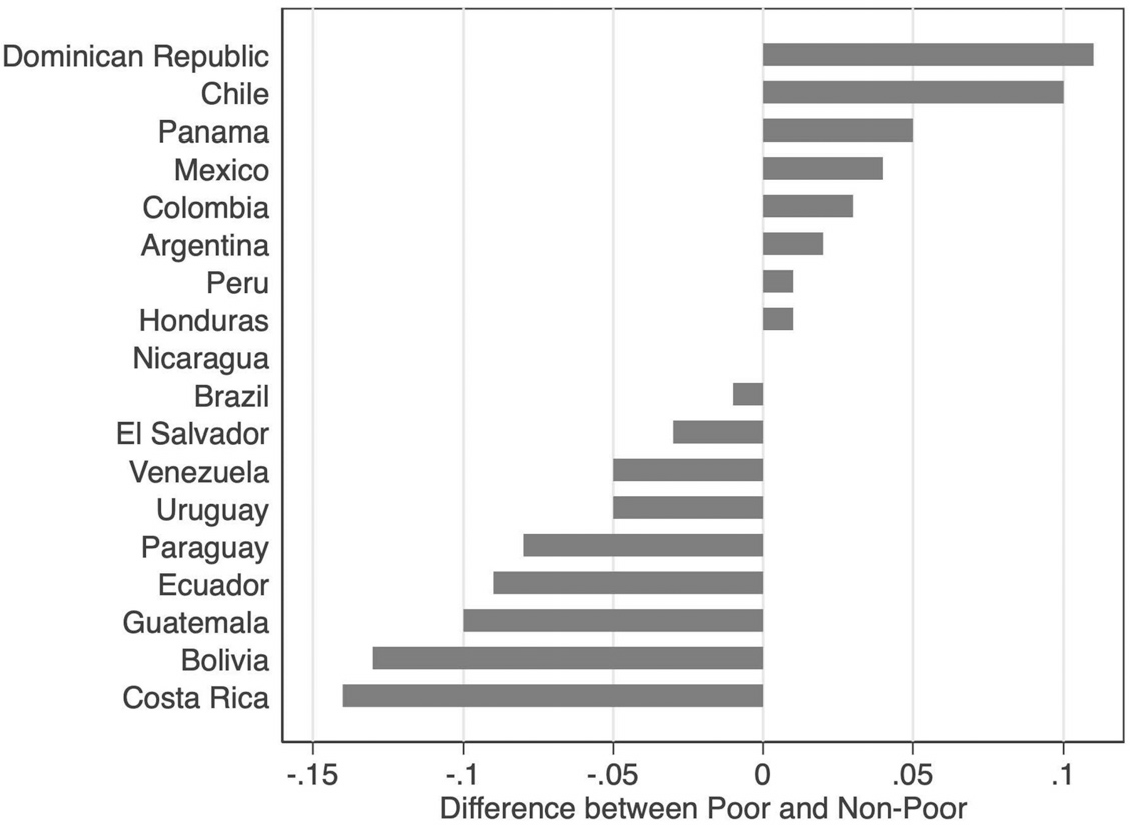
Our analysis of LAPOP survey data shows that these patterns of exclusion and inequality in levels of political participation ended sometime after the turn of the millennium. To get an overall sense of who participates and how much, we created an additive scale of political participation using four different modes of participation asked in LAPOP surveys from 2006 to 2014: voting, protesting, contacting municipal government officials, and making a request of local or state government officials. Each political activity is counted as one act, so the scale runs from 0 to 4.Footnote 1 The analysis shows that overall political participation is no longer stratified by income and wealth in Latin America: both the poorest 20 percent of respondents and the wealthiest 80 percent reported participating, on average, in 1.1 political acts during the previous 12 months. In several countries, the poor are, on the whole, more active in politics than people with more resources (figure 1).
Differences in Overall Political Activity Between Poor and Nonpoor in Latin America
Note: Positive numbers indicate that poor people participate more. Negative numbers indicate that wealthier people participate more.
Source: Authors’ dataset based on LAPOP 2006–14.

Comparison of patterns of political participation across countries reveals substantial political equality in 11 of the 18 Latin American countries. Importantly, poor individuals are more politically active than more advantaged individuals in the Dominican Republic, Chile, Panama, Mexico, Colombia, and Argentina. Comparison of means reveals that there is no statistically significant difference in overall levels of political participation between poor and nonpoor individuals in Colombia, Argentina, Peru, Honduras, Nicaragua, Brazil, or El Salvador. Interestingly, political participation continues to be stratified by wealth in countries where more radical and populist leftist presidents held power for many years: Bolivia, Ecuador, and Venezuela.
Analyzing participation in different kinds of political activities reveals a more mixed picture. Across Latin America, the most affluent turn out to vote significantly more frequently than the poorest: 77 percent versus 73 percent. Despite mandatory voting rules in most countries, this stratification of voting behavior was present in every country except Mexico and the Dominican Republic. Similarly, the affluent protest more than the poor in every country except Guatemala, Panama, and Peru, challenging the conventional wisdom that protests and marches are strategies employed primarily by low-income citizens. On the other hand, the poor are much more likely to contact and petition government officials than the affluent, confirming that direct government contacting is a core political repertoire of the poor. In some countries, like Argentina, the Dominican Republic, and Chile, the participatory advantage of the poorest 20 percent of individuals is particularly large. In short, though overall political participation rates have equalized across wealth groups in virtually every country, voting and protest activity remain stratified, while the primary source of political equality is poor people’s ability to contact government officials at significantly higher rates than the most affluent.
From a theoretical perspective, the findings challenge basic expectations of mainstream theories of political participation, which predict that poor people will be less politically active than individuals with more resources (Lijphart Reference Lijphart1997; Rosenstone and Hansen Reference Rosenstone and John1993; Verba et al. Reference Verba, Nie and Kim1978; Verba et al. Reference Verba, Schlozman and Brady1995). Clearly, individual income and wealth cannot explain these patterns, since poverty and inequality remain endemic to the region. Survey evidence also shows that low-income individuals do not have many other participatory advantages: they are, on average, less educated than more affluent individuals; they are less psychologically engaged in politics; and they do not hold stronger ideological positions.
Civil Society, Political Participation, and Political Equality
What is driving this high level of political activity by the poorest citizens? There are good reasons to think that community organizations are part of the answer. Civil society and community organizations of all kinds have played critical roles in Latin American politics under both authoritarian and democratic regimes. Some scholars point to civil society as a key factor in undermining dictatorships and sparking democratization (Garretón Reference Garretón and Eckstein2001; Mainwaring and Viola Reference Mainwaring and Viola1984; Oxhorn Reference Oxhorn1995; Schneider Reference Schneider1995). In Latin America’s young democracies, soup kitchens, women’s groups, indigenous organizations, neighborhood associations, Catholic base communities, and many other kinds of community organizations also played important roles in organizing and mobilizing Latin America’s poorest citizens (Álvarez et al. Reference Álvarez, Evelina and Arturo1998; Holzner Reference Holzner2004; Levine Reference Levine1992; Van Cott Reference Van Cott2005; Yashar Reference Yashar2005).
Others are more skeptical. As market reforms progressed, it became clear that older patterns of connection between political parties and the traditional corporatist organizations, such as labor unions, were eroding, sometimes with drastic consequences for political mobilization and representation (Collier and Handlin 2009; Morgan Reference Morgan2011; Roberts Reference Roberts2002, Reference Roberts2006). Union membership dropped across the region, and worries emerged that civil society—and the collective organizing power that comes with it—had been undercut and damaged (Kurtz Reference Kurtz2004a; Holzner Reference Holzner2010). Although grassroots organizations proliferated, many observers worried that they were too small, fragmented, and autonomous to effectively mobilize popular groups. Scholars argued that unlike labor unions and other corporatist groups, new organizations lacked linkages to parties or privileged access to policymakers, limiting their capacity to represent popular interests (Collier and Handlin 2009; Silva and Rossi Reference Silva and Rossi2018). As the state retreated from core functions, many of these new organizations filled the vacuum by providing critical services (often with support from international funding agencies), raising fears that they were depoliticizing core issues and demobilizing popular groups (Dietz Reference Dietz1998; Holzner Reference Holzner2007a).
Today, community organizations are important agents that mobilize poor people into politics. In the work they do, in the networks they support, in the organizational infrastructure they provide, organizations lower the individual and collective barriers to political participation. Because membership in associations is so common in Latin America, we should expect that organizational membership will be a powerful predictor of political participation for all members, regardless of wealth.
However, boosting political activity is not enough to equalize rates of political participation between the poor and the affluent. To achieve this, the positive effect of membership must also be larger for the poor than for the nonpoor. It is not clear whether community organizations can have this equalizing effect in Latin America. Some research shows that urban associations have strong and consistent class-based effects on political participation, thus widening the participatory gap between low-and high-income individuals (Dunning Reference Dunning2009). On the other hand, there is significant evidence, in the North American context and in the cross-national literature, that organizational involvement can help to equalize levels of political participation across classes (Boulding Reference Boulding2014; Holzner Reference Holzner2010; Rosenstone and Hansen Reference Rosenstone and John1993; Verba et al. Reference Verba, Schlozman and Brady1995; Verba et al. Reference Verba, Nie and Kim1978).
We argue that because organizations subsidize some of the costs of participation, membership in groups can be an especially important mobilizational resource for low-income individuals. Whereas the affluent are able to participate whether or not they are members of an organization (Schussman and Soule Reference Schussman and Soule2005), organizational involvement may be a necessary condition for political activism for low-income individuals. This is not to say that other factors are not important for shaping who participates, but we do argue that membership should have a stronger positive effect for lower-class individuals compared to the nonpoor.
We are also interested in analyzing the effect of community organizations on different modes of activism. Whether organizations are most effective at mobilizing turnout, protests, or direct government contacting matters because each activity has different implications for citizen voice and representation (Holzner Reference Holzner2007b; Verba et al. Reference Verba, Schlozman and Brady1995). A lot of work, in both the United States and Latin America, has focused on the potential of organizations to mobilize turnout. Carreras and Castañeda (Reference Carreras and Castañeda-Angarita2013), for example, show that involvement with civic organizations and work-related networks is one of the best individual-level predictors of voting in the region. Boulding also documents a strong connection between the activities of nongovernmental organizations and the frequency of voting activity—even when the NGO’s activities are explicitly nonpolitical and focused on service provision.
Political parties in Latin America increasingly rely on mass-media appeals to encourage turnout during elections (Levitsky et al. Reference Levitsky, James, Brandon and Jorge2017; Roberts Reference Roberts2002), so organizations may be less important than before in mobilizing individuals to vote. In addition, research carried out in other regions suggests that the mobilizational effects of community organizations should be strongest for political activities that require more resources, more skills, and more coordination, like protest activity and direct government contacting, rather than voting (Verba et al. Reference Verba, Nie and Kim1978; Verba et al. Reference Verba, Schlozman and Brady1995). Precisely because protests and contacting activity require more resources that poor people lack, organizations may play a bigger role in mobilizing the poor into these activities (Gans-Morse et al. Reference Gans-Morse, Mazzuca and Nichter2014; Schaffer and Baker Reference Schaffer and Baker2015; Stokes et al. Reference Stokes, Thad, Marcelo and Brusco2013; Nichter Reference Nichter2008). This discussion suggests three initial hypotheses.
H1. People who attend meetings of community organizations are more likely to be politically active than individuals who are not involved with any organization.
H2. The positive effect of organizational membership will be strongest for those political activities that require more individual and collective resources, like protesting and contacting. While positive, the impact of organizations on voting will not be as strong.
H3. The positive effect of membership on participation will be stronger for poor people compared with nonpoor people.
In addition to these direct effects of organizations on individuals’ ability to participate, our argument emphasizes how political elites use organizations strategically to mobilize people into politics. Political parties, candidates, and campaigns rely heavily on organizations to mobilize people into politics because it is very cost-effective to do so. Instead of contacting dozens or hundreds of people individually, which would require significant time and resources, elites achieve economies of scale in mobilization by relying on organizations to do the hard work of mobilizing members (Rosenstone and Hansen Reference Rosenstone and John1993). From an individual’s perspective, recruitment through organizations is also important: people are more likely to participate if someone asks them to, and they are more likely to be asked if they are members of an organization (Verba et al. Reference Verba, Schlozman and Brady1995).
Thus, political parties and candidates engage in strategic mobilization that primarily targets individuals who are members of organizations. However, political elites use organizations selectively and do not try to mobilize everybody all the time (Piven and Cloward Reference Piven and Cloward2000). Indeed, politicians and political parties have little interest in citizen activism per se. They promote public involvement only when it helps achieve other ends, like winning elections, passing bills, influencing policies, and receiving campaign donations. They may actually discourage citizen involvement in some activities or even seek to demobilize entire groups of citizens if public participation does not fit with their self-interested objectives (Holzner Reference Holzner2010; Lapegna Reference Lapegna2013; Wong Reference Wong2006). In other words, we need to consider not only the people whom organizations mobilize into politics but also the incentives that elites have for getting supporters out to the voting booth, out to the streets, or out to contact government representatives (Piñero et al. Reference Piñero, Matthew and Fernando2016).
Under this logic, inequalities in participation are partly the result of inequalities in social organization and the lack of community networks in poor people’s lives. In the United States, for example, poor people are much less likely to be involved in voluntary associations of any type, and therefore are much less likely to be contacted by political parties or asked to participate in political activities. Consequently, in the United States, the poor participate in politics at lower rates than wealthier people not simply because they are poor, but also because they are poorly networked (Schlozman et al. Reference Schlozman, Verba and Brady2012). Conversely, if lower-class individuals are well organized, political parties will have both the capacity and the incentives to target them for mobilization. Because this kind of mobilization is more important for resource-poor individuals, strategic mobilization is potentially an important mechanism for eliminating class-based stratification in political participation.
If community organizations in Latin America are to serve this mobilizational role for the lower classes, they need to have established linkages to political parties (Collier and Handlin 2009; Garay Reference Garay2009; Silva and Rossi Reference Silva and Rossi2018). Historically in Latin America, labor unions, peasant organizations, and similar hierarchical corporatist organizations monopolized linkages to political parties and thus were the primary associations that mobilized low-income citizens into politics. These mass organizations elbowed out grassroots organizations, particularly among Latin America’s most marginal groups: squatters, informal workers, landless peasants, and indigenous groups.
Today there appears to be a “second incorporation” under way in Latin America, in which smaller, more fragmented territorial and issue-based organizations have joined unions as important vehicles for partisan mobilization (Silva and Rossi Reference Silva and Rossi2018). Ironically, economic crises, austerity policies, and neoliberal projects have reordered politics in ways that have eroded the organizational dominance of labor unions while opening up spaces for new popular sector actors to stake their claims (Collier and Handlin 2009; Roberts Reference Roberts2002; Silva and Rossi Reference Silva and Rossi2018). There is also evidence that political parties and candidates have recognized the importance of community organizations for political mobilization and have worked to establish stronger linkages to grassroots organizations (Levitsky et al. Reference Levitsky, James, Brandon and Jorge2017; Roberts Reference Roberts2006).Footnote 2 In some cases, like those of the PRI in Mexico and the PJ in Argentina, these linkages were made in addition to established relationships with labor unions; but in many cases, particularly where old party systems collapsed, new parties and independent candidates have focused more and more of their mobilizational efforts on community organizations.Footnote 3
Under the logic of strategic mobilization, political elites also have incentives to mobilize individuals into certain acts and not others. Clearly, some types of participation are more valuable to politicians than others. For example, political parties and candidates are almost always interested in mobilizing people for electoral activities, since winning elections is a clear prerequisite for political survival. Therefore, candidates and political parties rely heavily on organizations to help turn out voters to the polls. Numerous studies focusing on Latin America have shown how the strategic use of organizations is a common and effective strategy for stimulating turnout—and can be particularly effective when targeting the poor. Much of this work has focused on the clientelistic nature of the mobilization (Auyero Reference Auyero2000; Nichter Reference Nichter2008; Stokes et al. Reference Stokes, Thad, Marcelo and Brusco2013; Szwarcberg Reference Szwarcberg2012). Nevertheless, a great deal of participation does not have roots in clientelism, and organizations are also crucial in supporting autonomous, elite-challenging activism (Holzner Reference Holzner2004; Szwarcberg Reference Szwarcberg2013).
Political elites sometimes also encourage protests and marches. Though protests are sometimes characterized as spontaneous uprisings, they are often well-orchestrated and strategic events organized to benefit elites. Particularly if they are out of power, elites have incentives to organize mass rallies and marches, both as a show of political power and as a means of changing the dynamics of elite negotiations (Szwarcberg Reference Szwarcberg2012; Beaulieu Reference Beaulieu2014). Incumbents, on the other hand, have stronger incentives to demobilize contentious action by supporters in order to maintain policymaking autonomy. Similarly, elites may want to discourage direct government contacting and other forms of demandmaking, since this kind of bottom-up pressure places demands on them that they may not be able to meet (Handlin Reference Handlin2016; Lapegna Reference Lapegna2013).
Thus, while membership in organizations supports more political activity across the board and may make it more likely that the poor will engage in all kinds of political activities, we should see the biggest boost among the poor compared to the affluent for voting and protest behavior, the activities for which political recruitment by parties and candidates is more important and in which political elites have an incentive to mobilize individuals. Since elites do not generally encourage contacting behavior, organizational membership may not have a differential effect on direct government contacting across wealth groups. This discussion suggests an additional hypothesis:
H4: Involvement with community organizations will have a stronger positive effect on the voting and protesting behavior of the poor compared to the nonpoor. Though positive, the effect of involvement with community organizations will not have a stronger positive effect on direct government contacting by the poor.
Data, Results, and Analysis
What is civil society like in Latin America today? Despite some worries that it was in crisis during the neoliberal period (Holzner Reference Holzner2010; Shefner Reference Shefner2008; Kurtz Reference Kurtz2004a), by most accounts, community organizations of all kinds proliferated during the 1980s and 1990s (Álvarez et al. Reference Álvarez, Evelina and Arturo1998; Avritzer Reference Avritzer2002; Dietz Reference Dietz1998; Silva and Rossi Reference Silva and Rossi2018). As labor unions declined, new spaces opened up for a wide variety of new organizations in civil society (Collier and Handlin 2009). Democratization also opened up spaces for civil society groups to organize without fear of repression and to participate more freely in the public sphere. Simultaneously, several major reform efforts were at work in Latin America to decentralize political institutions and involve nongovernmental organizations in service provision and foreign aid projects. The World Bank and other international funding agencies were powerful advocates for these reforms, which supported the proliferation of NGOs in Latin America (Boulding Reference Boulding2014, Reference Boulding2010). In this context, civil society, including the proliferation of organizations around lower-class issues, emerged as a permanent institution (Avritzer Reference Avritzer2002; Collier and Handlin 2009).
Organizational Membership in Latin America
Yet despite the widespread consensus that civil society is thriving in most Latin American countries, few studies provide systematic, cross-national evidence of how common organizational membership is, and fewer still compare organizational membership between lower and higher classes. The LAPOP surveys have a rich battery of questions about organizational involvement that allows us to measure the frequency with which individuals across the region participate in community organizations. Our measure of organizational involvement is based on a series of questions that ask, “I am going to read you a list of groups and organizations. Please tell me if you attend meetings of these organizations once a week, once or twice a month, once or twice a year, or never.” Organizations listed are religious organizations, parents’ associations at school, community organizations, professional associations (e.g. of merchants or farmers), and women’s organizations.
Our main measure of organizational involvement is a simple dichotomous measure: whether or not a person reports attending a meeting of any organization at least once or twice a year.Footnote 4 Respondents who attended meetings of any organization once a week, once or twice a month, or once or twice a year were coded 1. Respondents who never attended meetings were coded 0. Occasionally we used a second measure, which is also dichotomous but captures more frequent attendance at meetings: whether or not someone attends a meeting at least once or twice a month. Furthermore, we sometimes use variables whose value ranges from 0 to 3, corresponding to the frequency of meeting attendance: 0 if the respondent never attends meetings of that kind of an organization, 1 if they attend only once or twice a year, 2 if they attend once or twice a month, and 3 if they attend at least once a week.Footnote 5
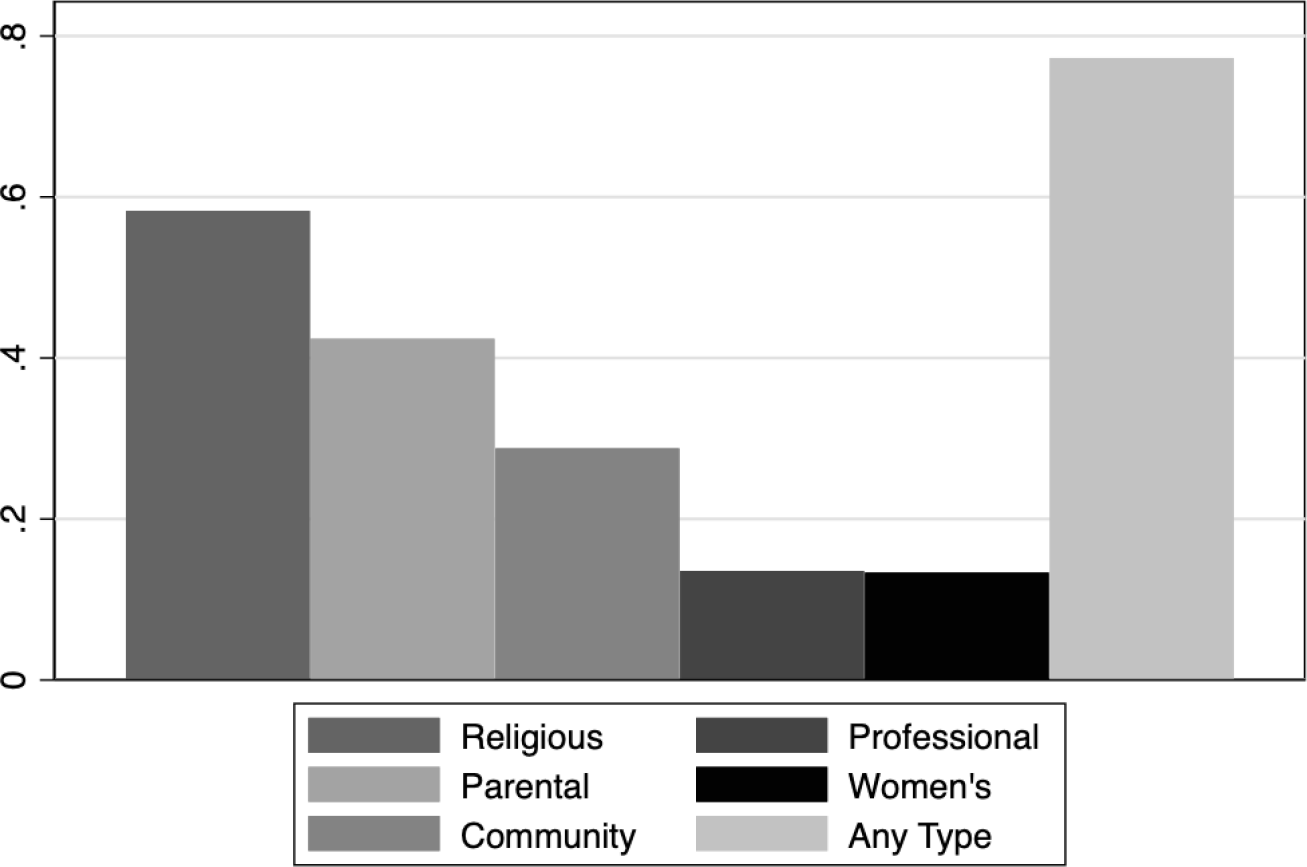
Our survey evidence shows that people across all social classes in Latin America are very involved in all kinds of community organizations. Figure 2 shows the percentage of respondents who attend meetings of these organizations at least once or twice a year. Not surprisingly, involvement in religious organizations is the most common form of organizational involvement: nearly 60 percent of Latin Americans report this level of involvement with a religious organization. More surprising is the high levels of involvement in parent and community groups: 42 percent of respondents are involved in parent groups, 29 percent in community groups, 14 percent in professional groups, and 13 percent in women’s groups. Overall, we can see from the bar on the far right that nearly 80 percent of respondents report some sort of involvement with a community organization.Footnote 6
Attendance of At Least One Meeting Last Year (mean)
Note: Women’s groups are included only after 2008 when the question was first asked.
Source: Authors’ dataset based on LAPOP 2006–14.

Figure 2 reports activity that reflects very infrequent involvement with community organizations. When we use our measure of more frequent involvement in community organizations—which includes only respondents who attend organizational meetings at least once or twice a month—the frequency of attendance falls, but only slightly. Close to 50 percent of respondents participate in religious organizations at least once a month; about one-third participate in parental organizations; and overall, well over 60 percent participate in some kind of organization at least once a month.
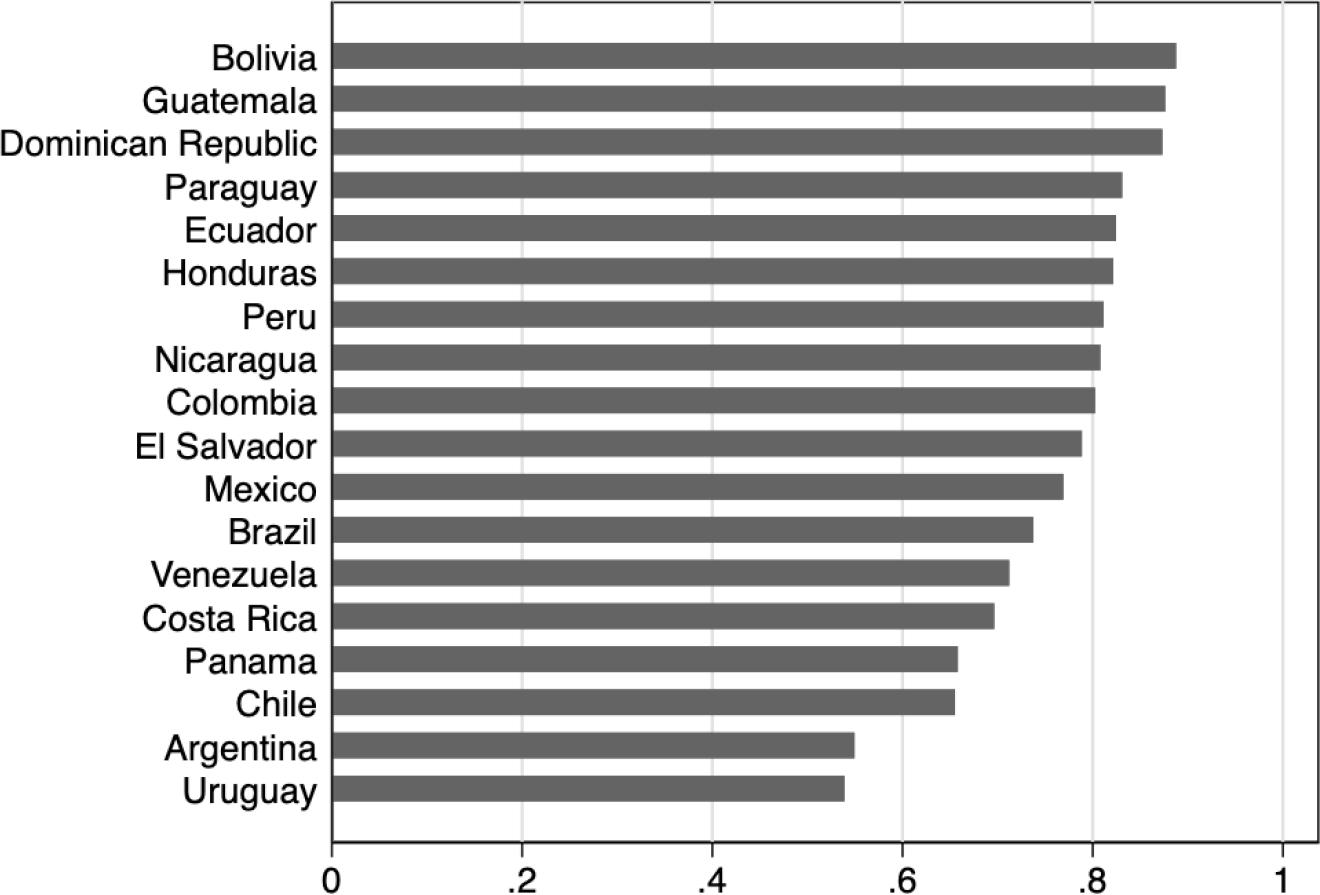
It is worth noting that high rates of organizational involvement are common across countries in the region. Figure 3 shows the overall number of respondents who participate in an organization at least once a year for each of the 18 countries in our sample. Bolivia takes the lead, with nearly 90 percent of people attending a meeting of an organization. Even Uruguay, the country with the lowest rate, has more than 50 percent of people attending meetings of some community organization at least once a year.
Attendance of at Least One Meeting Last Year, by Country (mean)
Source: Authors’ dataset based on LAPOP 2006–14.

Poor people in Latin America are just as likely—and in some cases more likely—to be involved in community organizations compared to wealthier individuals. Across more than 150,000 survey respondents between 2004 and 2014, 76 percent of people in the poorest asset quintile attended meetings of an organization at least once or twice a year, compared with an average of 77 percent for more affluent individuals. Rates of involvement across wealth groups are identical when we measure more frequent attendance: 64 percent of both poor and nonpoor individuals report attending meetings of an association in their community at least once or twice a month.
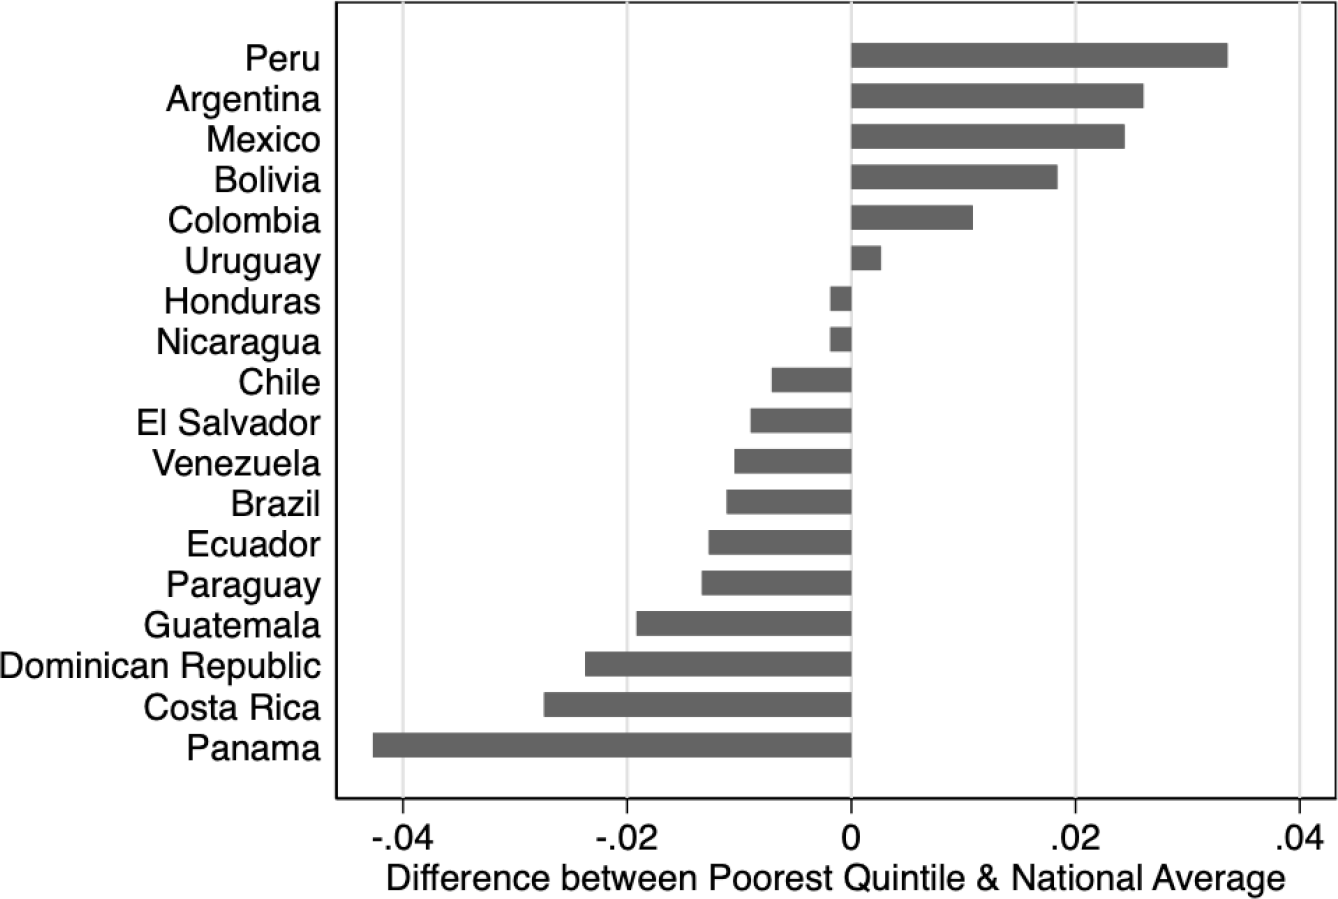
Figure 4 shows the difference in organizational involvement between the poor and nonpoor for each Latin American country. Positive bars indicate that the poor are, on average, more involved in community organizations than more affluent individuals, while negative bars indicate that poor people are less involved. The poorest individuals are, on the whole, more organizationally active than wealthier individuals in 7 of the 18 countries. The differences are largest in Peru, Argentina, and Mexico. In contrast, wealthier individuals are, on average, more active in organizations in Panama, Costa Rica, the Dominican Republic, Guatemala, and Ecuador.Footnote 7 A striking feature of these results is that the averages across wealth groups are so similar—there are no large gaps in organizational involvement between the poor and the wealthy in any country. Even in countries where membership rates among the affluent are higher, the difference is substantively small, less than 5 percentage points.
Attendance of At Least Once or Twice a Month (mean)
Source: Authors’ dataset based on LAPOP 2006–14.

Analysis
To test our hypotheses, we use a dataset that combines survey responses from LAPOP’S AmericasBarometer with country-level contextual variables from 18 Latin American countries between 2006 and 2014. We estimate multilevel mixed effects models to account for individual-level variation within different country-contexts.Footnote 8 We estimate separate models of individual participation in voting, protesting, and contacting the government. These measures are based on questions from the survey that ask whether the respondent voted in the last presidential election, participated in a protest in the last year, or answered yes to any of a series of questions about contacting government. We chose these measures because they give a full image of different types of political participation, including activities that elites are more interested in (voting and sometimes protest) and activities that elites may have little incentive to encourage (contacting government).
Measuring Wealth and Poverty
Choosing a measure of poverty involves some careful thought. There are two big debates over how to measure wealth and poverty: absolute versus relative measures and income versus wealth measures. In our effort to understand patterns of political participation and inequality, we intentionally focus on a relative measure of wealth and choose to measure it based on assets rather than income. That is, instead of focusing on an absolute measure of poverty, we want to think about how wealth is distributed and, more specifically, how the poorest people in each country participate relative to everyone else. To do so, we created a measure of wealth quintiles based on questions in the surveys about ownership of different assets, including items such as televisions and cars.Footnote 9 We used principal component analysis to create a quintile measure for each country year, following the lead of Córdova (Reference Córdova2008). Based on this measure, we considered respondents to be poor if they fell in the lowest asset quintile for their country and the year of the survey.Footnote 10
Control Variables
Following the literature on political participation, we controlled for individual education (years of schooling), gender, political interest, political efficacy, ideology, and whether the respondent lived in a rural area.Footnote 11 Although the models presented here do not include contextual variables like compulsory voting rules or whether a leftist president is in power, the results are robust to specifications that include these variables.
Statistical Results
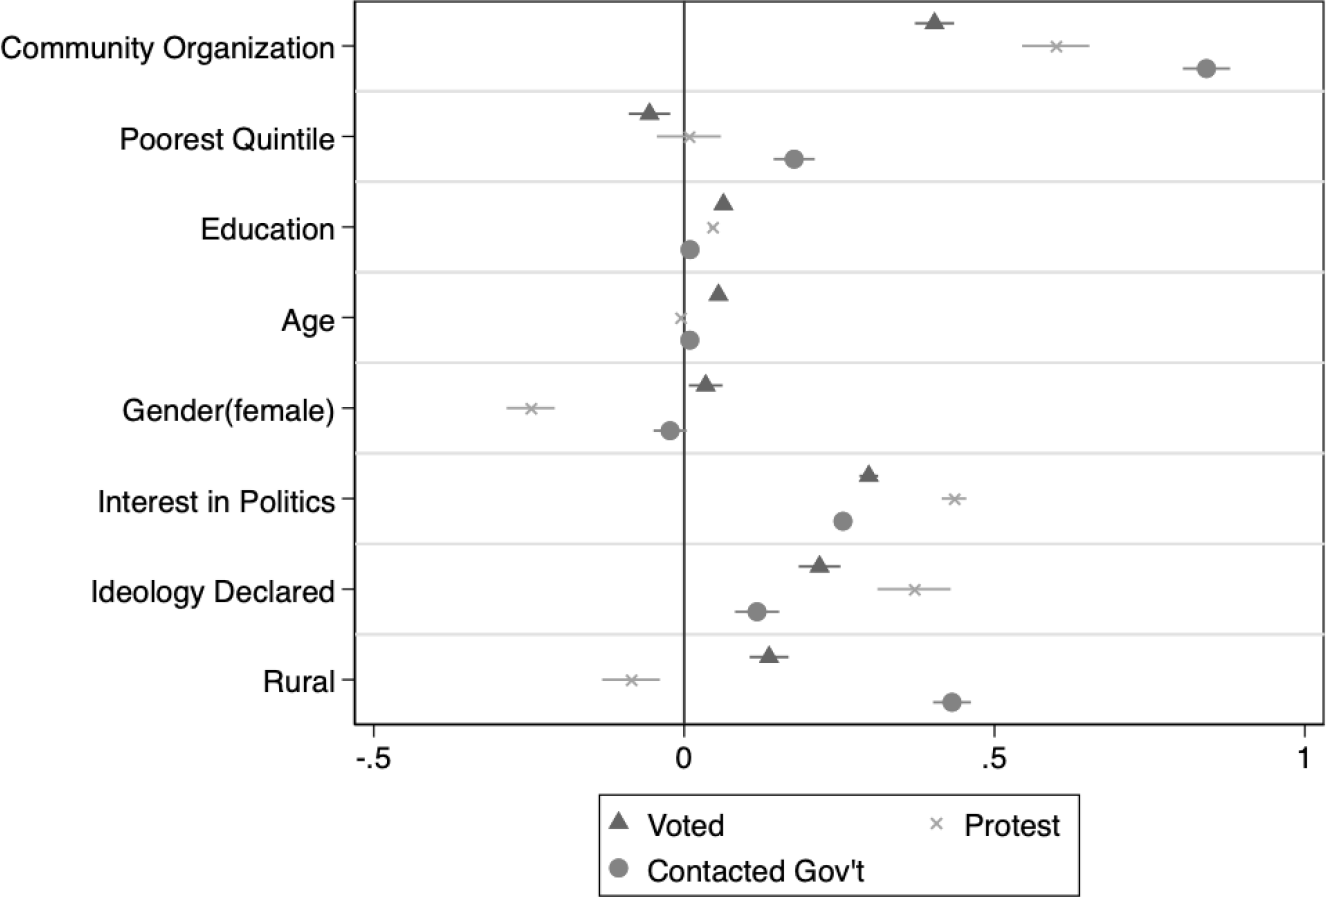
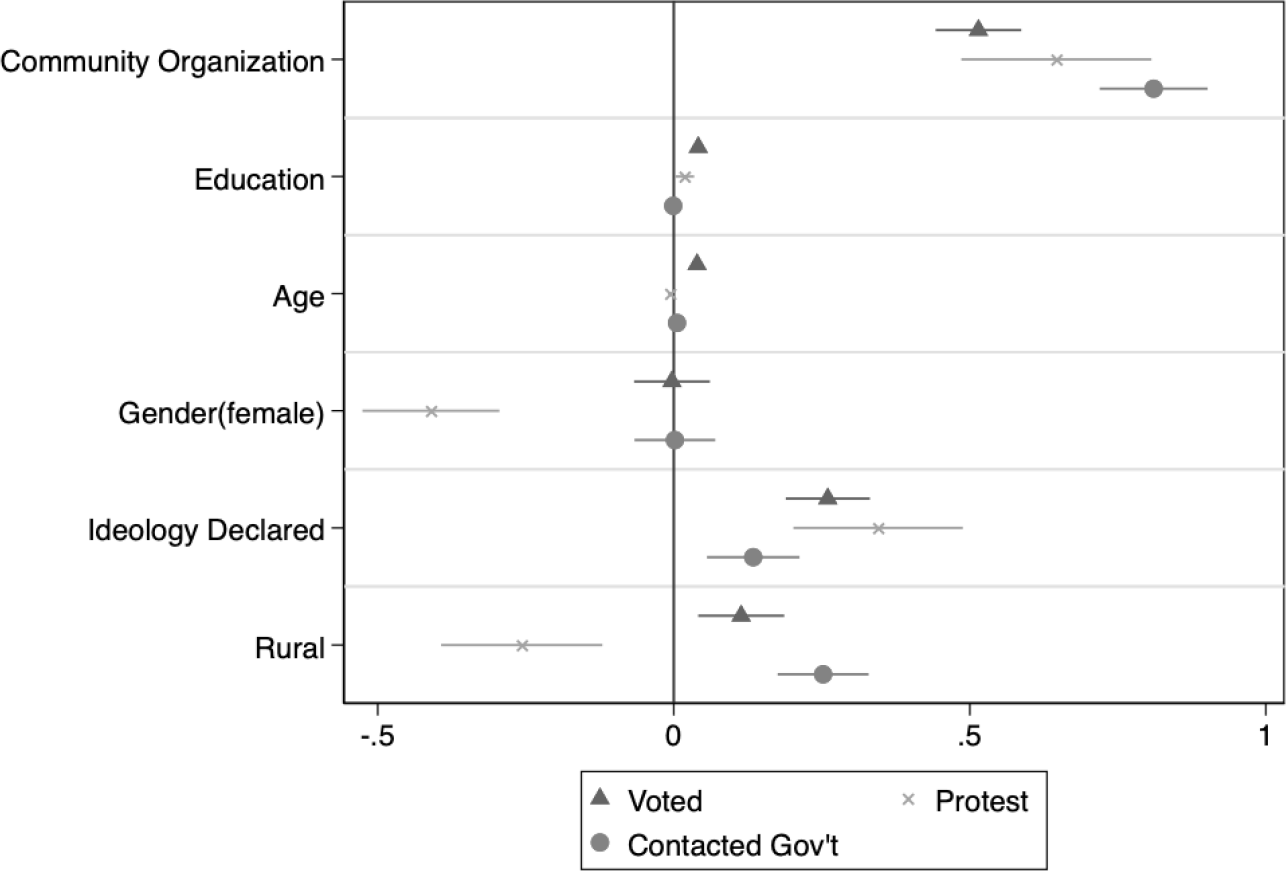
We estimated multilevel mixed effects logistic regressions because of the nested structure of our data (individuals nested within countries) and because our measures of participation are dichotomous. Figure 5 shows the results of our main regression model for voting, protesting, and contacting government. The results confirm our first two hypotheses. We find a strong direct effect of organizational membership: people who have attended meetings of any community organization even once in the last year are significantly more likely to vote, protest, and contact their government. Although the estimated effect of membership is quite strong for voting, stronger than many of the other predictors, the effect on protesting and direct contacting of government officials is stronger still. Interestingly, involvement in community organizations is a strong predictor of participation, even controlling for political interest, suggesting that the effect of organizations is independent of people’s predisposition for political activity. We will examine issues of endogeneity in a bit more detail below.
Voting, Protesting, and Contacting Government (all wealth groups)
Note: Models are estimated in STATA using the meqrlogit command. For the vote model, N = 140,472; for protest, N = 138,562; and for contacting government, N = 139,512. Full models available in the appendix.

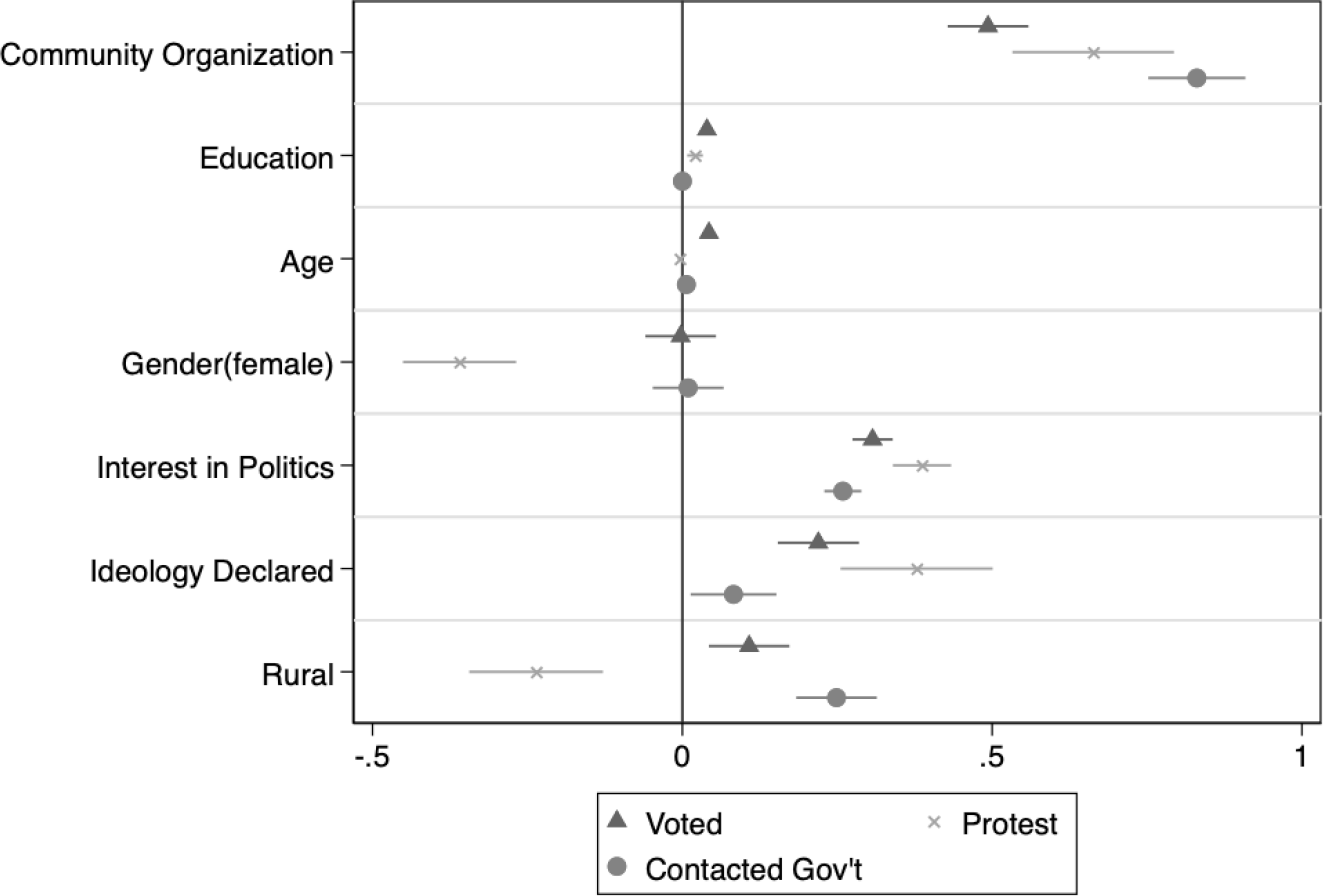
Next, we consider the same base models, but we estimate them using only the subsample of the poorest respondents (figure 6). This allows us to see what the direct effect of community organizations is on the political participation of poor individuals. Involvement with community organizations is, once again, the strongest predictor of voting, protest, and contacting government for poor people, controlling for other factors. As before, the effect of membership is strongest for government contacting and protest and less strong for voting. This makes sense, since the first two demand more coordination and resources, which poor people generally lack (H2).
Voting, Protesting, and Contacting Government (poor people)
Note: Models are estimated in STATA using the meqrlogit command. For the vote model, N = 29,725; for protest, N = 29,358; and for contacting government, N = 29,529. Full models available in the appendix.

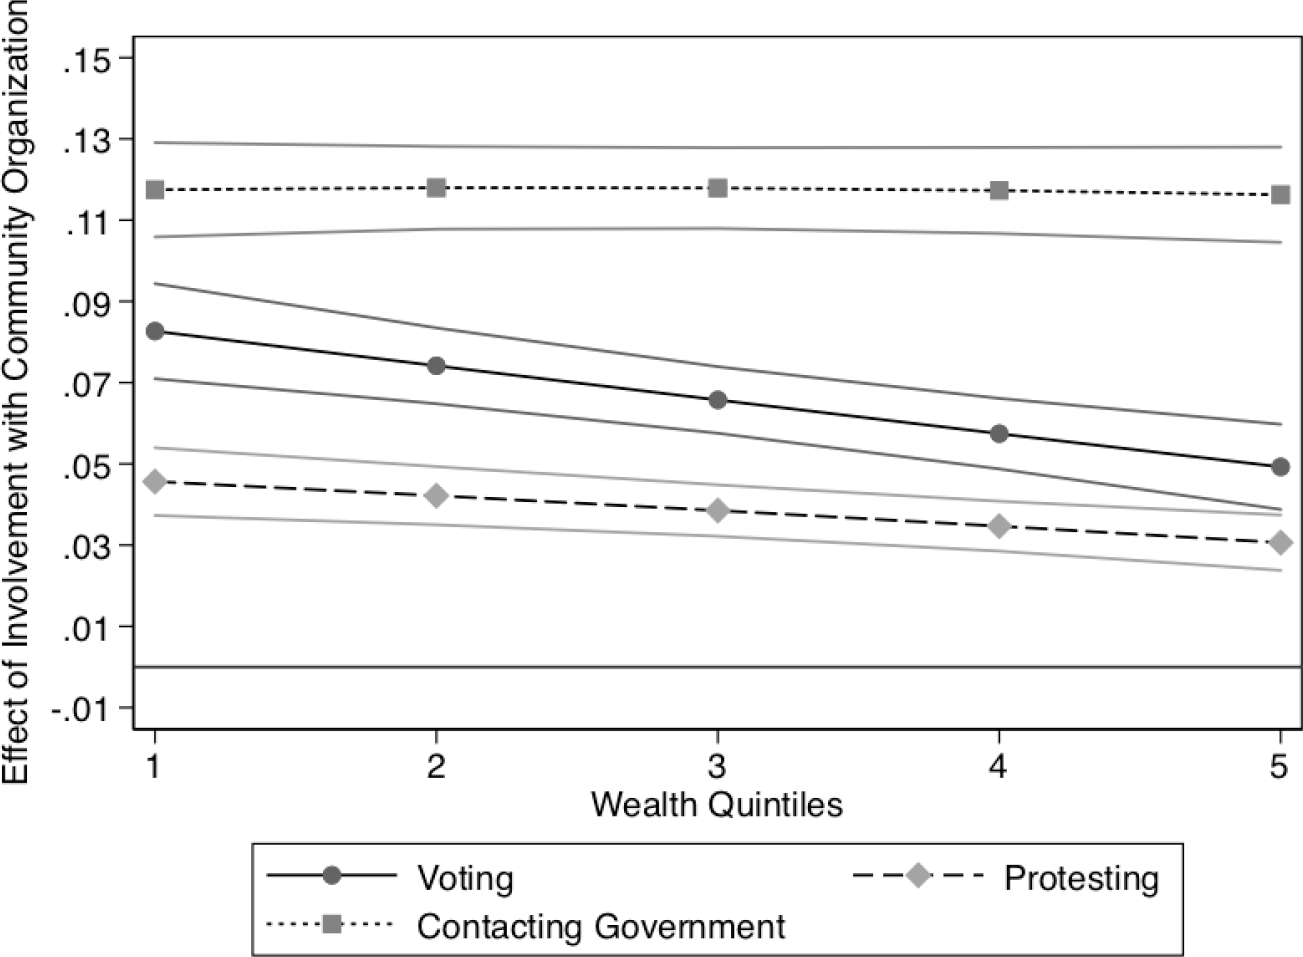
We argue that this direct relationship between community organization and participation is only part of the story. We also expect the relationship to be strongest for poor people (H3) and strongest for political acts that elites have an interest in mobilizing: voting and protest compared to contacting (H4). To test this, we estimate the same models as before but include an interaction term between poverty and involvement with community organizations. This allows us to determine whether there is a differential effect of community organization for poor people compared with wealthier people. We present the substantive results of the interaction in figure 7, which confirms that involvement with community organizations has a substantially stronger effect for voting and protesting for poorer people than for wealthier people. In contrast, there is no differential effect of organizational involvement on direct government contacting.
Average Marginal Effects of Organizational Involvement with 95 Percent Confidence Intervals
Note: Models are estimated in STATA using the meqrlogit command. For the vote model, N = 106,746; for protest, N = 107,422; and for contacting government, N = 106,536. Full models available in the appendix.

What do these results mean? Notice from figure 5 that poor people are, all else equal, less likely than more affluent individuals to vote, more likely to contact government, and equally likely to protest. Combined with the results of the models with interaction effects, this analysis suggests that organizational involvement helps equalize overall rates of political participation primarily through its differential effect on voting and protesting behavior among the poorest individuals. Without widespread organizational involvement by poor people, rates of political participation would be more unequal in the region than they are.
Direct Mobilization, Clientelism, and Vote Buying
We have shown that involvement with community organizations has a strong direct effect on voting, protest, and contacting government for everyone. We also showed that the effect is strongest for the poorest citizens and for the types of political activities for which elites have a clear incentive to mobilize people. This is suggestive evidence for the dual mechanisms we laid out—that community organizations are important both for their “bottom-up” impact, making it easier for poor people to engage in political activities by lowering collective action barriers, and in a “top-down” way by facilitating elite access to poor communities through organizations.
We carry out two more empirical tests to bolster this argument further. The first looks more directly at this top-down mechanism to see if, indeed, people who are involved in community organizations are more likely to be mobilized by candidates or political parties. We use the question asked in the 2010, 2012, and 2014 surveys about clientelism, which is, “In recent years and thinking about election campaigns, has a candidate or someone from a political party offered you something, like a favor, food, or any other benefit or thing in return for your vote or support? Has this happened often, sometimes or never?” We use this question as a proxy measure for direct mobilization.
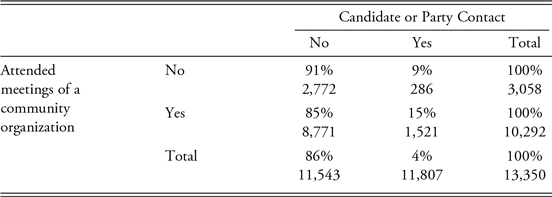
Table 1 shows the simple cross-tabulations. Among people in the poorest quintile, those who attend meetings of community organizations are almost twice as likely to be contacted directly by a party or candidate, compared with poor people who are not involved with community organizations: 15 percent compared to 9 percent.Footnote 12
Community Organization and Direct Mobilization, Poorest Quintile

Source: Americas Barometer by LAPOP 2010, 2012, 2014
We also estimate full models with direct mobilization as the dependent variable for the sample of people in the poorest quintile across all 18 countries. Controlling for education, age, gender, political interest, efficacy, ideology, and urban-rural status, involvement with community organizations is the strongest predictor of being contacted directly by a candidate or political party. In fact, only interest in politics and involvement with community organizations are significant predictors in this model. Figure 8 shows the coefficient plot for this model. This is clear evidence that organizations serve as important nodes in elites’ political recruitment efforts.
Effect of Being Offered Goods or Services in Exchange for Political Support
Note: Models are estimated in STATA using the xtmixed command. N = 7,765; No. of countries = 17. Full models available in the appendix. LAPOP survey years 2010, 2012, and 2014.

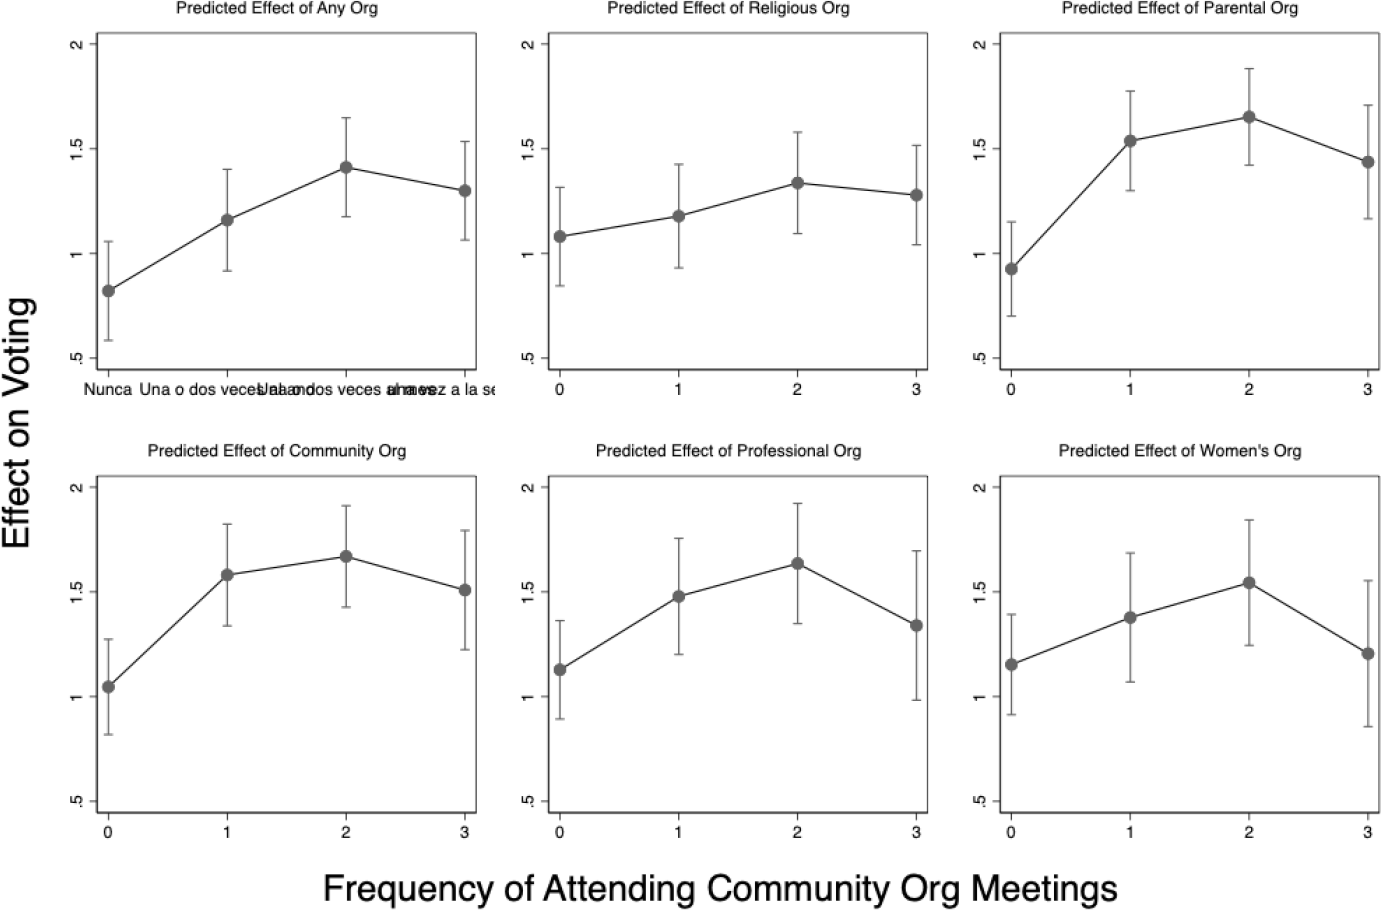
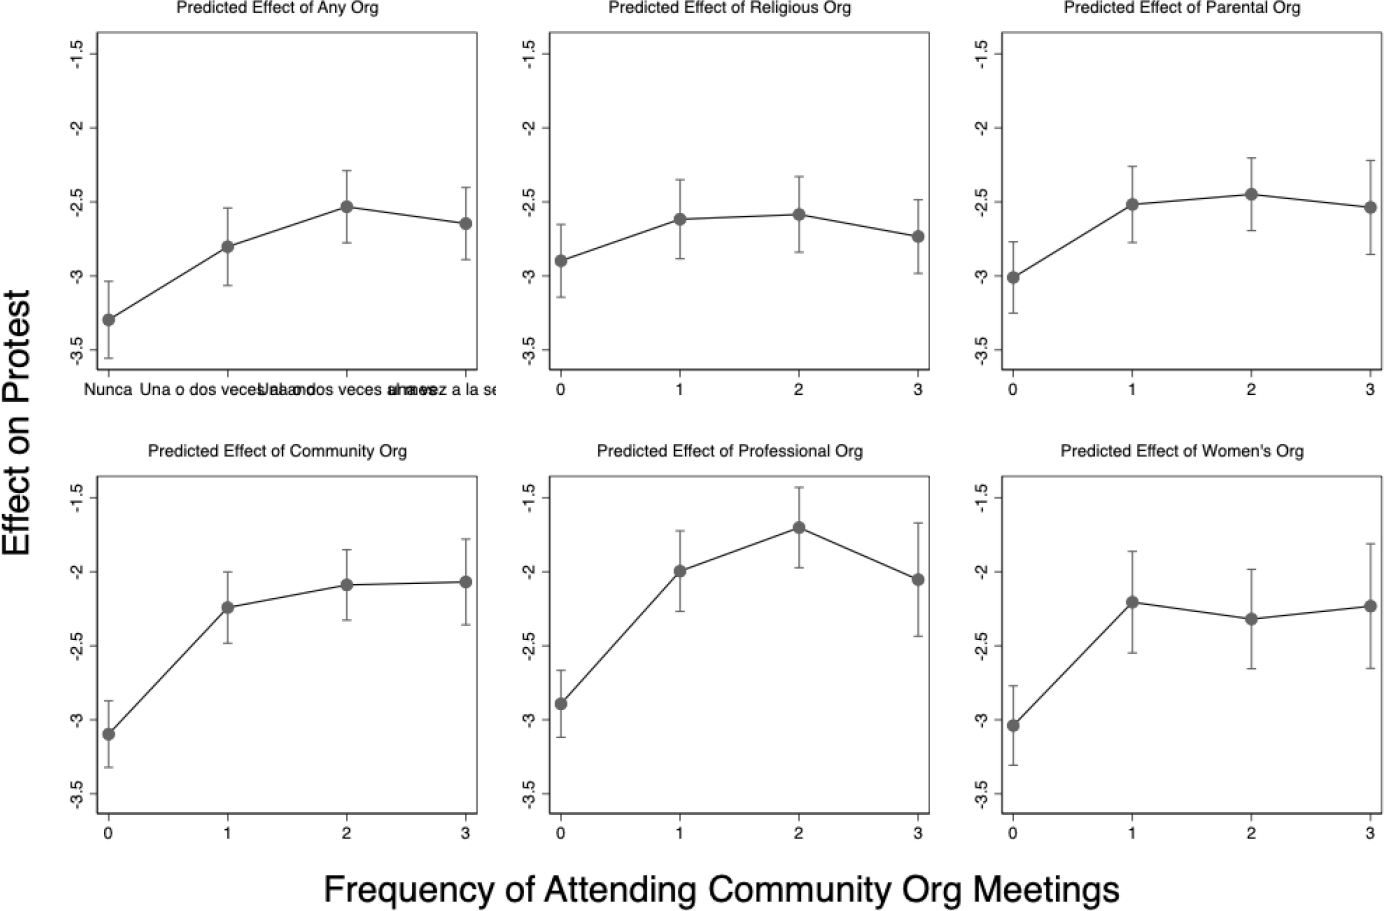
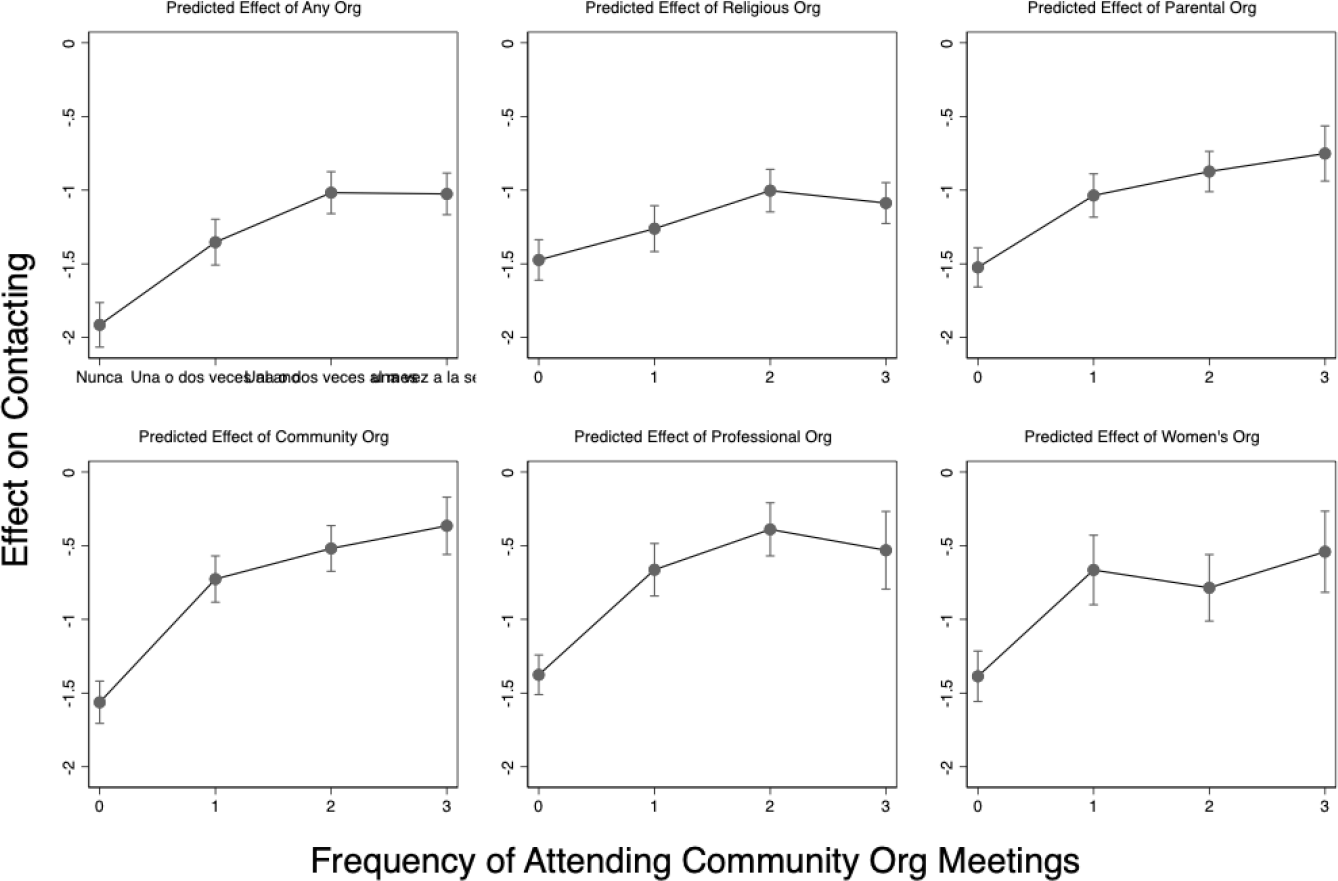
Up to this point we have used a measure of attending meetings that captures only very infrequent attendance at organization meetings and that aggregates involvement for membership in any type of community organization. The following figures show the marginal effects of attending meetings of different types of community organizations on voting, protesting, and contacting government. The figures also allow us to see whether greater involvement in the affairs of an organization leads to significantly more political participation. What is notable is that the largest boost in participation comes from attending organizational meetings very infrequently (only once or twice a year)—hardly enough time to develop and practice new skills. More frequent attendance is usually associated with a small increase in the likelihood of participating, but for many organizational types—namely, religious, professional, and women’s organizations—there is no statistically significant difference in political participation for those attending meetings once a week compared to those attending meetings only once or twice a year.
We think this is an important finding, for several reasons. First, it suggests that the mechanism linking organizational membership to political participation is not the result of what happens inside organizations—what people learn, the skills they gain, or the messages they hear. Instead, if even very infrequent involvement has a big effect on participation, it is possible that what we are really capturing is the presence of community organizations in a person’s town or neighborhood. As Schussman and Soule argue (Reference Schussman and Soule2005), organizations boost political participation by making individuals “structurally available” for mobilization, either by making it more likely that individuals will be asked to participate in political activities, or because the density of organizations in peoples’ community creates a mobilizational infrastructure that facilitates political action for everyone.
Endogeneity Concerns
One concern with these findings might be that our measure of membership in associations and our measures of political participation may capture a similar underlying characteristic. What if some people are simply more participatory in all aspects of their lives, and those people both are more active in organizations and participate in politics more regularly? If so, we might find the relationships described above, but not because involvement in organizations boosts political activity, but because the same people are inclined toward both activities. Without an experimental research design, it is difficult to fully lay this concern to rest. However, a few pieces of evidence help make our case.
First, if the effect of organizations were endogenous, then we would expect that more frequent organizational involvement would also lead to more political participation. It would be unlikely that infrequent contact with associational groups would have much of an impact. The findings shown in figures 9 through 11 indicate that this is not the case. Quite the opposite: the effects of organizations occur primarily among those individuals whose organizational participation is occasional at best; that is, among people who can hardly be described as “joiners.”
Predicted Effects of Community Organization on Voting

Predicted Effects of Community Organization on Protest

Predicted Effects of Community Organization on Contacting Government

Second, if the relationships the figures show are merely a function of highly participatory people engaging in associational life and in politics, we might expect our findings to hold only for people with high levels of interest in politics. If, on the other hand, we find that membership is associated with higher political participation, even among those who are uninterested in politics, we would have evidence that membership has the effect we claim. To explore this idea further, we estimate the models using a sample limited to people below the mean of political interest (figure 12). In every model, the uninterested respondents who attend association meetings are more likely to participate than their counterparts who do not attend meetings.
Poor People Below the Mean of Political Interest
Note: Models are estimated in STATA using the meqrlogit command. For the vote model, N = 11,899; for protest, N = 7,779; and for contacting government, N = 12,204. Full models available in the appendix.

Conclusions
Not very long ago, political participation in Latin America was characterized as in crisis. Instead of worry about instability caused by popular movements, the concern was that income inequalities were translating into political inequalities in the young democracies. The analysis in this study reveals a more optimistic picture, one in which Latin America’s poorest citizens are, on the whole, just as active as more affluent citizens. From the perspective of mainstream theories of political participation, which emphasize individual-level resources like income, education, and skills, this is a surprising and important finding. In addition, the empirical analysis of organizational activity in 18 Latin American countries confirms the findings of numerous case studies that have revealed a thriving civil society, particularly among the region’s poorest citizens. Not only are community organizations thriving, the evidence shows that they are important sites where poor people are recruited into political activity.
This study shows that membership in associations is a very strong predictor of participation across all political activities and across all wealth groups. It also shows that membership has an especially strong effect on voting and protesting for poor people, which we take as good evidence that associational membership is part of the answer to understanding poor people’s robust political participation in Latin America.
By equalizing levels of voting and protest activity across income groups, community organizations help equalize overall levels of political participation in Latin America. Of course, if poor individuals were much less active in organizations than more affluent individuals, the overall effect of membership on the political activity of low-income individuals would also be small. However, as this study has noted, the poor participate in community organizations at very high rates—averaging about 80 percent regionwide—and at levels comparable to the wealthy. It is this combination of civic activism with the differential effect of membership on voting and protesting that helps equalize political participation in the region.
This article also highlighted the important role that community organizations play in facilitating mobilization by political parties and candidates. The proliferation of civil society organizations has occurred across the continent, regardless of whether the left or the right is in power nationally. Now that free and fair elections are the norm in the region, political parties and candidates across the ideological spectrum must mobilize individuals and groups that had been traditionally excluded from politics, like the urban poor and indigenous groups, in order to win competitive elections. Thus, community organizations play an important role in enabling this more inclusive political dynamic, which holds the potential for more robust participation, better representation of popular interests, and more accountability in the region’s democracies.
Supporting Information
Additional supporting materials may be found with the online version of this article at the publisher’s website: Appendix.