In Africa, electoral competition, like civil wars, is often organized around ethnic schisms. For example, Kenya's multiparty politics have long been significantly ethnicized, and the 2007 polls led to communal violence there.Footnote 1 In countries such as Benin, Cameroon, Ghana, Guinea, Malawi, South Africa, Uganda and Zambia, where post-election violence on the level seen in Kenya has not been a problem recently, ethnicity, voting behaviour and party politics are inextricable. As a result, African elections are often seen as little more than ‘ethnic censuses’.Footnote 2 Researchers have in recent years attempted to measure more systematically the importance of ethnicity in voting,Footnote 3 and variations in the ethnic element across space and time make the ‘census’ characterization overly simplistic.
Explanations for ethnic voting in the social science literature have varied. Approaches rooted in social identity theory primarily highlight the psychological benefits the individual gains from membership in a particular identity group.Footnote 4 In the context of electoral behaviour, such approaches suggest that individuals might derive psychological satisfaction from voting for a member of their own identity group. In contrast, rationalist approaches stress the more tangible (i.e., material or security) benefits that identity group membership – and, in particular, collective action achieved by members of an identity group – can provide to individual members.Footnote 5 In the electoral realm, competitors can construct loyal bases of support by mobilizing on the basis of ethnicity, while voters themselves can reap significant material benefits if a co-ethnic wins political power and proceeds to distribute patronage to co-identifiers. In these scenarios, both elites and citizens benefit from the organization of political competition along ethnic lines.
A subset of these rationalist approaches highlights an additional benefit of ethnicity in electoral politics: its potential as a cheap source of political information. These treatments draw upon theories of information-processing in electoral settings and posit that at least part of the utility of ethnicity lies in its function as a facilitator of political communication and learning. If voters believe that political preferences or candidate characteristics tend to cluster within ethnic groups – if, say, co-ethnics generally favour one another in clientelistic behaviour, or members of certain groups generally have stronger or weaker leadership capabilities – they can generate predictions about potential office holders’ future behaviour. Under this formulation, ethnicity acts as an informational shortcut, or heuristic, as it provides important cues about competitors’ potential preferences and characteristics, at a low cost to the voter.Footnote 6
In recent years, a number of treatments of ethnic voting – in Africa,Footnote 7 but also in South AsiaFootnote 8 and EuropeFootnote 9 – have stressed this informational function. These scholars write on societies that are ‘information poor’, because mass media infrastructures are not well developed, average political sophistication rates are generally low, and/or party systems are in transition. In such environments, voters weight competitors’ ethnic identities heavily in their decision-making processes, partly due to the fact that ethnicity is often determinable from what Chandra calls ‘costless’ features such as name, physical features, speech and dress.Footnote 10 For example, Posner writes:
in the absence of reliable information about either the policies that the competing candidates will pursue or the ability of each contestant to secure development resources for the constituency from the central government, voters will focus their attention on what little information they do have that will allow them to predict the candidates’ future behavior: the candidates’ ethnic affiliations. In fact, the less information that voters have about the candidates in the race, the more they will turn to ethnicity as a decision-making shorthand.Footnote 11
Similarly, Chandra stresses how such limited information creates enormous pressures to organize politics around the easily recognizable schism of ethnicity. In these environments, a voter simply ‘counts heads’ to determine which party's leadership best represents his or her identity group, and then votes for that party, provided that the party is electorally viable.Footnote 12 And Birnir argues that voters will be especially attracted to ethnic parties in transitional societies, because co-ethnics’ pronouncements will be deemed more credible in environments in which parties do not have long-standing policy positions.Footnote 13
To date, empirical tests of such conceptualizations of ethnic cues acting as informational shortcuts have been limited, and the implications of such theories have not yet been sufficiently explored. Ferree, for example, finds that racial heuristics are important determinants of vote choice in South Africa, but her research does not examine how these impacts vary according to informational context.Footnote 14 In sum, a number of important questions on the relationship between information availability and ethnic voting remain. First, what evidence do we have that ethnic voting is more common in information-poor environments? And, if such a relationship between information availability and ethnic voting does exist, then should it follow that rates of support for co-ethnics are responsive to changes in the availability of political information?
Drawing on recent applications of information theory to ethnic voting studies, this article lays out a theory, developing the argument more fully, that one significant reason for the importance of ethnicity in electoral politics in Africa is the role that it plays in facilitating information gathering. In their attempts to form evaluations of which competitor would best serve their interests, voters in Africa make judgements from competitors’ ethnicities, which might provide cues about those competitors’ preferences, capabilities and electoral viability. When little other information is available, ethnicity will have a heavy impact on individuals’ eventual decisions. But when the costs of other types of political information decrease, ethnicity's observed influence might decline. More specifically, when this information suggests that a candidate from Group A is deficient in some ways to one from Group B – i.e., he or she is deemed to have lower capabilities, lower electoral viability or less-desirable political preferences than the candidate from Group B – rates of ethnic voting within Group A will decrease.
Here, hypotheses derived from this theory are tested with data from a survey experiment conducted in two districts of Uganda. The experiment involved exposing subjects to different types of information about hypothetical candidates, and measuring how information affected support for co-ethnics. The results suggest that support for co-ethnic candidates is contingent on the availability of information.
Information and shortcuts in African electoral contexts
One of the most significant costs of voting is the time, effort and resources that must be expended to collect and analyse information about competitors and issues in order to maximize the utility of one's vote. Theories of electoral behaviour in the United States and other Western countries reference how voters use ‘shortcuts’ to minimize the costs of information collection and processing.Footnote 15 Instead of spending hours poring over transcripts of candidates’ speeches, policy proposals and past roll-call votes, citizens often draw conclusions about competitors’ potential performance and preferences from more easily obtainable facts, such as party identification,Footnote 16 ideological labels,Footnote 17 and endorsements.Footnote 18 Whether consciously or not, they also often make assumptions based on candidates’ race, sex and age.Footnote 19 Voters might not rely exclusively on shortcuts, but such cues are significant even for the most politically engaged.
We should not expect that African voters would differ in this regard; they are also likely to use shortcuts to gather information prior to elections. However, most African countries differ significantly from the Western societies on which these theories of heuristics and voting behaviour are based in two significant respects relevant here. First, political information is generally quite costly in most African countries. Data on candidates’ educational backgrounds, past performance as office holders and policy positions are either completely unavailable, or are too costly for most voters, who are often illiterate, unable to understand linguae francae, or too poor to afford newspapers, television or internet connections.
Secondly, the types of shortcuts that are common in many advanced democracies are simply not available or relevant in most of Africa. Many systems are still quite transitional, with party systems, loyalties and institutional arrangements remaining in flux. This limits the utility of party labels as useful cues. Most prominent parties in Africa structure their appeals around valence issues or somewhat vague populist rhetoric, and parties are often not discernible by programmatic differences.Footnote 20 And ideological labelsFootnote 21 and endorsements from well-established advocacy groups or unions rarely figure prominently in African campaigns.
African voters, therefore, face significant barriers to gathering information about electoral competitors. Data on many candidate attributes, such as education, policy positions and past performance as office holders, are scarce, but even many of the heuristics that help voters in most established democracies improve efficiency in information-collection and decision-making processes are simply not available or relevant in the vast majority of African contexts. Lacking more relevant data, voters are left to rely quite heavily on one of the few relatively cheap forms of information available about competitors: ethnicity.
The Utility of the Ethnic Shortcut
As a shortcut, demographics like ethnicityFootnote 22 have the advantage of being extremely cheap for the voter to collect.Footnote 23 Voters can use easily observable aspects of a competitor's identity to draw conclusions about at least three things: preferences, capabilities and electoral viability. The first two matters constitute the voter's prediction of the competitor's likely behaviour and performance as an office holder, while the latter is important as a strategic consideration.
A voter might use a competitor's ethnicity to draw conclusions about likely behaviour as an office holder in one of at least two ways. First, the voter might access stereotypes about the preferences of members of some groups – their positions on, say, political and social issues – or capabilities – whether they have produced ‘strong’ or ‘weak’ leaders in the past, whether they are trustworthy when handling finances, etc. In Uganda, for example, certain ethnic groups that live primarily in the country's north-east, such as the Karamajong, are widely snickered at by their fellow citizens as ‘uncivilized’, due to their dress and nomadism.
Secondly, in circumstances where the voter believes that the distribution of goods is dependent upon potential recipients’ ethnic identities, that voter will tend to assume that a co-ethnic's preferences would be more favourable. In Africa, where access to state resources often determines an individual's or community's economic success, there are pressures to limit the size of pork-seeking coalitions, so as to maximize each recipient's share.Footnote 24 Identifying members on the basis of their ethnicity is a particularly useful strategy for limiting coalition size, mainly because it is difficult, if not impossible, to change one's ethnicity; this limits opportunistic bandwagoning after elections.Footnote 25
Finally, voters will also weight their considerations of competitors’ potential capabilities and preferences according to these competitors’ electability. Supporting a highly capable candidate whose preferences align perfectly with a voter might not be an optimal strategy for the voter if the candidate's probability of election is near zero. In contexts in which political competition is already ethnicized, this might mean that candidates from demographically small or historically powerless groups might be deemed to have a low probability of electoral success. As Chandra argues, voters consider not only the ethnic makeup of competitors, but also of the relevant electorate.Footnote 26 After considering the identity of both the competitor and the likely voting population, a rational voter might conclude that supporting a co-ethnic is not the best strategy. In sum, strategic voters will determine their final choice on the basis of competitor preferences, capabilities and electability. Ethnicity can provide cues about all three.
However, while ethnicity is a competitor attribute that the voter can identify extremely cheaply, its utility is limited by its informational quality. Generally speaking, cues vary in the quality of the information they provide to the voter. Here, I define the quality of the information in terms of how much it helps the recipient to reduce errors in predicting competitors’ preferences, capabilities and viability. When compared to alternative sources of information about candidates, ethnic cues are of relatively low quality; in other words, voters relying exclusively on ethnic cues are more likely to make decision errors. For example, in their campaign simulations based on elections in the United States, Lau and Redlawsk find that subjects’ use of candidate appearance heuristics is negatively associated with ‘correct voting’.Footnote 27
As a predictor of office-holder preferences, behaviour and viability, ethnicity is relatively problematic. Certainly, group-based stereotypes are poor predictors of individual members’ attributes, be they intelligence, leadership capacity or scrupulousness. And while voters often assume that rule by co-ethnics will result in favourable distributional policies for their group, formal and empirical work have demonstrated that rulers do not necessarily reward co-ethnics, or even core supporters.Footnote 28 Instead, other information, such as past policy positions and distributional behaviour, can be more useful in predicting possible incumbents’ preferences, while factors such as education and past performance as office holders will likely prove better predictors of capabilities. Viability can be assessed with opinion poll data and other measures of the electorate's dynamic sentiments. All of these types of information are arguably of higher quality than ethnicity.
As the price of such higher-quality information declines – due to factors such as the improvement and diversification of mass media infrastructures, launch of civic education campaigns or increase in government transparency – increasing numbers of citizens will be able to broaden the types of information they access. The decreased cost of higher-quality political information will not be likely to lead voters to eschew ethnic considerations completely, but it will mean that these voters, who now have broader informational repertoires, will not rely on ethnic cues exclusively in their electoral decision making.
Within a given ethnic group, rates of ethnic voting will then decline when higher-quality information is present, provided that such information suggests that a non co-ethnic competitor is significantly superior in one or more key aspects (capabilities, preferences, electability) than a co-ethnic one. When voters have higher-quality information that suggests that a co-ethnic would be a more capable governor, possesses preferences nearly identical to their own or would be more likely to win, their rates of voting for a co-ethnic are likely to be indistinguishable from what they would be in a comparable situation in a low-information environment. Only when that higher-quality information suggests relative deficiencies on the part of the co-ethnic competitor will ethnic voting rates within the group decline.
This leads to the following hypotheses:
HYPOTHESIS 1: In low-information environments (i.e., when the only affordable information is competitors’ ethnic identities), most voters will support a co-ethnic competitor, assuming one exists.
HYPOTHESIS 2: In environments in which higher-quality information is both available and presents co-ethnics negatively vis-à-vis non co-ethnics, rates of support for co-ethnics will be lower than under low-information environments.
An important caveat must be entered here regarding Hypothesis 1, however. As previously discussed, most theories on information and ethnicity do not predict that individuals will automatically vote for co-ethnics in low-information environments. Rather, theories on ethnicity and strategic voting, like Chandra's, hold that voters’ support for co-ethnic competitors is conditional on those competitors’ viabilities.Footnote 29 From an instrumental perspective, a competitor with an extremely low probability of winning is of limited utility to the voter, no matter the ethnic identity. Instead, a voter might conclude that supporting a more viable non co-ethnic is a better strategy, particularly in a context in which institutional rules or demographics make it unlikely that any competitor can win with the support of its own ethnic group alone. Even if such a non co-ethnic is likely to provide his or her ethnic brethren with the largest share of spoils, voters might still conclude that they can maximize utility by supporting a likely winner, since communities and individuals who support losers are often the least likely to receive patronage goods.Footnote 30 Finally, as previously discussed, in contexts in which ethnicity is already politically salient, a competitors’ ethnic identity can provide an important, albeit imperfect, cue about electoral viability, with demographically larger or historically more powerful groups deemed more electable.
From this, we can generate an additional hypothesis:
HYPOTHESIS 1a: In low-information settings, voters will be more likely to support a non co-ethnic if the non co-ethnic is deemed more viable than a co-ethnic.
Findings supportive of Hypothesis 1 cannot necessarily lead us to conclude that the informational approach is superior to a purely social-psychological one, since both theories predict the same behaviour in low-information environments: support for co-ethnics. However, support for Hypothesis 1a or Hypothesis 2 would suggest that ethnic voting is not driven primarily by expressive considerations, as a pure social-psychological theory would suggest. Rather, if voters use competitors’ ethnic identities instrumentally, to predict possible incumbents’ preferences, capabilities and viability, then we should expect that rates of support for co-ethnics will be elastic according to broader informational contexts.
Research methodology
Survey data can be inadequate for examining relationships between information access and ethnic voting, because simultaneity problems are likely to occur. Likelihood of acquisition of political information is almost never determined solely by exogenous (i.e., structural or institutional) factors; in all but the most restrictive environments, individual-level factors, such as access to resources and education, determine acquisition to some extent. What is more, two individuals who live in the same environment and possess the same resource endowments might end up acquiring different amounts of political information if they have different levels of political interest. Political junkies will be more willing to expend time and resources to collect political information than the politically apathetic.Footnote 31 And since the traits associated with political interest might also be associated with differing propensities towards ethnic voting, establishing causal relationships between information access and voting behaviour will be highly problematic with survey data alone.
For these reasons, experimental methods may be more helpful in establishing causation. With such methodology, the researcher can essentially control the individual's access to information about particular competitors and measure differences in preferences, either between those who have or have not acquired information, or before and after acquisition by the same individuals. This project uses the latter technique, in the form of an experiment conducted in two districts of Uganda in January 2008. The experiment involved measuring subjects’ support for co-ethnics versus non co-ethnics in a series of distinct two-candidate races for local office, in which the amounts and types of information provided about the candidates varied. Rates of ethnic voting were highest when the environment yielded the least information, but were markedly lower when comparatively negative types of information about co-ethnics were presented.
Case Selection
The experiment was conducted in Uganda, which was selected due to the country's history of ethnic salience in politics and (relatively) open environment for discussion of political issues. Uganda is one of the most ethnically diverse countries in the world. The largest group – the Baganda – only comprises 16.9 per cent of the population (2002 Census),Footnote 32 while six groups claim more than 5 per cent of the population, and sixteen between 1 and 5 per cent. Much of the country's post-independence history has been marred by violent conflict organized around religious, ethnic and regional divisions. Early political parties developed around schisms between Catholics and Protestants, the country's first severe political crisis (in 1966–67) centred on disagreements over the role of Buganda's kabaka (king) in national politics,Footnote 33 and certain groups – particularly the Acholi, Baganda and Langi – were victims of mass killings in the 1970s and 1980s.Footnote 34
Even though the Movement system, which banned electoral participation by parties between 1986 and 2005, was ostensibly organized to spare the country the spectre of communalism, ethnicity remains salient in Uganda.Footnote 35 Under the current regime, there has been resentment, particularly amongst the Baganda, that President Yoweri Museveni's home region in the West and his ethnic group, the Banyankole, have benefited unfairly. Uganda's independent press has begun a more systematic examination of these allegations, particularly in the shadow of inter-ethnic violence in neighbouring Kenya, and has found some evidence of biases against certain regions, in terms of government hiring practices, ministerial positions and budget allocations.Footnote 36 The realities of the country – that ethnicity is important in both everyday interaction and in political competition, and that the country is now stable enough as to allow for open discussion of such issues – make it a propitious setting for such research.Footnote 37
Design of the Ugandan Experiment
The experiment involved within-subject manipulations, in that each subject received every level of the treatment. Subjects were asked to listen to vignettes about hypothetical, two-candidate races for sub-county (LC3) chairmanships;Footnote 38 all subjects were informed at the outset that the information they were being given was about imaginary candidates and races.Footnote 39 Subjects were then asked which of the two candidates they would support. Eight of the vignettes included information about candidates’ ethnicities. Here, one candidate was always a co-ethnic of the subject – the subjects were asked to self-identify before the experiment began – while the other candidate was from a randomly assigned Ugandan group with which the subject did not identify.Footnote 40
Under the first condition (i.e., the control), the only distinguishing information provided about the candidates was their ethnic identities. The subjects’ responses here served as a baseline for their general likelihood of supporting a co-ethnic. In each of seven subsequent conditions, one piece of information about each of the candidates in addition to ethnic identity was provided. In other words, apart from the first condition, all conditions contained two pieces of information on which the candidates differed: ethnicity and one other item. These conditions followed a pattern, in which the other information that was provided painted the subjects’ co-ethnic negatively and the non co-ethnic positively.
This information fell into seven categories: party affiliation; popularity, as evidenced by crowd size at a recent rally; past involvement in corrupt practices; level of education; issue position on a locally relevant political controversy (land use); past performance as an office holder; and status as a distributor of goods during the campaign. The co-ethnic was always described as from a party to which the subject was not affiliated, generally unpopular, corrupt, undereducated, holding political opinions incompatible with those of the subject, having performed poorly in previously held positions, or as not having distributed goods to voters during the campaign. Conversely, the non co-ethnic was described as being from the same party as the subject, generally popular, scrupulous, well-educated, holding opinions compatible with those of the subject, having performed well in previously held positions, and as having distributed goods to voters.
The null hypothesis was in each case that there would be no significant difference in subjects’ levels of support for the co-ethnic candidate between the baseline and subsequent treatment; rejecting the null hypotheses would suggest that the presentation of certain other types of information impacted the marginal effect of ethnicity on subjects’ vote choices. Such a finding would conflict with pure social-psychological approaches. They would also, however, suggest that extant literature suggesting that the political salience of ethnicity arises from information scarcity needs to be amended to account for possible effects of changes in informational contexts.
All subjects received these treatments in the same order. Because the survey was conducted using pencil and paper, and because interviewers had to tailor vignettes on the basis of subjects’ responses to earlier questions, randomization of question order would have increased interviewer error. Indeed, this does raise possible concerns over spillover effects, which cannot be mitigated entirely. The specific fear here would be that, once a subject had ‘defected’ from a co-ethnic, he or she would be more likely to defect under a subsequent treatment. However, we can be somewhat more confident that the ordering of treatments did not determine results under later conditions because, out of all the subjects who supported a co-ethnic at the baseline, only 2 per cent defected to a non co-ethnic under some future treatment and then never returned to support a co-ethnic in a subsequent round. In other words, the design does not seem to have precluded ‘de-defection’ once ‘defection’ had occurred. In order to try to minimize possible spillover effects, the research assistants reminded subjects at the outset of each round that they were now discussing an entirely different election.
Subjects were selected via multistage, area probability (‘cluster’) sampling; 186 interviews were carried out in Makindye Division (Kampala District) and 184 in Bbaale County (Kayunga District), for a total N of 370. To be sure, the sample's limited size and geographic location (i.e., drawn only from the Central Region) means that it cannot be considered representative of all Ugandans, let alone of Africans generally. However, the sampling protocol was designed explicitly to minimize the likelihood of drawing urban and rural samples that were significantly different from country-wide averages on key economic and social development indicators. Details on these protocols can be found in Appendix A.
Treatments
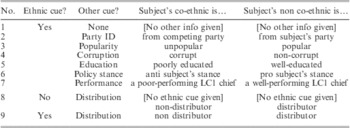
The information provided under the different conditions was as follows. English-language wordings of all vignettes can be found in Appendix B, while a summary of treatments can be found in Table 1.
Summary of Vignette Constructions

Party
In including this treatment, the goal was to identify how often subjects would defect from their ethnic group when a co-ethnic was from a party other than their own and a non co-ethnic shared their party affiliation. Although Museveni's National Resistance Movement (NRM) is dominant, there are a number of at least moderately robust opposition parties. Some of these, such as the Democratic Party (DP) and the Uganda People's Congress (UPC), have roots stretching back to the pre-independence period, while the Forum for Democratic Change (FDC) is the largest opposition group in the Parliament. In the survey, three-fifths (60.2 per cent) of subjects reported feeling ‘closest’ to the Movement, followed by 22.8 per cent for the FDC and 4.3 per cent for the DP. Four parties registered support of less than 1 per cent, and 11.1 per cent of subjects did not indicate support for any party.Footnote 41 Finally, although ethnic identity is certainly correlated with party affiliation in Uganda – for example, Banyankole are more likely to be Movement supporters, while Langi are more likely to support the UPC – all parties are multi-ethnic in their membership, and no ethnic group's membership is unanimously affiliated to a single party. Therefore, none of the vignette constructions should be unreasonable, even though the ethnic and party assignments are done randomly.
Precisely what information party cues provide is unclear. While party identity often provides cues about members’ political preferences in many systems, in others, including many African ones, parties are seen as defenders of specific ethnic interests.Footnote 42 In these cases, even those voters who eschew co-ethnic candidates are still ‘voting ethnically’, provided that in doing so they are supporting a party traditionally seen as aligned with their group. In the context of this study, we should not, therefore, conclude that defection from a co-ethnic under the party treatment necessarily represents the diminished importance of ethnic cues.
Popularity
As previously discussed, backing losers can have deleterious consequences if winners decide to punish their opponents’ supporters by excluding them from distributional coalitions.Footnote 43 In other instances, voters seeking to dislodge an incumbent might seek information about alternatives’ relative strength, in order to improve the probability of leadership change.Footnote 44 Therefore, many voters look for clues as to how candidates are likely to perform on election day. Pre-election polling data can be hard to come by in Africa, especially outside presidential races, so voters are often denied one of the primary tools that facilitates strategic voting.Footnote 45 One way that voters can increase ability to predict the outcome of elections is by monitoring attendance at campaign rallies. While not everyone attending a rally is likely to vote for the host – many turn out for the giveaways or entertainment – a candidate who draws relatively small and/or unenthusiastic crowds is unlikely to do well in the area come election day. In this treatment, therefore, the co-ethnic candidate was depicted as suffering from meagre turnout at his rallies, while the non co-ethnic enjoyed large crowds.
Corruption
Here, a ‘corrupt’ candidate (the co-ethnic) was described as someone who had ‘taken millions of shillings from the local coffers and distributed it to his family and political supporters’. By design, there is no mention that he channelled these resources to local development projects or any other public goods, which might be more acceptable in Africa's ‘moral economy’.Footnote 46 The non co-ethnic was described as someone who had been lauded for his past scrupulousness.
Education
A candidate's education might be a good indicator of his or her capability as an office holder. In this treatment, the co-ethnic candidate was described as illiterate and as having not completed primary school, while the non co-ethnic was described as having obtained an advanced degree from the prestigious Makerere University in Kampala.Footnote 47
The Land Issue
In Africa, platforms often consist of vague promises of development and anti-corruption drives, rather than detailed policy statements and stances on controversial issues. However, this does not necessarily mean that issues, and competitors’ positions on them, are unimportant to voters. This project examined an issue that has been particularly controversial in Uganda in recent years: the use of land.
It has been estimated that by 2050, Uganda's population density will have reached about 380 people/km2; in 1985, just before Museveni took power, that figure stood at only 61 people/km2.Footnote 48 Conflicts over land are likely to increase. In April 2007, three people were killed in central Kampala when protests over the government's plan to allow about 10,000 hectares in the protected Mabira forest to be cleared by the Sugar Company of Uganda (Scoul) devolved into looting and violence. The fact that Scoul's parent company, the multinational Mehta Group, is owned by a Ugandan of South Asian descent added ethnic elements to the controversy. During the rioting, South Asian Ugandans were targeted with violence, resulting in the death of one motorcyclist and damage to a Hindu temple. Issues such as tenants’ rights, the use of Ugandan land by foreigners and the kabaka's control over certain territories in Buganda have been particular flashpoints. In the survey, 92.2 per cent of subjects agreed with the statement that ‘[i]t is important for Uganda to protect its unique forests, and especially not to sell them to foreign companies.’ In the treatment, the co-ethnic candidate was described as having a position that was incompatible with the subject's, while the non co-ethnic candidate had one identical to the subject's.
Performance as Office Holders
While an incumbent Ugandan president has yet to be turned out via the ballot box, voters have been more than willing to oust underperforming local officials. For example, in the 1998 elections, nearly three-quarters of incumbents at the local level were voted out of office, largely due to corruption or generally poor performance.Footnote 49 In the treatment, the co-ethnic candidate was described as having performed badly in a past elected position in the areas of crime, public health and community participation, while the non co-ethnic candidate was described as having performed quite well in these areas.
Goods Distribution
Campaigns in Africa are often marked by candidates and parties distributing items of varying value, such as foodstuffs, meals, drinks (of the alcoholic and non-alcoholic variety), calendars and toiletries, at rallies or other public events.Footnote 50 While these distributions might appear to be nothing more than attempts at vote buying, the fact that explicit quid pro quos do not accompany a large proportion, or perhaps even a majority, of these handouts suggests that they might be signalling strategies implying that the competitor is likely to favour the recipient in post-election distributions of more substantial patronage goods. The act of distribution might suggest at least four things. First, the distributor clearly has access to resources, and pre-election access might very well be correlated with post-election distributional capacity.Footnote 51 Secondly, the act of distribution might represent an attempt on the part of the distributor to suggest that he favours distributional strategies, rather than hoarding. In Africa, citizens expect that those who have will share with those who have not;Footnote 52 competitors who do not participate in redistribution risk suggesting that they do not subscribe to the tenets of this ‘moral economy’. Thirdly, by targeting pre-election distribution to certain populations, the distributor might be attempting to signal that the recipient populations can specifically expect to receive future benefits, if the distributor wins. Finally, distribution might be considered an indicator of electoral viability;Footnote 53 competitors who do not distribute in an area risk suggesting that they cannot adequately compete for votes there. In sum, competitors’ distributional behaviour might provide important cues for voters about these competitors’ capabilities, preferences and viability.
Whatever the reason for these distributions, they clearly represent attempts by the distributor to win new support or mobilize an extant base. In the treatment here, the co-ethnic was described as someone who distributes absolutely nothing to voters during campaign rallies, while the non co-ethnic was described as someone who reportedly distributed bags of sugar.
In sum, these treatments represent attempts to cross-pressure voters. Apart from the control condition, each election was designed to approximate a situation in which subjects were forced to choose between a candidate who shared their ethnicity, but was deficient in one particular area (e.g., less educated, less popular, more corrupt, incompatible on a key issue, a poorly performing incumbent, or a non-distributor), and one who did not share their ethnicity, but was superior to his competitor in this same area. Admittedly, the differences between the candidates were stark, with the co-ethnic always portrayed entirely negatively, and the non co-ethnic portrayed entirely positively. However, if individuals primarily vote expressively, as a social-psychological model would suggest, then we should not expect that their support for a co-ethnic will vary according to informational context. Similarly, if benefits of the sort that might be provided only by a co-ethnic (i.e., patronage and/or security) are a voter's only electoral priority, then we should also not expect that that he or she would abandon a co-ethnic, even when presented with information suggesting that a co-ethnic is deficient on some measure vis-à-vis a non co-ethnic challenger. In other words, many theories of ethnic voting suggest that supporting a co-ethnic will always be a voter's preferred strategy, regardless of informational context.
In situations in which a subject's support for co-ethnics is static under various informational contexts the design here does not allow us to test between competing explanations for ethnic voting; the subjects might always support co-ethnics for expressive or instrumental reasons. However, if support for co-ethnics varies according to informational context, this suggests that at least some of the political salience of ethnicity can be attributable to the information that ethnic cues provide in low-information environments.
Findings
The results of the experiment provide support for all the hypotheses previously enumerated (Hypotheses 1, 2 and 1a). Subjects demonstrated strong support for co-ethnics under the lowest-information condition (Hypothesis 1), but the overwhelming majority defected when higher-quality information that portrayed co-ethnics comparatively negatively was present (Hypothesis 2). In other words, the results suggest that the marginal impact of ethnicity on vote choice might decline when information portraying co-ethnics in a relatively negative light is available. However, support for co-ethnics under the lowest-information condition did vary according to the ethnic group of the subject and his or her hypothetical co-ethnic's opponent. Support for non co-ethnics was significantly higher when the subject's co-ethnic candidate was not particularly viable (i.e., from a small or historically less-powerful group), but a non co-ethnic candidate was viable (i.e., from a larger or historically powerful group) (Hypothesis 1a).
Hypotheses 1 and 1a: Ethnic Voting under the Lowest Information Condition
In the first condition, when no distinguishing information other than ethnicities was given, just over four-fifths (80.3 per cent) of subjects supported the candidate whose identity matched their own. This baseline finding presents two important considerations. First, it establishes that, in low-information settings in which a co-ethnic faces a non co-ethnic, most subjects preferred the co-ethnic candidate. Alone, the finding does not suggest whether ethnic voting is driven primarily by expressive or instrumental logics. Secondly, it suggests that most subjects here had no problem with indicating preference for a co-ethnic in the interview setting. In other words, subjects did not seem overly concerned with projecting a certain level of ‘political incorrectness’. This should provide further confidence that the findings below can be attributable to a genuine weighting of ethnic and co-ethnic candidate options on the part of subjects, rather than to a widespread desire to appear open-minded in the presence of an interviewer (i.e., Hawthorne effects).
Next, Hypothesis 1a drew on theories of strategic voting and suggested that all subjects would not be equally predisposed to ethnic voting, and all competitors would not be equally likely to attract non co-ethnic supporters. Subjects who are ethnic minorities in their relevant local areas should be less likely to support a co-ethnic candidate than members of larger groups will be, and competitors from larger or historically more powerful groups should be better positioned to attract the votes of non co-ethnics.
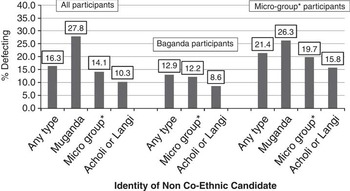
The results of the experiment tend to support Hypothesis 1a. Under the lowest-information condition, about one in six (16.2 per cent) subjects chose a non co-ethnic. Several patterns are notable: (1) Baganda subjects were less likely than others to defect, (2) members of smaller groups were generally more likely to defect than members of larger groups, and (3) subjects were more likely to defect to candidates from powerful groups than to candidates from more marginalized ones. In Figure 1, selected defection rates under the first condition, according to subject group and identity of the non co-ethnic candidate in the vignette construction, are presented.
Election 1 defections, by group, according to identity of non co-ethnic candidate *Any group with less than 5.0 per cent of the population in the LC4 of research. Banyankole excluded, even though they only comprise 2.7 per cent of the Bbaale population, because of their coding throughout the analysis as a ‘powerful’ group.

First, the data show significantly higher rates of defection among non-Baganda (24.8 per cent) than among Baganda (12.9 per cent) (z = 2.97, p < 0.001) in the first round. One possible explanation for this finding is that Baganda, as the largest group at both research locations, are generally under less pressure during elections to enter into coalitions behind non co-ethnic candidates. In Makindye, where Baganda comprise a majority (55.0 per cent) of the population, pure ethnic voting, assuming ethnic turnout rates proportional to their population distributions, would always elect a Muganda. In Bbaale, although Baganda comprise far less than a majority (20.7 per cent), their status as the largest group (the second largest is Basoga, with 15.9 per cent) makes it more likely that other groups would have to ally with a Muganda, rather than the other way around. In other words, in elections where ethnicity is the only salient factor, as under the first constructed condition, it would be a wise strategy for a Muganda to support a Muganda.
Next, members of groups that make up a very small (less than 5.0 per cent)Footnote 54 portion of the total population of their respective survey area were slightly more likely to defect (21.4 per cent) than members of groups that make up at least 15.0 per cent of the local population (14.0 per cent),Footnote 55 although the difference in proportions was not quite statistically significant (z = 1.55, p = 0.12).
Furthermore, not only did the identity of the subject matter, but the identity of the non co-ethnic in the contest seemed to make a difference. For example, non-Baganda whose co-ethnic faced a Muganda had a higher defection rate (27.8 per cent) than non-Baganda whose co-ethnic faced a non-Muganda (17.3 per cent), although this difference in proportions is not statistically significant (z = 1.14, p = 0.13). Additionally, members of those ‘micro’ groups were more likely to defect (25.9 per cent) when their co-ethnic faced a member of either of the two largest and most politically powerful groups in the country – a Muganda or a Munyankole – than when he faced a member of another micro group (19.7 per cent), although the sub-samples are too small for this difference to be statistically significant (z = 0.63, p = 0.52). Finally, subjects overall were significantly less likely to defect to an Acholi candidate (9.6 per cent, z = 2.32, p = 0.02) or a Langi (11.6 per cent, z = 1.79, p = 0.07) than to a Muganda; the Acholi and Langi groups are two of the most marginalized in all of Uganda.
These patterns suggest a possible dynamic in which members of smaller groups might have acted strategically in supporting a member of a more powerful group, such as a Muganda (the largest group nationally, and in both Makindye and Bbaale) or a Munyankole (the second-largest group nationally, and the group of President Museveni). In real-world elections, allying with a larger group, or groups, in order to maximize the probability of being in a winning coalition, is a better survival strategy for micro groups than pure ethnic voting.
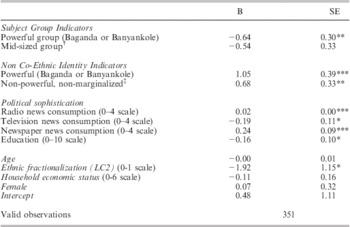
As a final test of Hypothesis 1a, I conducted logistic regression analysis in which the outcome variable – a subject's choice in the first election (supporting a co-ethnic vs. a non co-ethnic) – was regressed on a number of predictors, including dummies measuring subject membership in a ‘powerful group’ (i.e., Baganda or Banyankole), or a ‘mid-sized group’ (all groups representing at least 5 per cent of the relevant LC4 population, according to the 2002 Census, excluding Baganda and Banyankole). Here, the reference category is membership in a ‘micro group’. Additionally, dummies were included indicating that the randomly assigned non co-ethnic was a member of a powerful group (i.e., Baganda or Banyankole), or a non-powerful, yet non-especially marginalized group. The reference category here was the non co-ethnic competitor being an Acholi or Langi, which are arguably two of the most-marginalized groups under the current regime. Controls are included for subject age,Footnote 56 political sophistication (media consumptionFootnote 57 and educationFootnote 58), household wealth,Footnote 59 sex, and local-level ethnic fractionalization.Footnote 60
Results are presented in Table 2. As Hypothesis 1a predicts, membership in a ‘powerful group’ is associated with a statistically significant 16.0 per cent decrease in probability of defection in the first condition, vis-à-vis membership in a ‘micro group’. And vignette construction in which the non co-ethnic was a member of a powerful group was associated with a statistically significant 26.2 per cent increase in probability of defection in the first condition, vis-à-vis a construction in which the non co-ethnic candidate came from a marginalized group. In summary, while most subjects supported a co-ethnic in the low-information baseline election, there is evidence that some subjects might have been ‘voting’ strategically, by supporting a more viable non co-ethnic.
Determinants of Support for Non Co-Ethnic under First Condition

Notes: Dichotomized outcome variables are listed (1 = support for non co-ethnic). *Significant at 10%; **significant at 5%; ***significant at 1%. Clustered robust standard errors by enumeration area (the PSU). Valid observations total 351, because subjects that reported ‘don't know’ for any of the predictor variables were dropped. For subject group indicators, reference category is Micro Group. For vignette construction categories, reference group is Marginalized Group (i.e., Acholi or Langi). †>5.0%, not Baganda or Banyankole ‡Any group other than Baganda, Banyankole, Acholi or Langi.
Hypothesis 2: Ethnic Voting with Negative Co-Ethnic Information
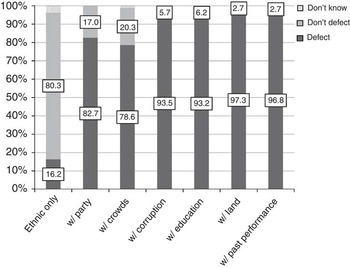
Under conditions depicting the co-ethnic negatively vis-à-vis the non co-ethnic, support for the co-ethnic declined significantly, thus supporting Hypothesis 2. Here, I discuss subject support for co-ethnics under the party, popularity, corruption, education, issue and performance treatments, before dealing separately with the treatment involving the distribution of goods, due to special considerations. On average, an individual supported a non co-ethnic under 79.7 per cent of the first seven conditions (i.e., all treatments, excluding the distribution of goods treatment, which is discussed separately). Excluding the lowest-information condition, that rate jumps to 89.9 per cent. In other words, the average treatment effect of exposure to negative information about co-ethnics was to raise the defection rate from 16.2 per cent to 89.9 per cent.
Subjects’ preferences for candidates are presented in Figure 2. Orthogonal contrasts between the lowest-information condition and each of the subsequent treatment conditions are all statistically significant.Footnote 61 Multiple analysis of variance (MANOVA) yields an F statistic of 39.96 (p ⩽ 0.001), suggesting we can reject the null hypothesis of no significant difference in preferences towards co-ethnic candidates across treatments.
Subject preferences, with ethnic cues Note: Valid percentages for the party treatment are reported, excluding those subjects who were not asked the question because they self-identified as non-partisans.

Vast majorities of those who were loyal to co-ethnics in the baseline (N = 297) defected under every subsequent condition: 81.7 per cent on party, 77.6 per cent on crowds, 94.2 per cent on corruption, 93.6 per cent on education, 97.0 per cent on land use, and 97.6 per cent on performance. In this sub-group, orthogonal contrasts between the baseline and each of the treatment conditions are all statistically significant at the 0.01 level.Footnote 62 In fact, only two people (0.5 per cent) refused to defect from their co-ethnic under any circumstance. At least in this experimental setting, Ugandan citizens showed tremendous willingness to cross ethnic lines to vote for a candidate who shared their party preference or position on land use, or was more popular, scrupulous, educated or competent than their co-ethnic.Footnote 63
Special Case: Ethnic Voting and Goods Distribution
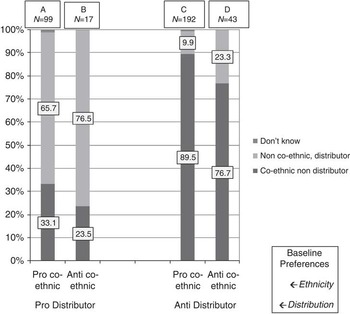
The final treatment involved testing ethnic and distributional cues simultaneously. As discussed previously, voters might draw conclusions about competitors’ capabilities, preferences and viability by observing what competitors do (or do not) distribute, and to whom. Following Hypothesis 2, if this information suggests that a non co-ethnic is more capable of distribution, more in favour of distributional practices that would benefit the voter, or is more electorally viable, vis-à-vis a co-ethnic competitor, we should expect that support for the co-ethnic will suffer. However, due to the apparently ambiguous conclusions subjects draw about goods distribution, the findings here (presented in Figure 3) merit separate discussion.
Preferences for simultaneous ethnic and distributional cues

Prior to the treatment that exposed subjects to ethnic and distributional cues simultaneously, subjects were asked to respond to a vignette about an election in which there were two candidates: one known for distributing bags of sugar at his rallies, the other known for distributing nothing. This was the only piece of distinguishing information provided about the candidates. I refer to this condition as the baseline distributional treatment. Here, nearly two-thirds (65.4 per cent) of subjects did not support the distributing candidate.
This result was not anticipated. Most of the subjects rejected the distributing candidate, even though such campaign-time distributions are common in Uganda. There are three possible reasons for this. First, while one third of the subjects indicated support for the goods distributor, others might have viewed goods distribution as normatively wrong. Secondly, some subjects might have equated distribution with corruption; distributable resources must come from somewhere, after all.Footnote 64 Finally, some subjects who might support distributors in the privacy of the polling station might have been uncomfortable admitting that they would do so in front of an interviewer. While the ubiquity of such practices suggests that it is not an extreme taboo in Uganda, some subjects might not have wanted it to appear that their vote could be purchased. No matter the reason, we can still draw interesting conclusions from the results of this treatment.
Fortuitously, the design here does allow, in some instances, for a measure of something not feasible under the other treatments: support for co-ethnics in situations in which positive information about co-ethnics and negative information about non co-ethnics is provided.Footnote 65 Those individuals who had indicated support for a non-distributor in the distribution baseline (i.e., ‘anti-distributors’) received (ostensibly) positive information about co-ethnics in the simultaneous treatment. Among those anti-distributors who had supported a co-ethnic in the baseline (N = 192; Column C, Figure 3), it is not surprising that, with further positive information about co-ethnics, almost everyone (89.5 per cent) continued to support a non-distributing co-ethnic under the simultaneous treatment.
However, for those anti-distributors who had ‘defected’ from their co-ethnic in the ethnic baseline condition (N = 43; Column D, Figure 3), over three-quarters (76.7 per cent) supported the co-ethnic, non-distributor in this treatment. This suggests that ‘positive’ information about a co-ethnic can result in increased support for co-ethnic candidates, at least among individuals who had not shown a strong inclination towards ethnic voting under the lowest-information setting.
For those individuals who had, under the distribution baseline, indicated support for the distributing candidate (i.e., ‘pro-distributors’), the simultaneous treatment mimicked the design of the other cross-pressuring treatments, in that (ostensibly) negative information was provided about co-ethnics, and positive information about non co-ethnics. Amongst those pro-distributors who had also supported a co-ethnic under the ethnic baseline (N = 99; Column A, Figure 3), nearly two-thirds (65.7 per cent) supported the non co-ethnic distributor under the simultaneous treatment. In other words, distributional considerations seemed to trump co-ethnicity here, suggesting that distribution could be a viable strategy for winning non co-ethnic supporters, if distributors can identify populations that look kindly upon such campaign activities. Amongst all pro-distributors, over two-thirds (67.2 per cent) supported the distributing non co-ethnic, over the non-distributing co-ethnic.Footnote 66
A Real-World Application
Certainly, external validity is a concern with the growing popularity of survey experiments.Footnote 67 With regards to this research, perhaps most obviously, it is problematic to conclude that the subject–research interaction and the stimuli applied fully approximate how subjects would act in real-world settings. ‘Voting’ against a co-ethnic in a survey is different from doing so in a real-world election, where community pressures might be overwhelming, and possible punishments for defection severe. Furthermore, the stark construction of the vignettes here, with the co-ethnic always being portrayed purely negatively and the non co-ethnic always purely positively,Footnote 68 particularly raises such concerns, since such clear-cut differences between candidates on certain dimensions are often not present. While the construction of the vignettes in this way biases results in favour of confirming the hypotheses, since this is the first research into these questions in Africa of which I am aware, it was more appropriate to risk Type I than Type II errors and, therefore, possibly close off an area of potentially fruitful future research.
In an attempt to address these concerns, I focus here on a real-world case that closely approximates the experimental design – namely, an election in an ethnically heterogeneous district, between candidates representing different ethnic groups, in which available mass media present information about one candidate that is decidedly negative, in comparison to challengers. If the theory is correct, we should see that, for a group with a negatively portrayed co-ethnic in the race, increased access to those mass media should be associated with decreased support for that co-ethnic, and increased support for a more positively portrayed non co-ethnic. In other words, the negatively portrayed co-ethnic should draw lower support from his or her own ethnic group in areas where access to mass media is high, but higher support in areas where it is low (i.e., where voters rely more exclusively on the cues that ethnicity provides).
Electoral cases that meet all of the previously enumerated criteria – particularly that of an overwhelmingly negative informational context for one major candidate, given increased media pluralism – are somewhat sparse, particularly if we limit ourselves to Uganda. However, the 2006 parliamentary election in the constituency of Soroti, a rural county near the shores of Lake Kyoga, in Uganda's Eastern Region, seems an appropriate test case. First, the electorate is ethnically heterogeneous: according to the 2002 Census, the population was 69.1 per cent Iteso and 29.1 per cent Kumam. Secondly, its parliamentary elections in 2006 reflected this diversity to some degree – two of the candidates were Kumam, while two were Iteso.
Finally, the mass media environment in 2006 was uniformly negative towards at least one candidate: Samuel Anyolo, the incumbent. Although Anyolo had ascended to Parliament by defeating the incumbent, Col. William Omaria Lo Arapai, in 2001, the local media environment was decidedly hostile to his re-election efforts five years later. Radio is overwhelmingly the most important mass medium in Soroti County; the 2002 Census reported that 39.9 per cent of households relied on radio as their primary source of news, while 59.5 per cent relied on word of mouth.Footnote 69 And local radio was not particularly kind to Anyolo in the run up to the 2006 election. On top of being the subject of numerous media reports about problems with the law, including his alleged involvement in a 2005 shooting at a local bar, Anyolo was unlikely to have received favourable coverage from any of three then-extant local radio stations. Two – the local outlet of the state-run Uganda Broadcasting Corporation (UBC) and the NRM-supporting Voice of TesoFootnote 70 – were not friendly to an Anyolo re-election, since the member, a former pro-Museveni stalwart, left the ruling party to run as an independent. And the opposition-leaning Kyoga Veritas FM has provided a more favourable venue to FDC candidates, such as the ultimate victor, Peter Omolo.Footnote 71 Ultimately, Anyolo saw his vote share decline precipitously, from the 33 per cent he had claimed in 2001, to just 15 per cent.
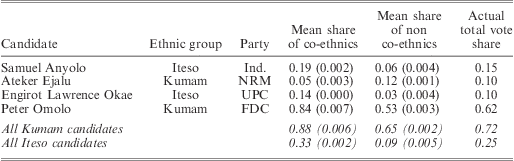
If the theory is correct, we should expect that the likelihood that Iteso would vote for the incumbent, a co-ethnic, would decline with increasing media access. In order to estimate the relationship between radio access (i.e., exposure to negative information about Anyolo) and support for him by ethnic group, I first use Gary King's ecological inference (EI) methodFootnote 72 to obtain point estimates of the share of co-ethnics and non co-ethnics voting for each candidate at each polling station in Soroti County (N = 102 in 2006).Footnote 73 The estimated means, weighted for the number of votes cast per polling station, for each candidate are reported in Table 3. The EI algorithm estimates the means of Iteso and non-Iteso (i.e., mostly Kumam) support for Anyolo in 2006 as 0.19 (SD = 0.002) and 0.06 (SD = 0.004), respectively. These were down significantly from 2001, when mean Iteso support was estimated at 0.39 (SD = 0.003) and non-Iteso support at 0.18 (SD = 0.007) (N = 96 polling stations).
Estimated Weighted Mean Shares of Co-Ethnic and Non Co-Ethnic Support for 2006 Soroti County Parliamentary Candidates
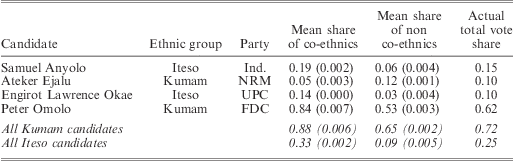
Notes: N = 102 polling stations. Means weighted by number of votes cast per polling station. Standard deviations in parentheses.
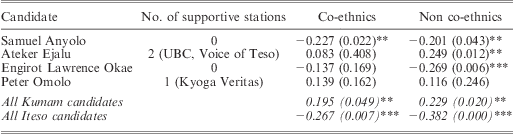
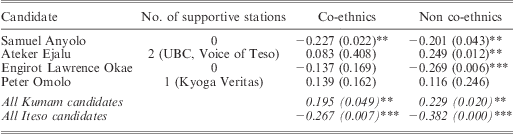
Table 4 reports correlations between the prevalence of radio reliance in an area and estimates of co-ethnics’ and non co-ethnics’ support of 2006 candidates by polling station.Footnote 74 Support for Anyolo in his re-election campaign seems to have been contingent upon the prevalence of radio reliance in an area. The point estimates for Iteso support for Anyolo and radio reliance measures were negatively and significantly correlated (r = −0.227, p = 0.022), suggesting that Anyolo performed better amongst co-ethnics who had less exposure to negative information about him, as the theory would suggest. In areas where less than 40 per cent of households relied on radio (N = 53), the mean estimate of Anyolo's share of the Iteso vote was 0.26 (SD = 0.189), while in areas where prevalence exceeded 40 per cent (N = 49), it was significantly lower, at 0.17 (SD = 0.204). In contrast, Anyolo's support amongst fellow Iteso was not significantly correlated with radio prevalence in 2001 (r = −0.129, p = 0.212), when, as one of several Museveni supporters in the race,Footnote 75 he was less likely to have received negative coverage from the only two then-operating radio stations: UBC and Voice of Teso.Footnote 76
Correlations between Estimated Support for Candidates, by Ethnic Category, and Radio Prevalence (2006 Soroti County Parliamentary Election)
Notes: * Significant at 10%; ** significant at 5%; *** significant at 1%. N = 102 polling stations. P values in parentheses.
Certainly, many of these Iteso might have supported another Etesot, in Engirot Lawrence Okae of the UPC, but the fact that he, as a UPC member, was unlikely to have received favourable media coverage also seems to have harmed him. Indeed, there is a negative correlation between Iteso support for Okae and radio reliance (r = −0.137, p = 0.169), but one that falls short of statistical significance. In general, among Iteso, there is negative and significant correlation between radio reliance and voting for any Iteso candidate (r = −0.267, p = 0.007).Footnote 77
In contrast to Anyolo and Okae, the two Kumam candidates in the race enjoyed, on average, more favourable coverage during the campaign, although neither received universal radio support. NRM candidate Ateker Ejalu is likely to have benefited from the UBC and Voice of Teso, and Omolo from Kyoga Veritas. This comparatively positive coverage seems to be associated with increased Iteso support: as radio reliance increased, Kumam candidates’ support from non co-ethnics increased (r = 0.229, p = 0.020).
In sum, the 2006 parliamentary race in Soroti is supportive of the informational theory of ethnic voting tested in the survey experiment, in that Iteso candidates’ performance among co-ethnics suffered significantly as exposure to negative information about them increased. Iteso voters living in areas with higher reliance on radio were significantly more likely than their counterparts with less mass media reliance to support a Kumam candidate. In this case, then, comparatively negative information about co-ethnics does seem to have resulted in decreased ethnic voting, at least among Iteso. Finally, the Soroti case suggests that it is not media access per se that is associated with a diminution of ethnic voting – radio reliance was positively associated with support from co-ethnic candidates amongst Kumams – but the provision of comparatively negative information about co-ethnics.
Conclusions
Many existing theories of ethnic voting suggest that at least part of the political salience of identity is attributable to the information that group cues provide. However, little research has been done on whether the apparent utility of ethnic cues would vary depending on broader informational contexts. In other words, would ethnic voting decline when higher-quality types of information about electoral competitors were present? This project represents an attempt to begin to fill that lacuna.
Generally speaking, the results of the experiment – and the examination of the Soroti County 2006 parliamentary election – were supportive of the hypothesized relationship between information availability and ethnic voting. In the experiment, support for co-ethnic candidates was quite high under the lowest-information condition, suggesting that, in situations of extreme information scarcity, voters will rely heavily on ethnic cues. However, the analyses here indicate that voters are not uniform in their responses to ethnic cues in low-information environments. Subjects were more likely to support a non co-ethnic, even under the lowest-information condition, when they were from smaller ethnic groups themselves, or when the non co-ethnic was from a more powerful group. These findings suggest that there is some strategic element involved in much ethnic voting, and they support the arguments of foundational works by Chandra and Posner in this field.
The experimental findings also suggest that rates of support for co-ethnics diminished quite significantly from the baseline, when information that presented co-ethnics negatively and non co-ethnics positively was presented. Under those treatments, support for non co-ethnics was high: ranging from 67.2 per cent under the distribution treatment (among pro-distributors) to 97.3 per cent under the policy treatment. Furthermore, in the single instance in which comparatively positive information about co-ethnics was presented (to anti-distributors, under the simultaneous treatment), those who had earlier indicated a predisposition towards supporting a non co-ethnic significantly shifted to their co-ethnic.
The sum of this research, when considered alongside work by Chandra, Posner, Birnir, Ferree, and others, leans against the assertions of social-psychological theories, which do not allow for rates of support for co-ethnics to vary according to informational context. To be sure, it is likely that many voters derive some increased esteem or psychological satisfaction from seeing a co-ethnic in office, or voting for one. However, this research suggests that many voters determine that other expected gains – a more competent government or preferable policy enactments – exceed these more intangible benefits.
This article contributes to the informational alternative to social-psychological theories by testing the relationship between informational context and ethnic voting more directly than has been done previously. Future research could involve the construction of conditions in which, say, positive or negative information on one topic was presented about one candidate, but no information on that topic about another.Footnote 78 Also, all subjects received ethnic cues in all rounds – this is realistic, since a candidate's ethnicity is probably the most freely available fact about him or her. However, an alternative design, in which subjects received information about, say, party identity in all rounds, with an ethnic cue appearing in only one, would allow an examination of whether co-ethnicity, in essence, dampens the effect of something else.Footnote 79 Myriad questions, many deserving of attention, could not be answered with this design.
The full implications of the findings here are unclear. Africa's media landscape is changing quickly and significantly,Footnote 80 and these developments are bringing with them associated changes in the cost of various types of political information about electoral competitors. However, we cannot be overly sanguine about the results here and conclude, on their basis, that media development in Africa will result in the death of ethnic politics. We cannot completely discount the external and internal validity limitations associated with experimental work, and we cannot expect that further development of information-distributing media, particularly FM radio, in Uganda will quickly or completely remove the influence of ethnic schisms that have cast a shadow over politics there for many years. However, the results do offer early evidence that some of the pernicious and seemingly inescapable problems of ethnic-based politics in Africa could potentially be mitigated, even if they are not likely to be eliminated, by increasingly cheap, open and diverse information about politics.
Appendix A: Survey procedures
The survey was conducted over a nine-day period in mid-January 2008, by nine research assistants, with subjects selected via area probability (‘cluster’) sampling.
Site Selection
Two administrative units one level below the district – a division (Kampala), and a county (rest of the country) – were selected for the project. Makindye Division in Kampala District was chosen through consultation with the research staff, and using data on standard of living and educational levels from the 2002 Census. We wanted to select a division that had a population roughly similar on these counts to other urban areas in Kampala and the rest of the country. Next, the rural county of Bbaale, in the District of Kayunga, was chosen at random from the 163 counties listed in the 2002 Census, after a number of counties were excluded because of an inability to fit the following criteria: (1) assurance of physical security to researchers and subjects; and (2) non-existence of large populations of refugees, the internally displaced and persons facing dangerous levels of economic marginalization, who could be categorized as ‘vulnerable’. This list of eligible counties was further winnowed by excluding those in which the percentage of people who are literate, rely mostly on the radio for information and have a roof made of iron sheeting was not within one standard deviation of the national average (data from 2002 Census). Finally, municipal areas were not eligible, since the goal was that the second research site should be rural. After these eliminations, fifty-six counties remained, from which Bbaale County was chosen using a random-number generator. From each of these two areas, nine enumeration areas (EAs) were chosen. EAs were delineated by the Uganda Bureau of Statistics for use in the 2002 Census. From a list of all EAs in each area, ‘interval sampling,’ which selects units proportional to their population size, was used to select nine in each.
Subject Selection
Each team consisted of three to five members, and two or three teams visited a different EA each day. Households were selected via a random-walk pattern, in which enumerators selected every fifth domicile on their right to attempt an interview.Footnote 81 Upon selecting a household, the enumerator, with the assistance of a resident, made a list of all eligible subjects currently at the site.Footnote 82 The enumerator then randomly selected an individual from that list to interview.
Surveys were administered in English or Luganda, depending on the subject's comfort level. After completion, subjects were compensated with 5,000 Ugandan shillings, or just under US$3. Of those approached who were eligible to participate, 86.9 per cent consented and successfully completed the survey.
Appendix B: Vignettes
First Condition: Ethnic Cues Only
In the first election, two people are running to be LC3 chairperson. Candidate A has lived in this LC3 since birth. He is a member of the [randomly chosen group] ethnic group. Candidate B was born in this LC3 and has lived here ever since. He is a member of the [subject's group] ethnic group. Which of these two candidates, A or B, would you vote for in this election?
Second Condition: Party ID, with Ethnic Cues
Candidate A is a member of the [if subject is Movement supporter, FDC; if subject supports any party other than the Movement, Movement] party. He is an ethnic [subject's group]. Candidate B is a member of the [subject's party]. He is an ethnic [randomly chosen group]. Which of these two candidates, A or B, would you vote for in this election?
Third Condition: Crowd Size, with Ethnic Cues
Candidate A recently held a political meeting, where he made a speech and encouraged people to vote for him in the next election. However, only about fifty people attended the rally, and most of those people were not from this area. He is a member of the [subject's group] group. Candidate B recently held a political meeting, where he urged people to turn out to vote for him in the next election. The crowd there was large – over 400 people from the local area came to see him speak. He identifies as an ethnic [randomly chosen group]. Which of these two candidates, A or B, would you vote for in this election?
Fourth Condition: Corruption, with Ethnic Cues
For many years, Candidate A has held a position as an LC1 representative. A local NGO recently ran radio advertisements praising him for his honesty as an elected official. He is ethnically [randomly chosen group]. Candidate B has been involved in local politics for years, but it is widely known that he has taken millions of shillings from the local coffers and distributed it to his family and political supporters. He is ethnically [subject's group]. Which of these two candidates, A or B, would you vote for in this election?
Fifth Condition: Education, with Ethnic Cues
Candidate A has attended public schools in Uganda for four years, but did not complete his primary education. He cannot read or write. He is a member of the [subject's group] ethnic group. Candidate B has a Master's Degree in Public Administration and Management from Makerere University. He is a member of the [randomly chosen group] ethnic group. Which of these two candidates, A or B, would you vote for in this election?
Sixth Condition: Land-Use Position, with Ethnic Cues
If subject was pro-clearing
Candidate A, in a recent speech, said that protected forests must not be cleared for any purpose, since they are important for environmental reasons, and that they certainly should never be sold to non-Ugandan companies. He is an ethnic [subject's group]. Candidate B, in a recent speech, said that the government has a right and duty to produce land for agriculture in Uganda, even if it means clearing protected forests for use by foreign companies. He is an ethnic [randomly chosen group]. Which of these two candidates, A or B, would you vote for in this election?
If subject was anti-clearing
Candidate A, in a recent speech, said that the government has a right and duty to produce land for agriculture in Uganda, even if it means clearing protected forests for use by foreign companies. He is an ethnic [subject's group]. Candidate B, in a recent speech, said that protected forests must not be cleared for any purposes, since they are important for environmental reasons, and that they certainly should never be sold to non-Ugandan companies. He is an ethnic [randomly chosen group]. Which of these two candidates, A or B, would you vote for in this election?
Seventh Condition: Past Performance, with Ethnic Cues
Candidate A has been elected to be a nearby LC1 chairperson twice before. A recent study by a local radio journalist found that, during his time in office, there was a decrease in crime, the number of infant deaths dropped and attendance at community meetings nearly doubled. He is a member of the [randomly chosen group] ethnic group. Candidate B has twice been elected to be chairperson of a nearby LC1. According to a report on a local radio station, during his time in office there was a large increase in reported burglaries, health programmes for children were cut back and most people stopped attending community meetings. He is a member of the [subject's group] ethnic group. Which of these two candidates, A or B, would you vote for in this election?
Eighth Condition: Sugar Distribution Cues Only
Candidate A, during his campaign, handed out bags of sugar to people who came to his rallies and parades, as candidates often do during the run-up to an election. Candidate B has held many campaign events, but those who have attended have said that his people have not distributed any free items there, as candidates often do during the run-up to an election. Which of these two candidates, A or B, would you vote for in this election?
Ninth Condition: Ethnic Cues and Sugar Distribution Cues
Candidate A is a member of the [randomly chosen group] ethnic group. He has had a rally in the area recently, where his supporters handed out a bag of sugar to everyone who attended. Candidate B is a member of the [subject's group] ethnic group. He had a rally nearby recently, but no items were given out to those who attended. Which of these two candidates, A or B, would you vote for in this election?