


Introduction
Recent developments in glacier-flow modelling have highlighted the necessity of including ice liquid-water content within the model input parameters (Reference Hubbard, Hubbard, Mader, Tison, Grust and NienowHubbard and others, 2003; Reference Chandler, Hubbard, Hubbard, Murray and RippinChandler and others, 2008). This is because the presence of free water at the intergranular scale greatly softens temperate glacier ice and, consequently, strongly increases its deformation rate (Reference DuvalDuval, 1977). Since direct sampling of ice water content is logistically challenging, and often fails to correctly reproduce a sample’s boundary conditions (e.g. temperature and confining pressure), efforts have been made recently (Reference Barrett, Murray and ClarkBarrett and others, 2007; Reference Murray, Booth and RippinMurray and others, 2007; Reference Gusmeroli, Murray, Barrett, Clark and BoothGusmeroli and others, 2008; Reference Bradford, Nichols, Mikesell and HarperBradford and others, 2009; Reference Endres, Murray, Booth and WestEndres and others, 2009) to constrain ice water content using in situ geophysical techniques.
The vast majority of published works on glacier ice water content consider the influence that water content has on the propagation speed of geophysical signals such as electromagnetic (Reference Macheret, Moskalevsky and VasilenkoMacheret and others, 1993; Reference Murray, Stuart, Fry, Gamble and CrabtreeMurray and others, 2000; Reference Bradford and HarperBradford and Harper, 2005) and elastic (Reference Benjumea, Macheret, Navarro and TeixidóBenjumea and others, 2003; Reference Navarro, Macheret and BenjumeaNavarro and others, 2005) waves. Reference Endres, Murray, Booth and WestEndres and others (2009) showed that by jointly inverting spatially coincident radar and seismic wave speeds it is possible to obtain physically consistent water-content and pore geometry estimates for a two-phase (ice/water) medium. However, since air bodies in the form of bubbles, englacial voids and fractures are commonly observed in glaciers (Reference PohjolaPohjola, 1994), this interpretation is non-unique (Reference Bradford and HarperBradford and Harper, 2005; Reference Gusmeroli, Murray, Barrett, Clark and BoothGusmeroli and others, 2008). A three-phase model should be considered in order to estimate the volumetric content and geometry of both air and water inclusions within glacier ice. As an example, relatively high electromagnetic (and low seismic) speeds could be indicative of either dry, bubble-free or wet, bubbly glacier ice.
A few workers (Reference Macheret and GlazovskyMacheret and Glazovsky, 2000; Reference Bradford, Nichols, Mikesell and HarperBradford and others, 2009) include the presence of air bubbles in their water-content estimates. However, since these procedures do not consider electromagnetic wave speed being influenced by air-rich features (e.g. fractures and englacial voids), it is desirable that additional parameters, other than speed, are included in the analysis to obtain more reliable water-content estimates. These parameters, rarely measured in glaciers, are radar and seismic attenuation (Reference Endres, Murray, Booth and WestEndres and others, 2009); the combined use of radar and seismic speeds with corresponding attenuations would provide sufficient parameters to estimate the volumetric content and geometry of both air and water inclusions within glacier ice. In fact, since propagation properties (speed and attenuation) of geophysical signals are sensitive to water, four independent parameters, jointly inverted, (instead of two) clearly add to the aim of describing glacier-ice properties using radar and seismic surveys.
Furthermore, values of seismic attenuation are routinely used when exploring subglacial properties using seismic surveys (Reference SmithSmith, 1997, Reference Smith2007; Reference King, Smith, Murray and StuartKing and others, 2008; Reference Peters, Anandakrishnan, Holland, Horgan, Blankenship and VoigtPeters and others, 2008), and uncertainties in these values often constitute limitations in the techniques used to derive bed properties (Reference SmithSmith, 2007). Here we apply current methods from hydrocarbon exploration (Reference TonnTonn, 1991; Reference Dasgupta and ClarkDasgupta and Clark, 1998) to estimate P-wave seismic attenuation within the polythermal glacier Storglaciären, Swedish Lapland, and hence demonstrate a methodology which can form the basis for future development in this important and rarely explored aspect of seismic-wave propagation in glaciers.
The seismic quality factor, Q
The attenuation of seismic energy is usually quantified using the non-dimensional seismic quality factor, Q, or its inverse, Q − 1, the internal friction. Q is a fundamental property of rocks and Earth materials, and is defined by the fractional energy loss per cycle experienced by a propagating seismic wave (Reference KnopoffKnopoff, 1964; Reference Toksöz and JohnstonToksöz and Johnston, 1981; Reference Sheriff and GeldartSheriff and Geldart, 1995). High Q values (500–1000) are expected for non-attenuative materials such as massive crystalline rocks, and low Q values (10–100) are typical for attenuative materials such as porous and/or fractured rocks. There are many definitions of Q in the seismological literature; in this study we use the one provided by Reference Aki and RichardsAki and Richards (2002), the definition typically used in glaciological studies (e.g. Reference Clee, Savage and NeaveClee and others, 1969; Reference Bentley and KohnenBentley and Kohnen, 1976):

where f, v and α are frequency, propagation speed and attenuation coefficient, respectively. Q values in frozen rocks are very much higher than those observed in unfrozen rocks (Reference Spetzler and AndersonSpetzler and Anderson, 1968; Reference Toksöz, Johnston and TimurToksöz and others, 1979). The degree of water saturation also influences seismic attenuation. In some cases, Q values are known to be similar for dry and fully saturated materials but are significantly lower for partial degrees of saturation (Reference Winkler and NurWinkler and Nur, 1982); in fact, partial saturation allows space for fluid squirt-flow (pressure-induced, intragranular fluid flow) between and within fractures, microcracks on grain surfaces, and pore spaces (Reference Toms, Mller and GurevichToms and others, 2007).
Only a few measurements of seismic attenuation are available in the glaciological literature. Comprehensive reviews of seismic-attenuation studies in polar ice are provided by Reference SmithSmith (1997, Reference Smith2007). Some workers measure seismic attenuation using time-domain analysis of α (Reference RobinRobin, 1958; Reference WestphalWestphal, 1965; Reference Jarvis and KingJarvis and King, 1993), whereas others (Reference Clee, Savage and NeaveClee and others, 1969; Reference Bentley and KohnenBentley and Kohnen, 1976) use Q− 1. The results of this prior research show that the P-wave quality factor, Q P, is generally higher for cold ice (Q P ∼500–1700 at Byrd Station, Antarctica; Reference Bentley and KohnenBentley and Kohnen, 1976) than for temperate ice (Q P ∼ 65 at Athabasca Glacier, Canada; Reference Clee, Savage and NeaveClee and others, 1969). This evidence is also supported by Reference KuroiwaKuroiwa (1964), who conducted laboratory measurements of the internal friction in natural polycrystalline glacier ice. He observed that Q P increases (attenuation decreases) from low values (Q P ∼ 40) near the melting point to very high values (Q P up to 1000) around −30°C. Despite this, it is very difficult to obtain a clear range of Q P estimates in glacier ice, since previous workers measure attenuation over different frequency ranges, using different methods, different equations and different assumptions. Table 1 shows a compilation of previous Q P estimates (in some cases recalculated) from different glaciological settings.
Examples of Q P estimates in polar and alpine ice masses from previous studies. FD and FI indicate frequency-dependent (FD) and frequency-independent (FI) Q and α

In situ Q P estimates are always made as effective attenuation, 1/Q eff, in the medium. These values are controlled by intrinsic effects (e.g. material properties) and also by apparent attenuation processes (e.g. scattering from inclusions, heterogeneities, rough interfaces and/or interference between direct arrivals and short-path multiples). Effective attenuation is related to intrinsic (1/Q int) and apparent (1/Q app) attenuation by (Reference Spencer, Sonnad and ButlerSpencer and others, 1982):

Modelling (Reference Dvorkin and NurDvorkin and Nur, 1993) and observations (Reference Sams, Neep, Worthington and KingSams and others, 1997) of attenuation mechanisms show that seismic Q is frequency-dependent when considered over several orders of magnitude (e.g. 10−3 to 104 Hz). However, other studies suggest that the frequency dependence is negligible (Reference Johnston, Toksöz and TimurJohnston and others, 1979). Here we apply the frequently used concept of frequency-independent Q (Reference MitchellMitchell, 1975; Reference Johnston, Toksöz and TimurJohnston and others, 1979; Reference KjartanssonKjartansson, 1979; Reference Dasgupta and ClarkDasgupta and Clark, 1998; Reference Xia, Miller, Park and TianXia and others, 2002; Reference WangWang, 2003; Reference Reine, van der Baan and ClarkReine and others, 2009), and our Q estimates are assumed to be constant within the measurement bandwidth.
Methods
Seismic attenuation and the spectral-ratio method
Following the fundamental principles that control seismic-wave attenuation and dispersion (Reference FuttermanFutterman, 1962) for the specific case of frequency-independent Q, we can describe the change in amplitude spectrum from A 0 to A 1 after travelling a distance, x, using the frequency-dependent attenuation coefficient, α (Reference Aki and RichardsAki and Richards, 2002):

where G and R are, respectively, the geometric spreading factor and the energy partitioning at interfaces (when the wave crosses a boundary between two media); these two terms are treated as frequency-independent. Considering Equation (1), Equation (3) becomes:

This equation provides the theoretical basis of the spectral-ratio method, a popular method of obtaining frequency-independent Q estimates from field datasets, such as vertical seismic profiles (Reference TonnTonn, 1991; Reference WangWang, 2003) and surface-reflection surveys (Reference Dasgupta and ClarkDasgupta and Clark, 1998; Reference Reine, van der Baan and ClarkReine and others, 2009).
Equation (4) implies higher frequencies are preferentially attenuated. In this instance, the natural logarithm of the ratio between the attenuated and non-attenuated amplitude is (for constant Q and v) a linear function of frequency (Reference TonnTonn, 1991):

where c is ln(GR) and contains all frequency-independent terms. Equation (5) shows ln(A 1 /A 0) is linear in frequency, with a slope, γ, given by:

In typical experimental settings, the wavelet is sampled at two locations separated by a distance δx, and γ is converted to Q for the given δt = δx/v. When many pairs of attenuated signals are available, with a range of travel-time differences, all of them sampling a volume considered to be characterized by a single Q, this Q can be derived from a linear regression of spectral-ratio slope, γ, against δt (which is directly estimated from the travel times):

where m is the slope of the regression line. Assuming constant Q within the medium, a more robust result can be derived by sampling the waves at a higher number of locations; we exploit this intensive sampling approach here.
Field experiment
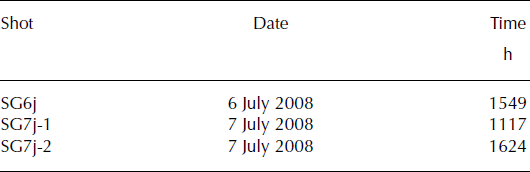
In July 2008 we conducted seismic surveys in the ablation area of Storglaciären (Fig. 1), a well-studied polythermal glacier located in Swedish Lapland. The ablation zone of the glacier has a cold-ice surface layer above a temperate core (Reference Holmlund and ErikssonHolmlund and Eriksson, 1989; Reference Pettersson, Jansson and HolmlundPettersson and others, 2003). At the time of the survey the glacier was snow-free and the seismic line was located near a thermistor string which provided temperature data in the uppermost 28 m of ice. Data were acquired using a hammer-and-plate source, and the receivers (24 geophones at 100 Hz) were positioned along a 115 m line, transverse to glacier flow, with 5 m spacing (see Fig. 1 for location and survey geometry). The distance between the source and closest geophone was 5 m. The seismic line (see Fig. 2 for data example) was repeated over 2 days at different times in order to detect any temporal variation (see Table 2 for details of the surveys).
(a) Location of the seismic line at Storglaciären (67°90′ N, 18°57′ E). Surface elevation in metres above sea level. (b) Schematic of the survey. The black circle indicates the shot position; white and filled squares indicate unused and used geophones, respectively. The arrow indicates the direction of the P-wave sampled. The circled geophone, located at 15 m from the source, was used as the reference arrival in the analysis (A 0 in Equation (5)).

Example of unprocessed seismograms used in the computation of Q P. (a) Sample data from Storglaciären; the first arrivals are refractions propagating through the uppermost ice. (b) Extracted wavelet at 40 m offset.

Details of the seismic surveys used in the Q P analysis at Storglaciären
We undertook seismic-attenuation analyses on refractions travelling in the uppermost ice layer. Examples of the consecutive processing steps used are given in Figure 3. From each arrival we manually extracted the first cycle of the wavelet using a cosine-tapered time window with a plateau from the first break of the arrival to its second subsequent zero crossing (Fig. 2b). The full window length (Fig. 3a) used to obtain the Fourier spectra (Fig. 3b) included a taper before and after the plateau; the length of the taper was 10% of the length of the first cycle. The natural logarithms of the spectral ratios (e.g. Figs 3c and 4) between the reference wavelet (arbitrarily picked as 15 m offset from the source; Fig. 1b) and the arrivals recorded at 15 subsequent geophones were then computed and plotted as a function of frequency to derive the slope of the ln(spectral ratio), γ, which, according to Equation (6), is a function of Q and the travel time between the two arrivals. Longer offsets showed poor signal-to-noise ratios, so were not used.
(a) Examples of the time windows used to perform the spectral analysis for 25, 50 and 75 m offsets (solid, dashed and dotted curves, respectively). (b) Fourier spectra in the bandwidth 0–600 Hz of the three sample arrivals. (c) Natural logarithm of the spectral ratio in the bandwidth 100–200 Hz for the pairs of offsets 75/25, 50/25 and 75/50 m (solid, dashed and dotted curves, respectively).

Representative examples of spectral ratios for different receiver separation, δx. (a) δx = 25 m, δt = 0.007 s; (b) δx = 50 m, δt = 0.014 s; (c) δx = 75 m, δt = 0.021 s.

In this process, the selection of the bandwidth is critical, since the spectral ratios are representative of Q only in the region of the spectra where there is energy. In our data we chose to derive Q in a bandwidth of 100–300 Hz, where the energy spectrum is highest even for far-offset arrivals (Fig. 3b). As shown in Figure 3b, the spectrum for the longest offset considered (75 m) is mostly concentrated in this bandwidth and decreases rapidly at frequencies higher than 300 Hz.
Results
The key parameter used in the determination of Q P is γ, the slope of the regression line which relates the linear decay to the frequency of the spectral ratios between two arrivals separated by travel time, δt (Equations (5) and (6)). Errors in our γ estimates are typically low, since the correlation between ln(spectral ratio) and frequency is generally good (Figs 3c and 4). Deviations from a linear relationship in the spectral ratios provide evidence of frequency dependence of Q P, which is discussed below. Figure 5 shows how γ decreases in the three shots as δt increases; this behaviour is a function of Q P. General agreement between the three shots is observed. Assuming constant attenuation along the seismic line and simply fitting a straight line to the γ vs δt pairs, in all three experiments we obtain a similar mean m (Equation (7)), which corresponds to Q P = 6 ± 1 (Fig. 5a).
Plots of γ vs δt used in the Q P estimates at Storglaciären. (a) Results for the three shots. The solid line indicates the best straight-fit line obtained from the mean m in the three shots, which gives Q P = 6 ± 1. The area marked in grey is bounded by two straight lines describing the highest and lowest Q P observed at SG (12 and 4 respectively). Three single shots are shown for clarity in (b), (c) and (d). Symbols shown in (a) are also used in (b), (c) and (d). Details of the different shots are given in Table 2.

This average value gives a useful indication of the high seismic attenuation generally observed in our data, but is not the only way to interpret the results. In fact, when we observe all the data points in Figure 5, clear breaks in slope (Fig. 5b–d) suggest that Q P decreases at high δt. We identify two regions of different slope, one at low/central δt (which corresponds to geophones positioned between 20 and 65 m) with higher Q P (∼8), and a second region at high bt (65–90 m) with Q P as low as 4. Results of the Q P computation using all the receiver pairs and dividing the data points into two regions are listed in Table 3. R 2 values are typically high, except at high bt in SG6j (Fig. 5a and b), where the accuracy appears to be low (probably noisy data points due to poor geophone coupling).
Estimates of Q P for the uppermost ice at Storglaciären. Parenthetical ‘all’, ‘20–65’ and ‘65–90’ indicate the portion of the line considered in the analysis. R 2 values are also given

The results listed in Table 3 were calculated with Equation (5), using the amplitude recorded in the receiver located at 15 m offset as A 0. We can also investigate potential changes in Q P values using different receivers as the reference. Figure 6 shows that m and Q P, for a given range of A 1, are the same, even when different geophones are used. The only differences generated by changing the reference geophone are changes in intercept. Q P is higher (∼9) at low/central δt and is clearly lower (∼5) at higher travel times (Fig. 6).
Plot of γ vs δt for SG7j-2 using different geophones as reference signal, A 0 in Equation (5). Changes in slope, m (and thus Q P), are consistent along the seismic line even when different geophones are used. Changes in intercept are probably due to changes in the absolute amplitude of arrivals recorded at different geophones. Different symbols are for different reference geophones. G15, G20, G25 and G30 indicate that the reference arrival has been extracted from the geophone located at 15, 20, 25 and 30 m, respectively.

The measurement error associated with m was calculated using the standard error of the regression line. Errors in m, ∊m, were then converted to errors in Q P, ∊Q P, combining Equation (7) with the standard equations for error propagation (e.g. Reference ToppingTopping, 1972); these equations are commonly used to calculate the error of compound quantities:

Errors in Q P are generally low in all our experiments (Table 3) except at high δt in SG6j (Q P = 6 ± 7).
Discussion
Seismic attenuation and ice temperature. Are our estimates reasonable?
The first issue that needs to be addressed from our results in Table 3 is that these values are strikingly low compared to published examples for glacier ice (Table 1). As mentioned in the introduction, there is much evidence supporting a strong temperature dependence of Q P in glacier ice (Reference KuroiwaKuroiwa, 1964; Reference Clee, Savage and NeaveClee and others, 1969; Reference Bentley and KohnenBentley and Kohnen, 1976; Reference Jarvis and KingJarvis and King, 1993). It is therefore reasonable to consider particularly high Q P (as measured at Byrd Station by Reference Bentley and KohnenBentley and Kohnen, 1976) to be typical of glacier ice substantially colder than the melting point (average temperature −28°C). Reference Jarvis and KingJarvis and King (1993) reported much higher attenuation at the more northerly (thus warmer) Larsen Ice Shelf (ice temperature around −10°C; Reference ReynoldsReynolds, 1981; Reference Vaughan and DoakeVaughan and Doake, 1996).
The central value given by Reference Bentley and KohnenBentley and Kohnen (1976) is Q P = 714 at 136 Hz; deriving Q P from α (Equation (1)) for the Reference Jarvis and KingJarvis and King (1993) value gives Q P = 68 at 136 Hz. Thus, the seismic quality factor appears to be more than ten times higher if ice temperature is increased by ∼18°C. Estimates in temperate ice (Reference WestphalWestphal, 1965; Reference Clee, Savage and NeaveClee and others, 1969) are not easy to compare since they have been derived for much higher frequencies (kHz) than those reported by Reference Bentley and KohnenBentley and Kohnen (1976) and Reference Jarvis and KingJarvis and King (1993) and used in the work presented here.
The temperature profile with depth from a thermistor string adjacent to the seismic line is shown in Figure 7. Temperature data were collected and processed as described by Reference Pettersson, Jansson and BlatterPettersson and others (2004). At this location, Storglaciären is polythermal with a 20 m thick cold surface layer (lowest temperature about −1.5°C) underlain by temperate ice. The temperature profile is particularly important in the interpretation of our estimates, but the interpretation is not straightforward. What ice temperature do our Q P estimates relate to? What depth is sampled by the propagating P-wave?
Temperature profile with depth (dots, dashed curve) from the thermistor string located where the seismic line was acquired at Storglaciären. The maximum size of the radii of the first Fresnel volume (thus the depth sampled by the ray path) calculated using Equation (9) is shown as black, solid lines. The Fresnel volume is frequency-dependent, and the frequencies used in our seismic-attenuation analysis (100, 200 and 300 Hz) are shown. Temperature and Fresnel volume depth are plotted on the same graph to show how higher offsets are sampling warmer ice.

One way to answer these questions is by looking at the Fresnel volume: the finite volume of space around the geometric ray path that influences the propagation of a band-limited wave (Reference Spetzler and SniederSpetzler and Snieder, 2004). Thus the maximum depth, q, sampled by a propagating P-wave is the radii of the Fresnel volume given by Reference Spetzler and SniederSpetzler and Snieder (2004) as:

where λ and x are wavelength and offset, respectively. Figure 7 shows the depth of the first Fresnel volume superimposed on the temperature profile for the bandwidth used in our study. The Fresnel volume increases with offset, changing from 12 to 25 m for 100 Hz energy. It is therefore likely that far-offset receivers sampled a wave which propagated in warmer ice than the one sampled by near-offset receivers. Thus, if we define the maximum effective depth as that sampled by the lowest frequency (100 Hz) we can conclude that differences in m and Q P observed in Figures 5 and 6 are probably due to the fact that earlier arrivals propagate principally in cold ice (with temperature around −1°C; Fig. 7) whereas at higher δt the low Q P values are generated by a wave propagating in warmer ice, probably, at least partially, in the temperate ice.
Frequency-dependent Q and temporal variations
The methodology applied in this study appears to be an efficient tool for monitoring the thermal state of glaciers using frequency-independent Q P estimates. The advantage of the frequency-independent estimate is that we have quantified the variability in time of a number of values of γ, estimated in the frequency domain; since the wave propagates deeper at high δt, we observed temperature-related variations in our frequency-independent Q P estimates. Despite this, the deviations from linear in Figures 3c and 4 indicate there is some frequency dependence of Q P. We therefore provide an example of the calculation of Q P when it is assumed to be frequency-dependent (and thus time-independent). We apply the method suggested by Reference Jeng, Tsai and ChenJeng and others (1999): for each frequency we take the natural logarithm of the amplitude ratio A 1(f)/A 0(f), and plot it against δt. The slope of the regression line is πf/Q which gives Q for that frequency (see Equation (5)).
Figure 8 shows the spectrum of Q P in the frequency range 50–200 Hz for the two shots collected on 7 July. Absolute Q P values seem slightly lower for the morning shot (SG7j-1) than the afternoon one (SG7-2). We can use this plot to obtain a single, frequency-independent estimate of the attenuation coefficient, α, using Equation (1). A linear regression in Figure 8 is in the form Q = (π/αv)f. Thus α is derived using the slope of the line in Figure 8. This simple, though crude, calculation gives α = (3.47 ± 0.68) × 10 − 2 and (3.14 ± 0.68) × 10−2 m − 1 for SG7j-1 and SG7j-2, respectively. These values are ∼15 and ∼150 times higher than those reported by Reference Jarvis and KingJarvis and King (1993) and Reference Bentley and KohnenBentley and Kohnen (1976), respectively; this is further evidence that seismic attenuation is much higher in valley glaciers whose temperature is close to the melting point than in polar ice masses.
Attenuation spectrum for frequency-dependent Q P, computed using the spectral ratios and the method of Reference Jeng, Tsai and ChenJeng and others (1999). Only two shots are shown for clarity. Light and dark grey areas indicate the uncertainty in SG7j-1 and SG7j-2, respectively. The hatched area is common for both shots.

Temporal variations in Q P, or general seismic attenuation, are neglected in our analysis. Although the survey conditions may have changed between the morning (low melt rate) and the afternoon (high melt rate), we did not find any significant variations in our estimates. In fact, as discussed in the previous section, the depth of ice sampled by our data is probably insensitive to surface variations. Minor exceptions include the anomalies observed at high δt in SG6j (Fig. 5b) and the slightly higher Q P for the morning shot in the frequency-dependent calculation (Fig. 8). We believe that these are insufficient to confirm temporal Q P variations; nonetheless we recognize that understanding temporal variations (e.g. hydrologically forced) of Q P could be an exciting way to improve our understanding of the relationship between seismic attenuation and other ice properties, such as temperature and water content.
Conclusions and Outlook
Seismic-refraction surveys have been carried out in the upper ablation area of Storglaciären in order to estimate seismic P-wave attenuation using the quality factor, Q P. A methodology, based on the spectral-ratio method, has been tested and is discussed in terms of its ability to offer new insights into the geophysical characterization of glacier ice properties. We have undertaken spectral analysis on 15 subsequent arrivals, covering a total geophone spread of 90 m. Results of this analysis show that average seismic attenuation in the uppermost 10–25 m of Storglaciären is very high (Q P ∼ 6), around 10 and 100 times higher than previously reported on the Larsen Ice Shelf (Reference Jarvis and KingJarvis and King, 1993) and at Byrd Station (Reference Bentley and KohnenBentley and Kohnen, 1976), respectively. Such differences are explained by noting that the average ice temperature which influences our data is about −1°C, whereas it was about −10°C for Reference Jarvis and KingJarvis and King (1993) and −28°C for Reference Bentley and KohnenBentley and Kohnen (1976). In agreement with previous laboratory measurements (Reference KuroiwaKuroiwa, 1964), we provide further field evidence that seismic attenuation in ice masses is significantly increased by raising ice temperature.
We observe that Q P is lowered from 8 ± 1 to 5 ± 1 in the far-offset region of the seismic line. Since the wave propagates deeper at far offsets we interpret this variation by considering the ice-temperature profile with depth of our study area: far-offset arrivals sampled deeper, warmer and thus more attenuative ice. Consequently this technique seems to be sensitively dependent on ice temperature. Future developments, perhaps combined with radar surveys and by moving the shot position along the same seismic line, could offer new ways to detect the thermal state of ice masses.
The dependence of seismic attenuation on glacier-ice water content is still unclear. Quantitatively relating liquid water content and Q P in temperate glacier ice is an exciting challenge for the future. We believe that introducing this methodology represents a valuable addition to characterizing glacier ice properties using in situ geophysical surveys. We hope that seismic Q P estimates in glacier ice will become more common in reports of the hydrological and thermal characteristics of glaciers. Finally, we suggest that further combined application of radar and seismic techniques will enhance our understanding of ice rheology and contribute to continued improvements in ice-flow models.
Acknowledgements
A.G. is funded by a Swansea University postgraduate scholarship and Consorzio dei Comuni del Bacino Imbrifero Montano dell’Adda. A.D.B. is supported by the GLIMPSE project funded by the Leverhulme Trust. Fieldwork was funded by Swansea University and the Dudley Stamp Memorial Fund. R. Pettersson kindly provided temperature data, B. Reinardy helped with data acquisition and D. Hjelm gave field assistance. We thank P. Jansson, H. Törnberg, G. Rosquist and C. Helanow for the excellent logistics provided at the Tarfala Research Station. Queen’s University in Belfast let us use their seismic system and C. Leech provided helpful advice about the seismic software. We thank L. Moffat, T. Blanchard and C. Reine for thoughtful discussions. This paper was significantly improved by the constructive reviews of the scientific editor M.T. Gudmundsson, F. Navarro and an anonymous reviewer.



